Climate for Station: Lahore City, Punjab, Pakistan
Loading live weather...
Climate Analysis & Overview
Lahore's climate is experiencing a complex interplay of cooling highs and warming lows, with precipitation becoming more concentrated over the past decade. This dynamic shift poses challenges and opportunities for regional climate strategies aimed at sustainability and resilience.
Climatic Context and Geography
Lahore, situated at 31.55°N, 74.333°E, experiences a semi-arid climate under the Köppen classification. This classification is characterised by hot summers and mild winters, influenced by its geographical position in the Punjab region. The city is far from any major water bodies, which contributes to its significant temperature variations. The surrounding plains and nearby Himalayan foothills also play a role in modulating the local climate, often leading to intense heat during summer months.
Temperature Trends: Cooling Highs, Warming Lows
Over the all-time period, Lahore has experienced a slight cooling trend in high temperatures, with a decrease of 0.39°C (0.70°F). This cooling might seem counterintuitive given global warming narratives but reflects the complexity of regional climate dynamics. Conversely, the low temperatures have shown a warming trend of 0.39°C (0.70°F), indicating warmer nights over the years. In the last decade, the highs have cooled by a more pronounced 1.01°C (1.82°F), while the lows have warmed by 0.80°C (1.44°F). This divergence in temperature trends suggests a narrowing of the diurnal temperature range, which could have implications for local agriculture and energy consumption patterns.
Precipitation Patterns: Increasing Concentration
The Precipitation Concentration Index (PCI) for Lahore has increased from a baseline of 22.7 to a current value of 25.4. The PCI measures how precipitation is distributed over time, with higher values indicating more concentration in fewer events. This significant increase suggests that rainfall is becoming more episodic and intense, potentially leading to challenges such as flash flooding and water management issues. Such changes necessitate adaptive strategies to manage water resources effectively, aligning with Pakistan's broader climate resilience goals.
Extreme Temperature Records
Lahore has recorded extreme temperatures with a maximum of 50.2°C (122.4°F) and a minimum of -0.6°C (30.9°F). These records underscore the city's vulnerability to temperature extremes, which can exacerbate heat stress and impact public health. The high temperature records reflect the intensity of summer heatwaves, while the minimum values highlight the potential for cold snaps during winter.
Implications for Regional Climate Goals
The observed climatic trends in Lahore are critical for informing Pakistan's regional climate strategies, particularly in the context of the country's commitments to the Paris Agreement. The cooling of high temperatures, warming lows, and increased precipitation concentration require targeted interventions to enhance climate resilience. These include improving urban planning, enhancing water management infrastructure, and promoting sustainable agricultural practices to adapt to the evolving climate landscape.
Station Statistics
10-Year Trend
High: -2.39 °F/decade
Low: +0.81 °F/decade
Rain: +0.024 in/decade
25-Year Trend
High: -0.71 °F/decade
Low: +0.59 °F/decade
Rain: +0.020 in/decade
50-Year Trend
High: -0.89 °F/decade
Low: +0.69 °F/decade
Rain: +0.011 in/decade
All-Time Trend
High: -0.75 °F/decade
Low: +0.55 °F/decade
Rain: +0.009 in/decade
Percentage Above-Average Days
Last 12 Months: 49.6%
This Year: 61.4%
Precipitation Concentration Index (PCI) ℹ️
Last 12 Months: 28.9
Historical Average: 25.0
Percentile Rank of Last 12 Months ℹ️
High: 27th percentile
Low: 95th percentile
Rain: 98th percentile
Change in Variance ℹ️
High: -1.3%
Low: -11.4%
Intraday: -19.6%
Data Coverage
72.9%
First Year of Data
1957
Station Location
Historical Weather Records
| Max High | Avg High | Min High | Max Avg | Avg Avg | Min Avg | Max Low | Avg Low | Min Low | Max Precipitation | Avg Precipitation | Max Snow | Avg Snow | |
|---|---|---|---|---|---|---|---|---|---|---|---|---|---|
| Record | 122.36 °F | — | 46.40 °F | 106.16 °F | — | 41.54 °F | 95.94 °F | — | 30.92 °F | 7.87 in | — | — | — |
| January | 88.16 °F | 66.51 °F | 46.40 °F | 72.68 °F | 55.19 °F | 42.26 °F | 59.00 °F | 44.83 °F | 30.92 °F | 1.57 in | 0.02 in | — | — |
| February | 92.37 °F | 73.07 °F | 50.90 °F | 75.56 °F | 61.48 °F | 46.76 °F | 65.30 °F | 50.02 °F | 32.00 °F | 2.17 in | 0.03 in | — | — |
| March | 103.41 °F | 82.53 °F | 58.10 °F | 89.24 °F | 70.80 °F | 51.26 °F | 75.22 °F | 59.05 °F | 33.80 °F | 1.75 in | 0.04 in | — | — |
| April | 116.44 °F | 95.30 °F | 67.10 °F | 98.73 °F | 82.05 °F | 58.82 °F | 84.20 °F | 68.90 °F | 50.54 °F | 2.54 in | 0.02 in | — | — |
| May | 122.36 °F | 103.16 °F | 69.26 °F | 106.16 °F | 90.32 °F | 63.68 °F | 93.20 °F | 77.58 °F | 53.24 °F | 1.04 in | 0.02 in | — | — |
| June | 121.82 °F | 104.52 °F | 80.24 °F | 105.58 °F | 93.15 °F | 74.48 °F | 95.94 °F | 82.51 °F | 62.60 °F | 2.14 in | 0.07 in | — | — |
| July | 118.06 °F | 98.32 °F | 75.20 °F | 105.35 °F | 89.37 °F | 74.48 °F | 95.29 °F | 82.14 °F | 58.10 °F | 7.87 in | 0.21 in | — | — |
| August | 116.82 °F | 96.22 °F | 77.00 °F | 103.08 °F | 87.81 °F | 73.40 °F | 92.64 °F | 80.71 °F | 62.60 °F | 4.65 in | 0.18 in | — | — |
| September | 110.01 °F | 95.18 °F | 75.02 °F | 98.06 °F | 85.64 °F | 70.70 °F | 86.90 °F | 76.80 °F | 59.90 °F | 5.38 in | 0.10 in | — | — |
| October | 105.80 °F | 90.88 °F | 68.36 °F | 89.78 °F | 78.43 °F | 62.78 °F | 84.20 °F | 66.93 °F | 51.08 °F | 2.18 in | 0.01 in | — | — |
| November | 100.40 °F | 80.93 °F | 57.74 °F | 80.64 °F | 67.16 °F | 49.28 °F | 70.34 °F | 55.87 °F | 32.00 °F | 0.94 in | 0.01 in | — | — |
| December | 90.73 °F | 71.02 °F | 48.74 °F | 75.20 °F | 57.90 °F | 41.54 °F | 59.36 °F | 47.08 °F | 30.92 °F | 0.98 in | 0.01 in | — | — |
Data Visualisations
Remove WatermarksCurrent Year Climate Trends vs Historical


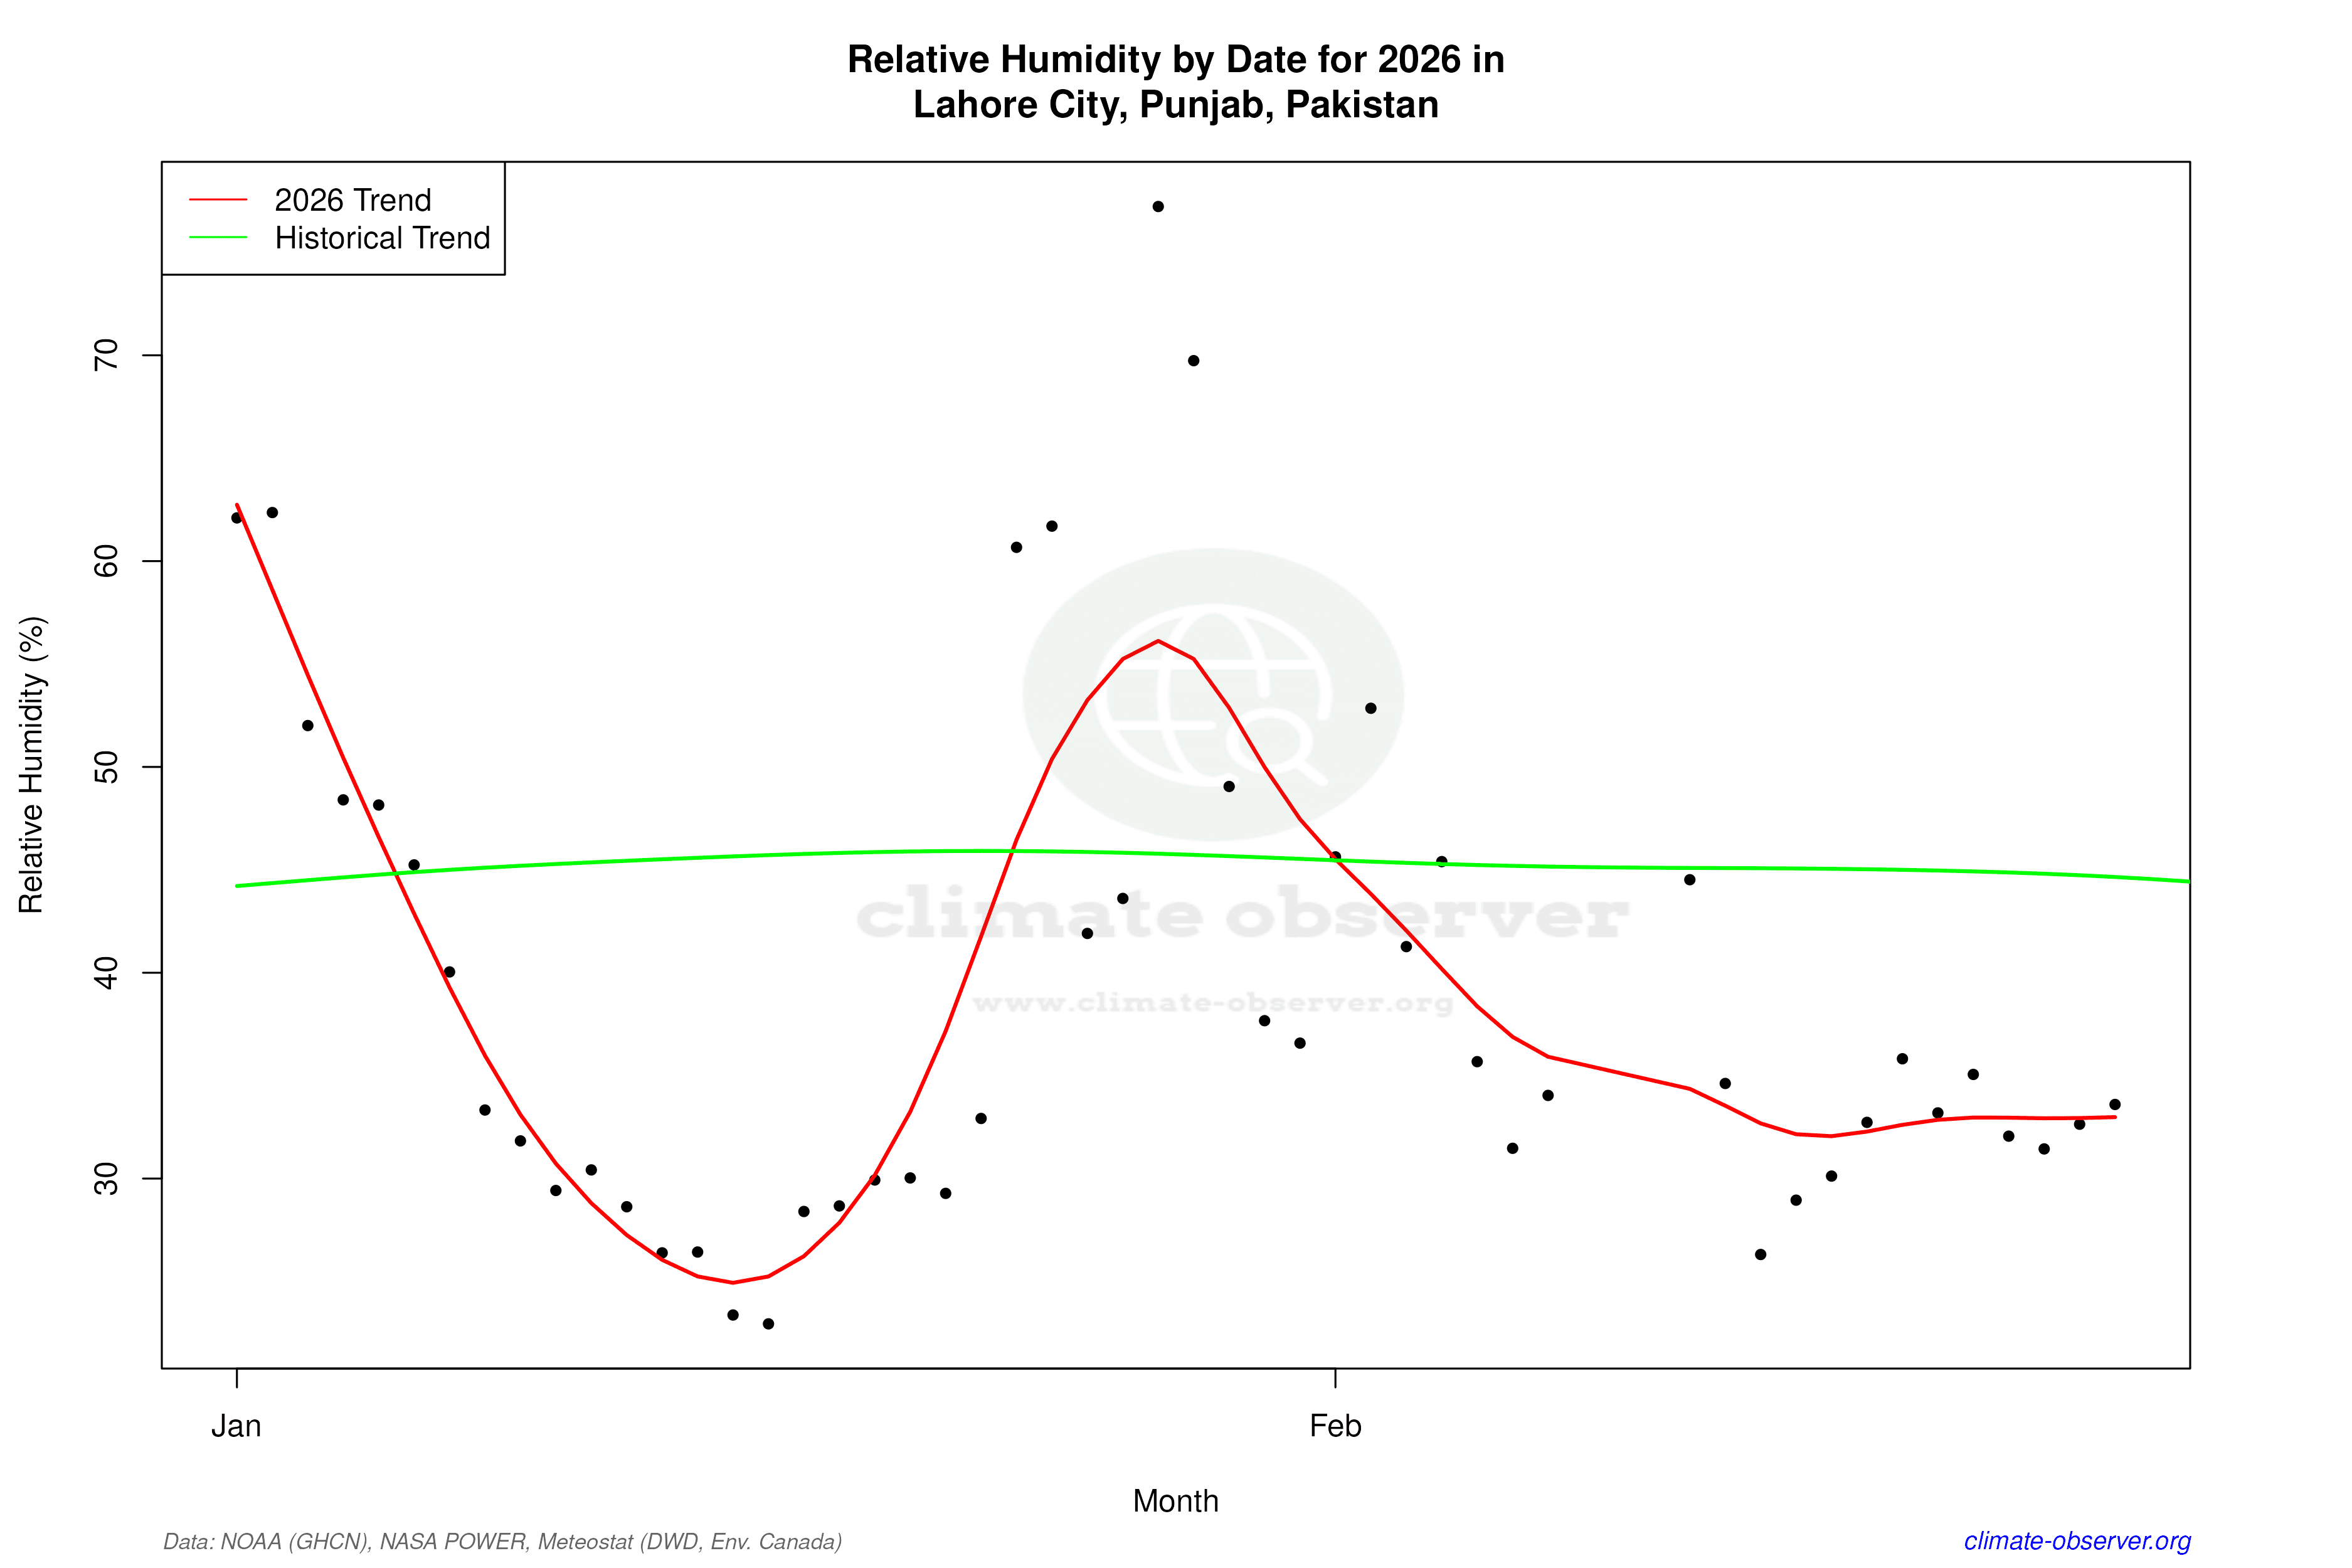

Max Temperature this Year | 1 of 6
Climate 12-Month Moving Averages


Max Temperature 12-Month MA | 1 of 6
Daily Data Points and Averages Throughout the Year


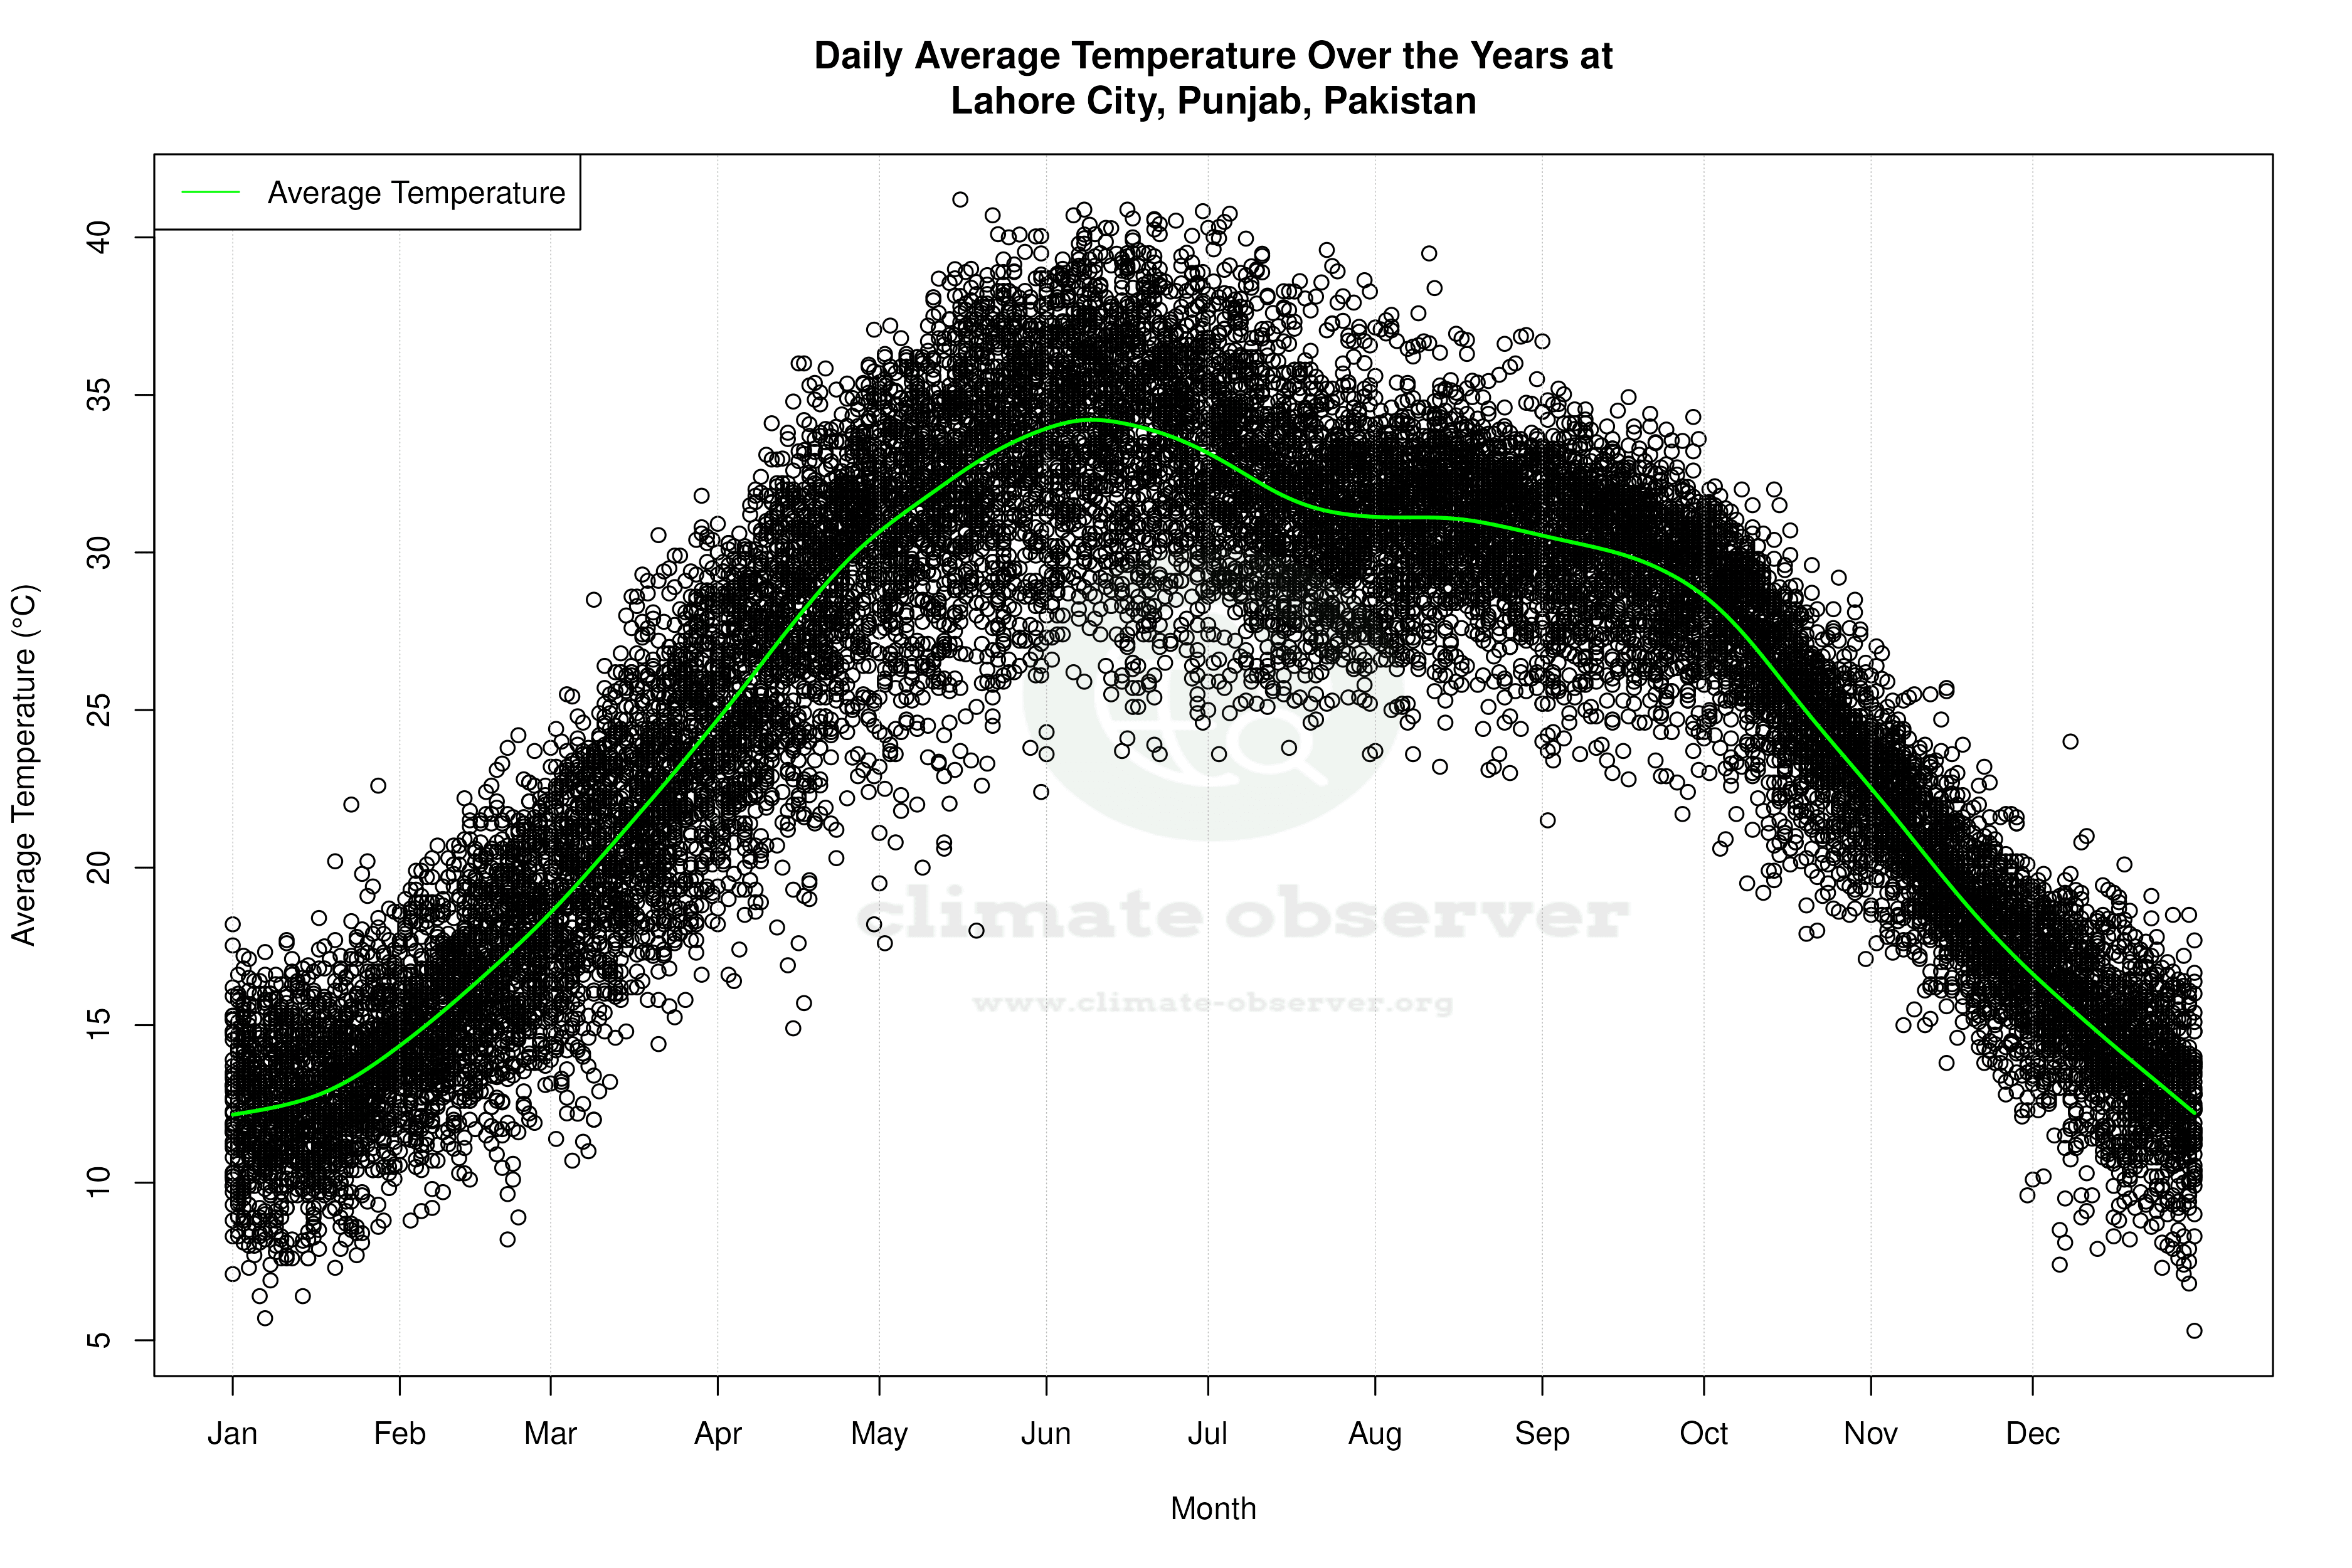


Average Max Temperature Throughout Year | 1 of 5
