Climate for Station: Leba, Pomeranian, Poland
Loading live weather...
Climate Analysis & Overview
Leba, situated on the Polish coast, is experiencing a warming trend with both high and low temperatures rising over the past decade and historically. The precipitation pattern has become slightly more even, indicating a shift towards more consistent rainfall distribution.
Coastal Climate Dynamics
Leba, located at 54.75°N, 17.5331°E in Poland, falls under the Köppen climate classification of Cfb, which is a temperate oceanic climate. Its proximity to the Baltic Sea significantly influences its weather patterns, moderating temperatures and contributing to a maritime climate. This coastal positioning often results in milder winters and cooler summers compared to inland areas.
Temperature Trends: A Warming Narrative
Over the past decade, Leba has seen a noticeable warming trend, with high temperatures increasing by 0.80°C (1.44°F) and low temperatures by 0.65°C (1.17°F). This recent trend is more pronounced when compared to the all-time historical data, where highs have risen by 0.42°C (0.76°F) and lows by 0.33°C (0.59°F). The consistent rise in temperatures suggests a broader regional warming pattern, aligning with global climate change impacts.
Precipitation Patterns: A Marginal Shift
The Precipitation Concentration Index (PCI) for Leba has slightly decreased from a baseline of 11.07 to a current value of 10.55. This marginal change indicates a shift towards a more evenly distributed rainfall pattern, suggesting that precipitation events are becoming less concentrated and more frequent throughout the year. Such changes can influence local agriculture and water management strategies, providing a more stable hydrological environment.
Temperature Extremes: Records of Note
Leba has recorded an all-time high temperature of 37.2°C (98.96°F) and a low of -23.2°C (-9.76°F). These extremes highlight the range of temperatures that can occur in this coastal region, although the overall trend points towards warmer conditions. Such records are vital for understanding the potential for extreme weather events, which can have significant impacts on infrastructure and ecosystems.
Regional Implications and Climate Goals
Poland's climate objectives include reducing greenhouse gas emissions and adapting to climate change effects. The warming trends observed in Leba underscore the importance of these goals. Recent weather events, such as unseasonal storms and heatwaves, further stress the need for robust climate adaptation strategies. As Leba continues to warm, these regional efforts will be crucial in mitigating the impacts of climate change on local communities and environments.
Station Statistics
10-Year Trend
High: +0.72 °F/decade
Low: +0.83 °F/decade
Rain: -0.010 in/decade
25-Year Trend
High: +1.15 °F/decade
Low: +0.86 °F/decade
Rain: -0.006 in/decade
50-Year Trend
High: +0.96 °F/decade
Low: +0.78 °F/decade
Rain: +0.001 in/decade
All-Time Trend
High: +0.73 °F/decade
Low: +0.58 °F/decade
Rain: -0.000 in/decade
Percentage Above-Average Days
Last 12 Months: 48.8%
This Year: 24.4%
Precipitation Concentration Index (PCI) ℹ️
Last 12 Months: 10.9
Historical Average: 11.5
Percentile Rank of Last 12 Months ℹ️
High: 67th percentile
Low: 83rd percentile
Rain: 22nd percentile
Change in Variance ℹ️
High: -1.9%
Low: -9.9%
Intraday: +0.7%
Data Coverage
97.1%
First Year of Data
1966
Station Location
Historical Weather Records
| Max High | Avg High | Min High | Max Avg | Avg Avg | Min Avg | Max Low | Avg Low | Min Low | Max Precipitation | Avg Precipitation | Max Snow | Avg Snow | |
|---|---|---|---|---|---|---|---|---|---|---|---|---|---|
| Record | 98.96 °F | — | 7.52 °F | 83.66 °F | — | 1.58 °F | 71.28 °F | — | -9.76 °F | 2.80 in | — | — | — |
| January | 55.40 °F | 35.54 °F | 7.52 °F | 52.52 °F | 32.09 °F | 3.02 °F | 50.18 °F | 27.23 °F | -9.76 °F | 0.79 in | 0.06 in | — | — |
| February | 62.24 °F | 36.83 °F | 12.56 °F | 53.96 °F | 32.57 °F | 1.58 °F | 48.20 °F | 27.83 °F | -5.80 °F | 1.05 in | 0.05 in | — | — |
| March | 72.68 °F | 42.67 °F | 20.48 °F | 58.46 °F | 36.97 °F | 13.28 °F | 49.28 °F | 31.33 °F | -1.12 °F | 0.83 in | 0.04 in | — | — |
| April | 84.20 °F | 50.51 °F | 32.36 °F | 72.68 °F | 43.34 °F | 30.20 °F | 59.36 °F | 36.22 °F | 18.50 °F | 1.02 in | 0.04 in | — | — |
| May | 90.32 °F | 59.66 °F | 38.84 °F | 76.46 °F | 51.89 °F | 35.60 °F | 66.74 °F | 43.88 °F | 23.36 °F | 1.46 in | 0.06 in | — | — |
| June | 92.12 °F | 65.77 °F | 49.10 °F | 81.14 °F | 58.70 °F | 42.80 °F | 69.80 °F | 51.05 °F | 29.12 °F | 1.58 in | 0.07 in | — | — |
| July | 93.92 °F | 69.84 °F | 56.84 °F | 80.78 °F | 62.95 °F | 52.52 °F | 71.28 °F | 55.66 °F | 39.56 °F | 2.28 in | 0.09 in | — | — |
| August | 98.96 °F | 70.18 °F | 55.22 °F | 83.66 °F | 62.95 °F | 50.90 °F | 70.52 °F | 55.29 °F | 35.24 °F | 2.80 in | 0.10 in | — | — |
| September | 89.78 °F | 63.62 °F | 46.22 °F | 75.56 °F | 56.81 °F | 40.82 °F | 66.92 °F | 50.08 °F | 27.50 °F | 1.65 in | 0.10 in | — | — |
| October | 81.68 °F | 54.83 °F | 36.14 °F | 67.10 °F | 48.76 °F | 30.92 °F | 60.13 °F | 43.18 °F | 23.00 °F | 1.77 in | 0.09 in | — | — |
| November | 68.54 °F | 44.71 °F | 22.82 °F | 56.84 °F | 40.52 °F | 16.70 °F | 53.42 °F | 36.24 °F | 11.30 °F | 1.30 in | 0.08 in | — | — |
| December | 55.22 °F | 38.28 °F | 9.68 °F | 51.62 °F | 34.86 °F | 5.18 °F | 47.73 °F | 30.51 °F | -3.46 °F | 0.90 in | 0.07 in | — | — |
Data Visualisations
Remove WatermarksCurrent Year Climate Trends vs Historical


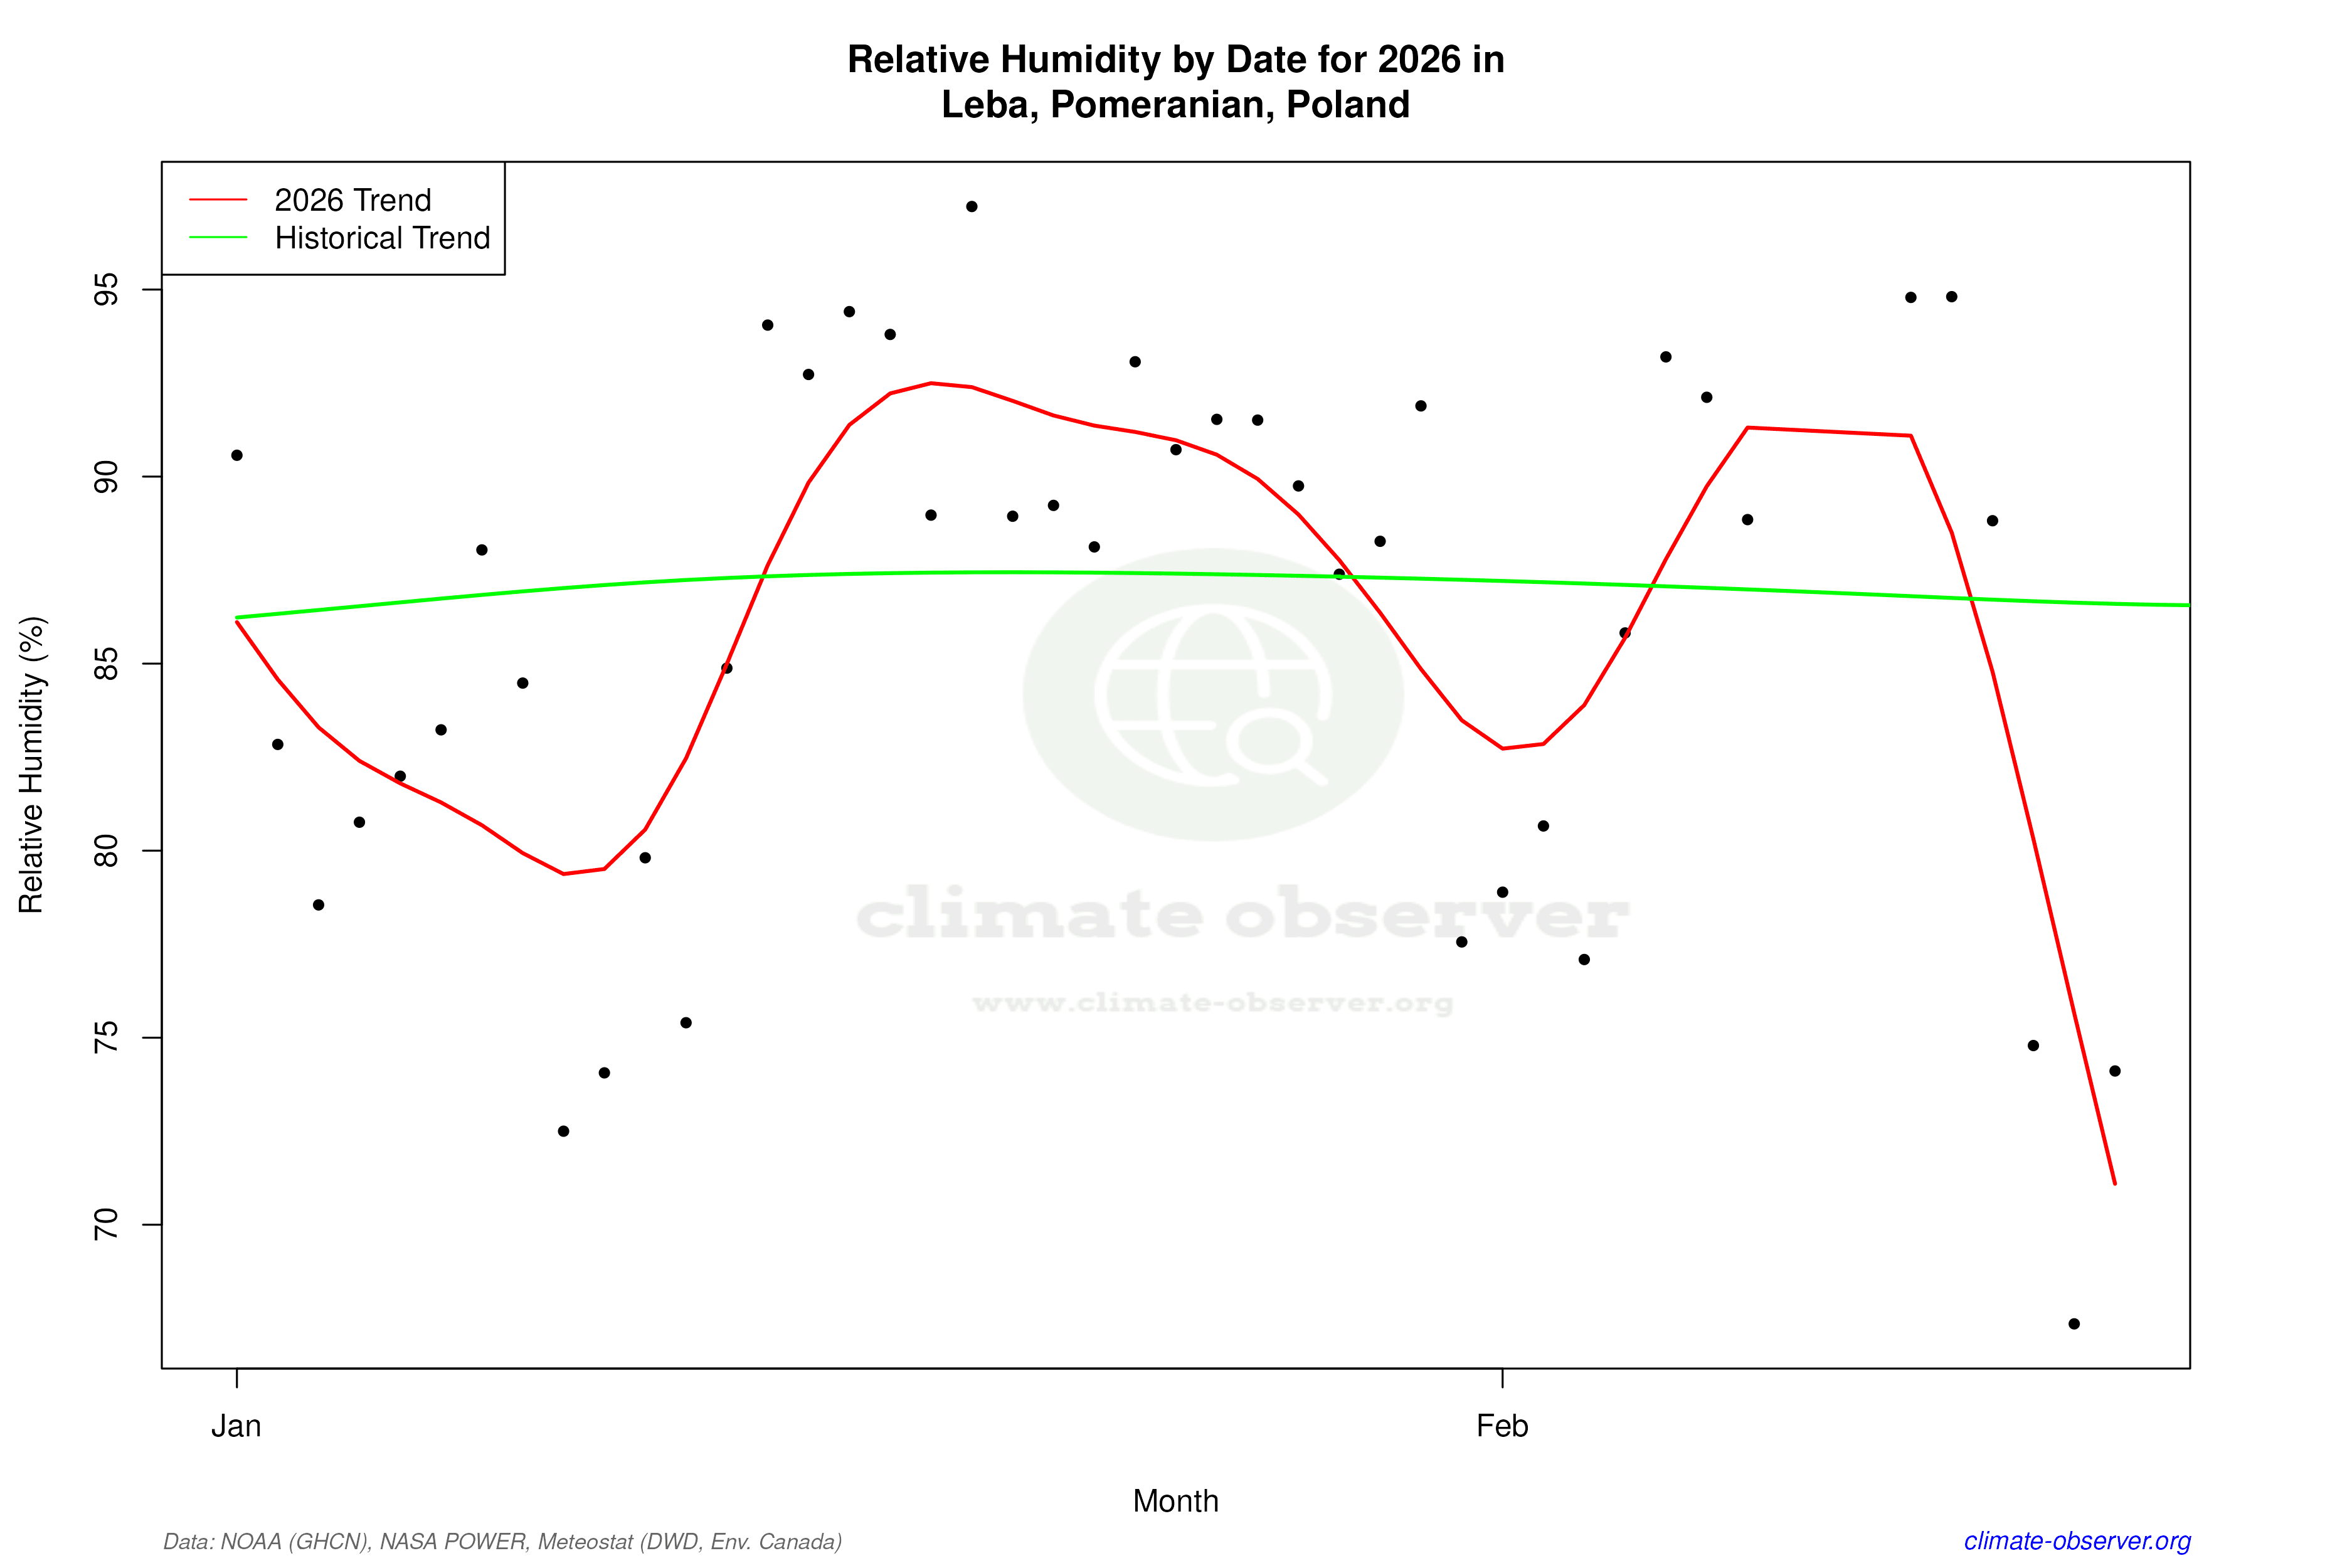

Max Temperature this Year | 1 of 6
Climate 12-Month Moving Averages


Max Temperature 12-Month MA | 1 of 6
Daily Data Points and Averages Throughout the Year


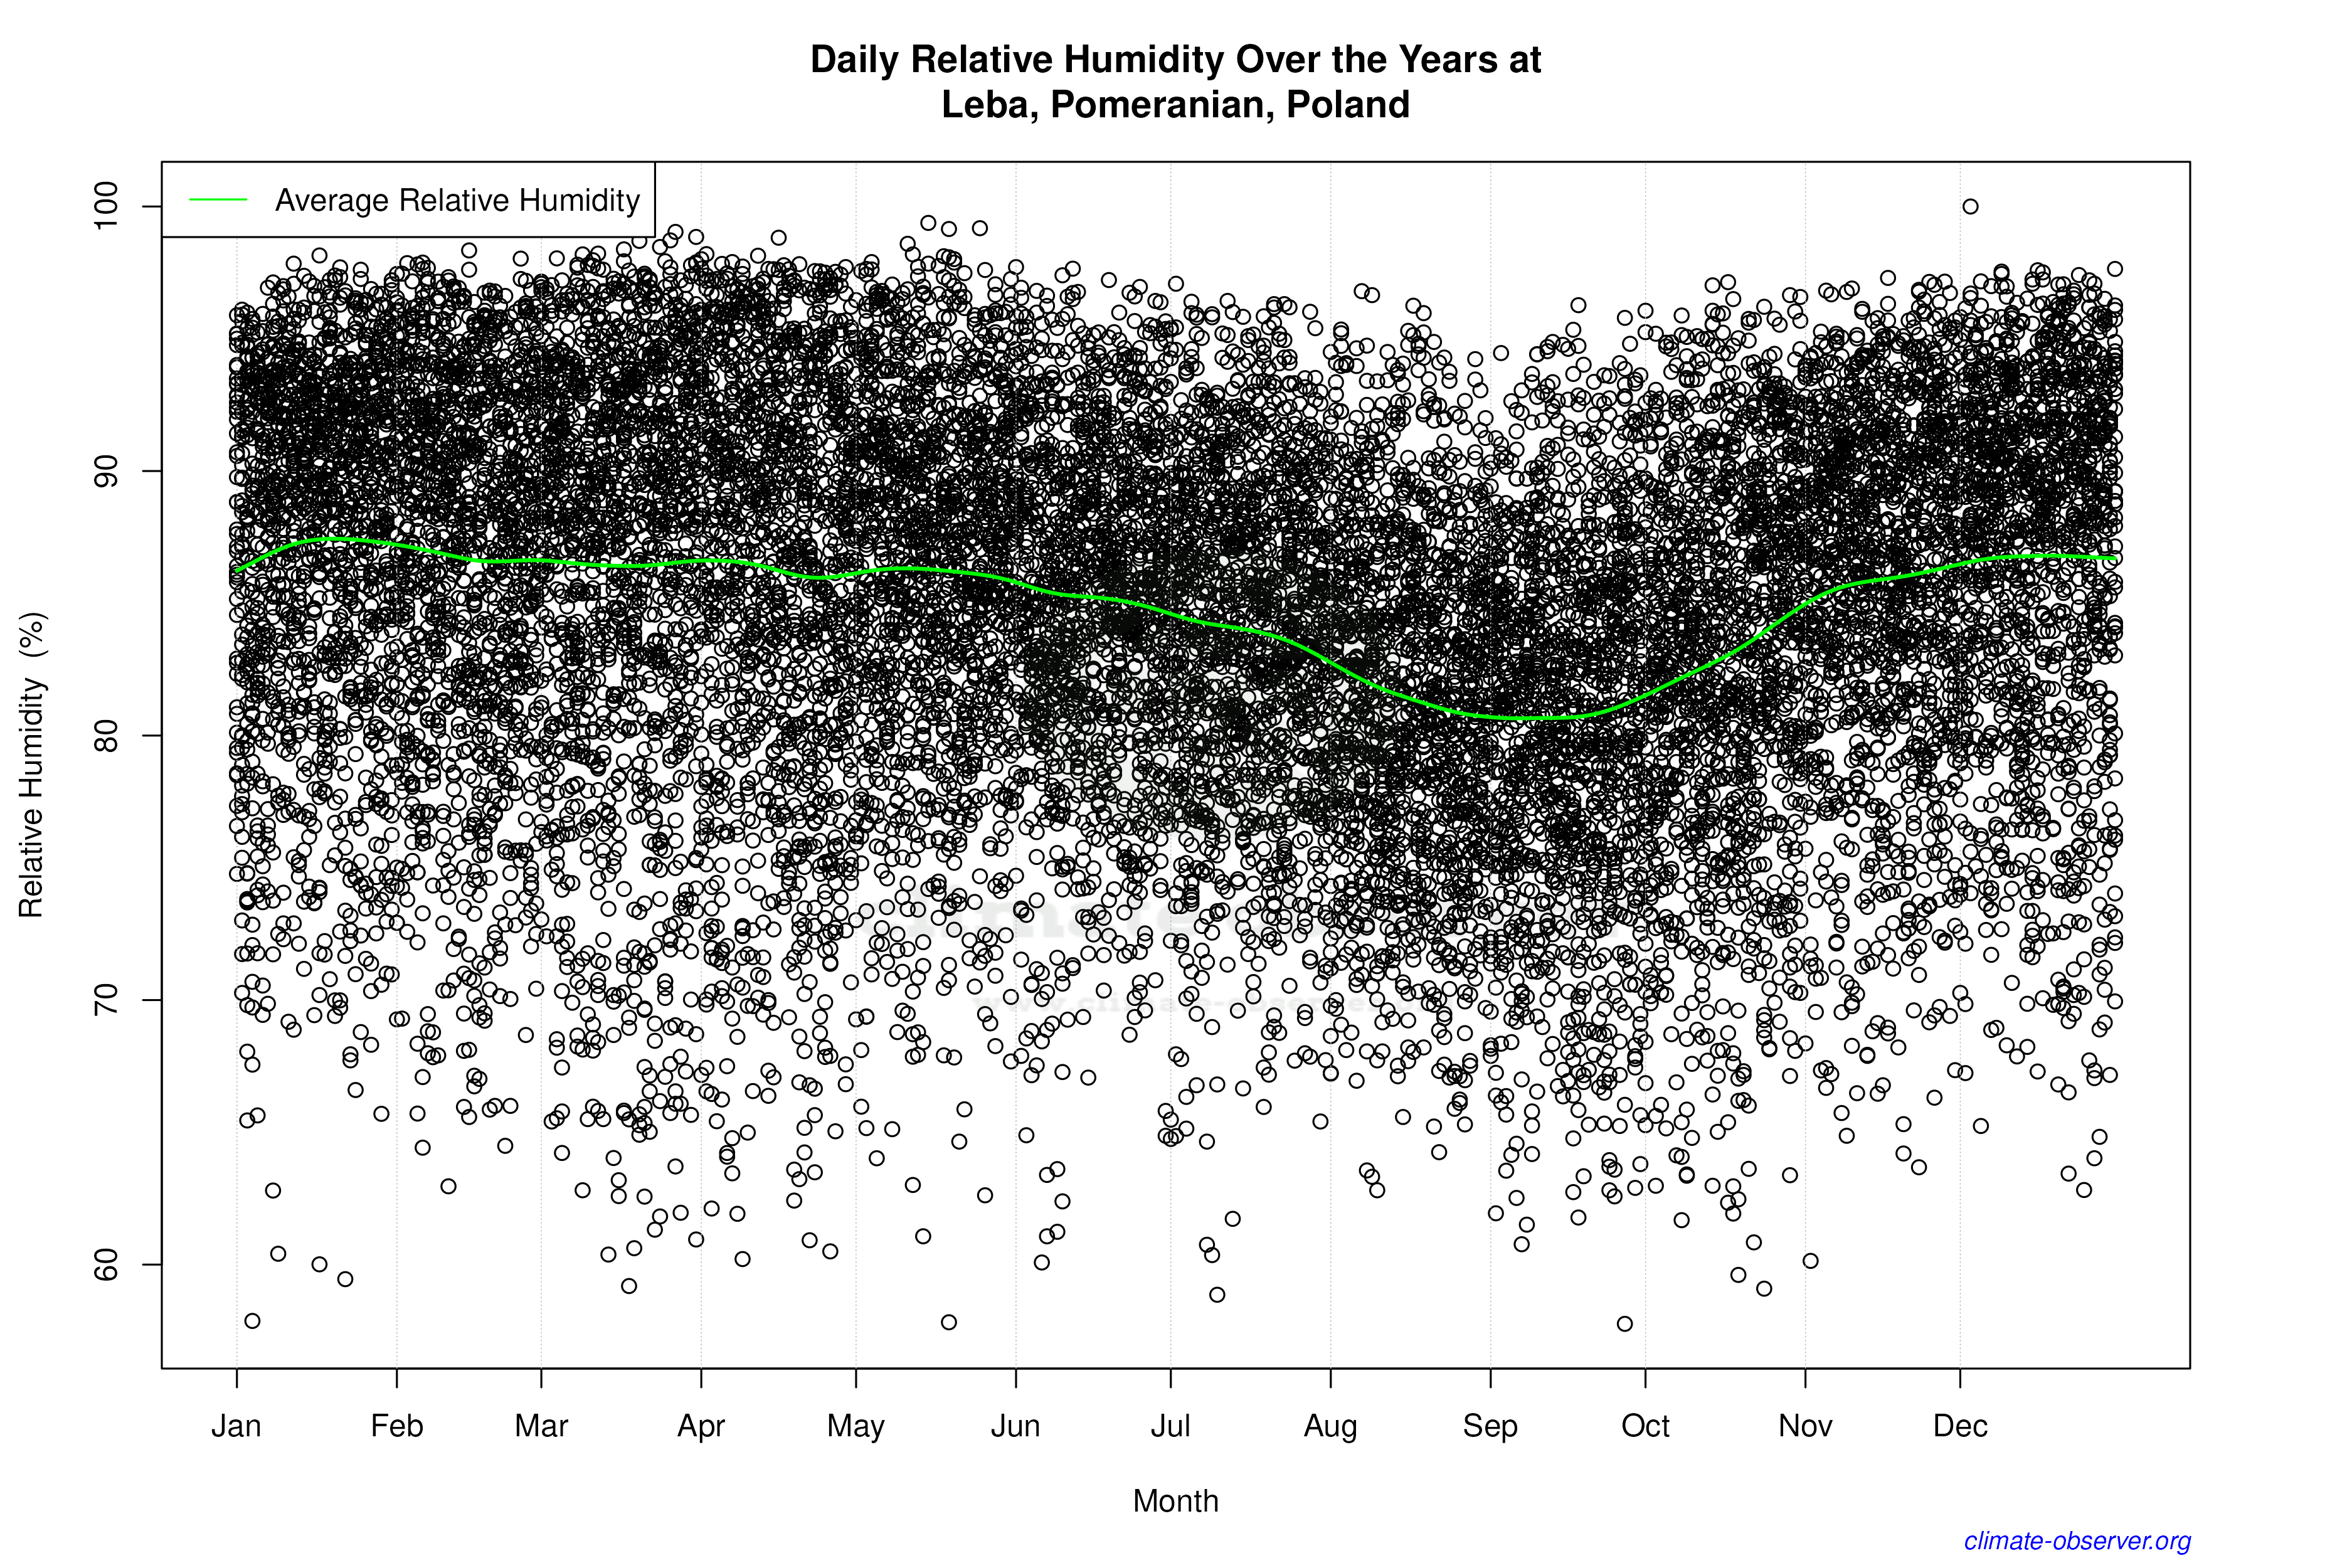

Average Max Temperature Throughout Year | 1 of 5
