Climate for Station: Porto, Portugal
Loading live weather...
Climate Analysis & Overview
Porto's climate is experiencing a notable warming trend, with significant increases in both high and low temperatures over the past decade. The precipitation pattern has become more evenly distributed, suggesting shifts in rainfall events. These changes align with broader regional climate goals aimed at understanding and adapting to climate variability.
Porto's Warming Trends
Porto, situated in the north of Portugal, has a Mediterranean climate (Csb in the Köppen classification), characterized by mild, wet winters and warm, dry summers. Over the past decade, Porto has experienced a warming trend, with average high temperatures increasing by 1.16°C (2.09°F) and lows by 0.91°C (1.64°F). This recent trend is more pronounced than the all-time warming, where highs have risen by a modest 0.01°C (0.02°F) and lows by 0.28°C (0.50°F). The discrepancy between the short-term and long-term trends suggests an acceleration in warming, possibly influenced by regional weather patterns and global climate change.
Temperature Extremes and Records
Porto's temperature records highlight the city's climate variability. The highest recorded temperature is 39.9°C (103.8°F), while the lowest is -4.1°C (24.6°F). These extremes underscore the range of thermal conditions Porto can experience, influenced by its proximity to the Atlantic Ocean, which moderates temperatures but can also lead to sudden changes due to oceanic weather systems.
Precipitation Patterns and Distribution
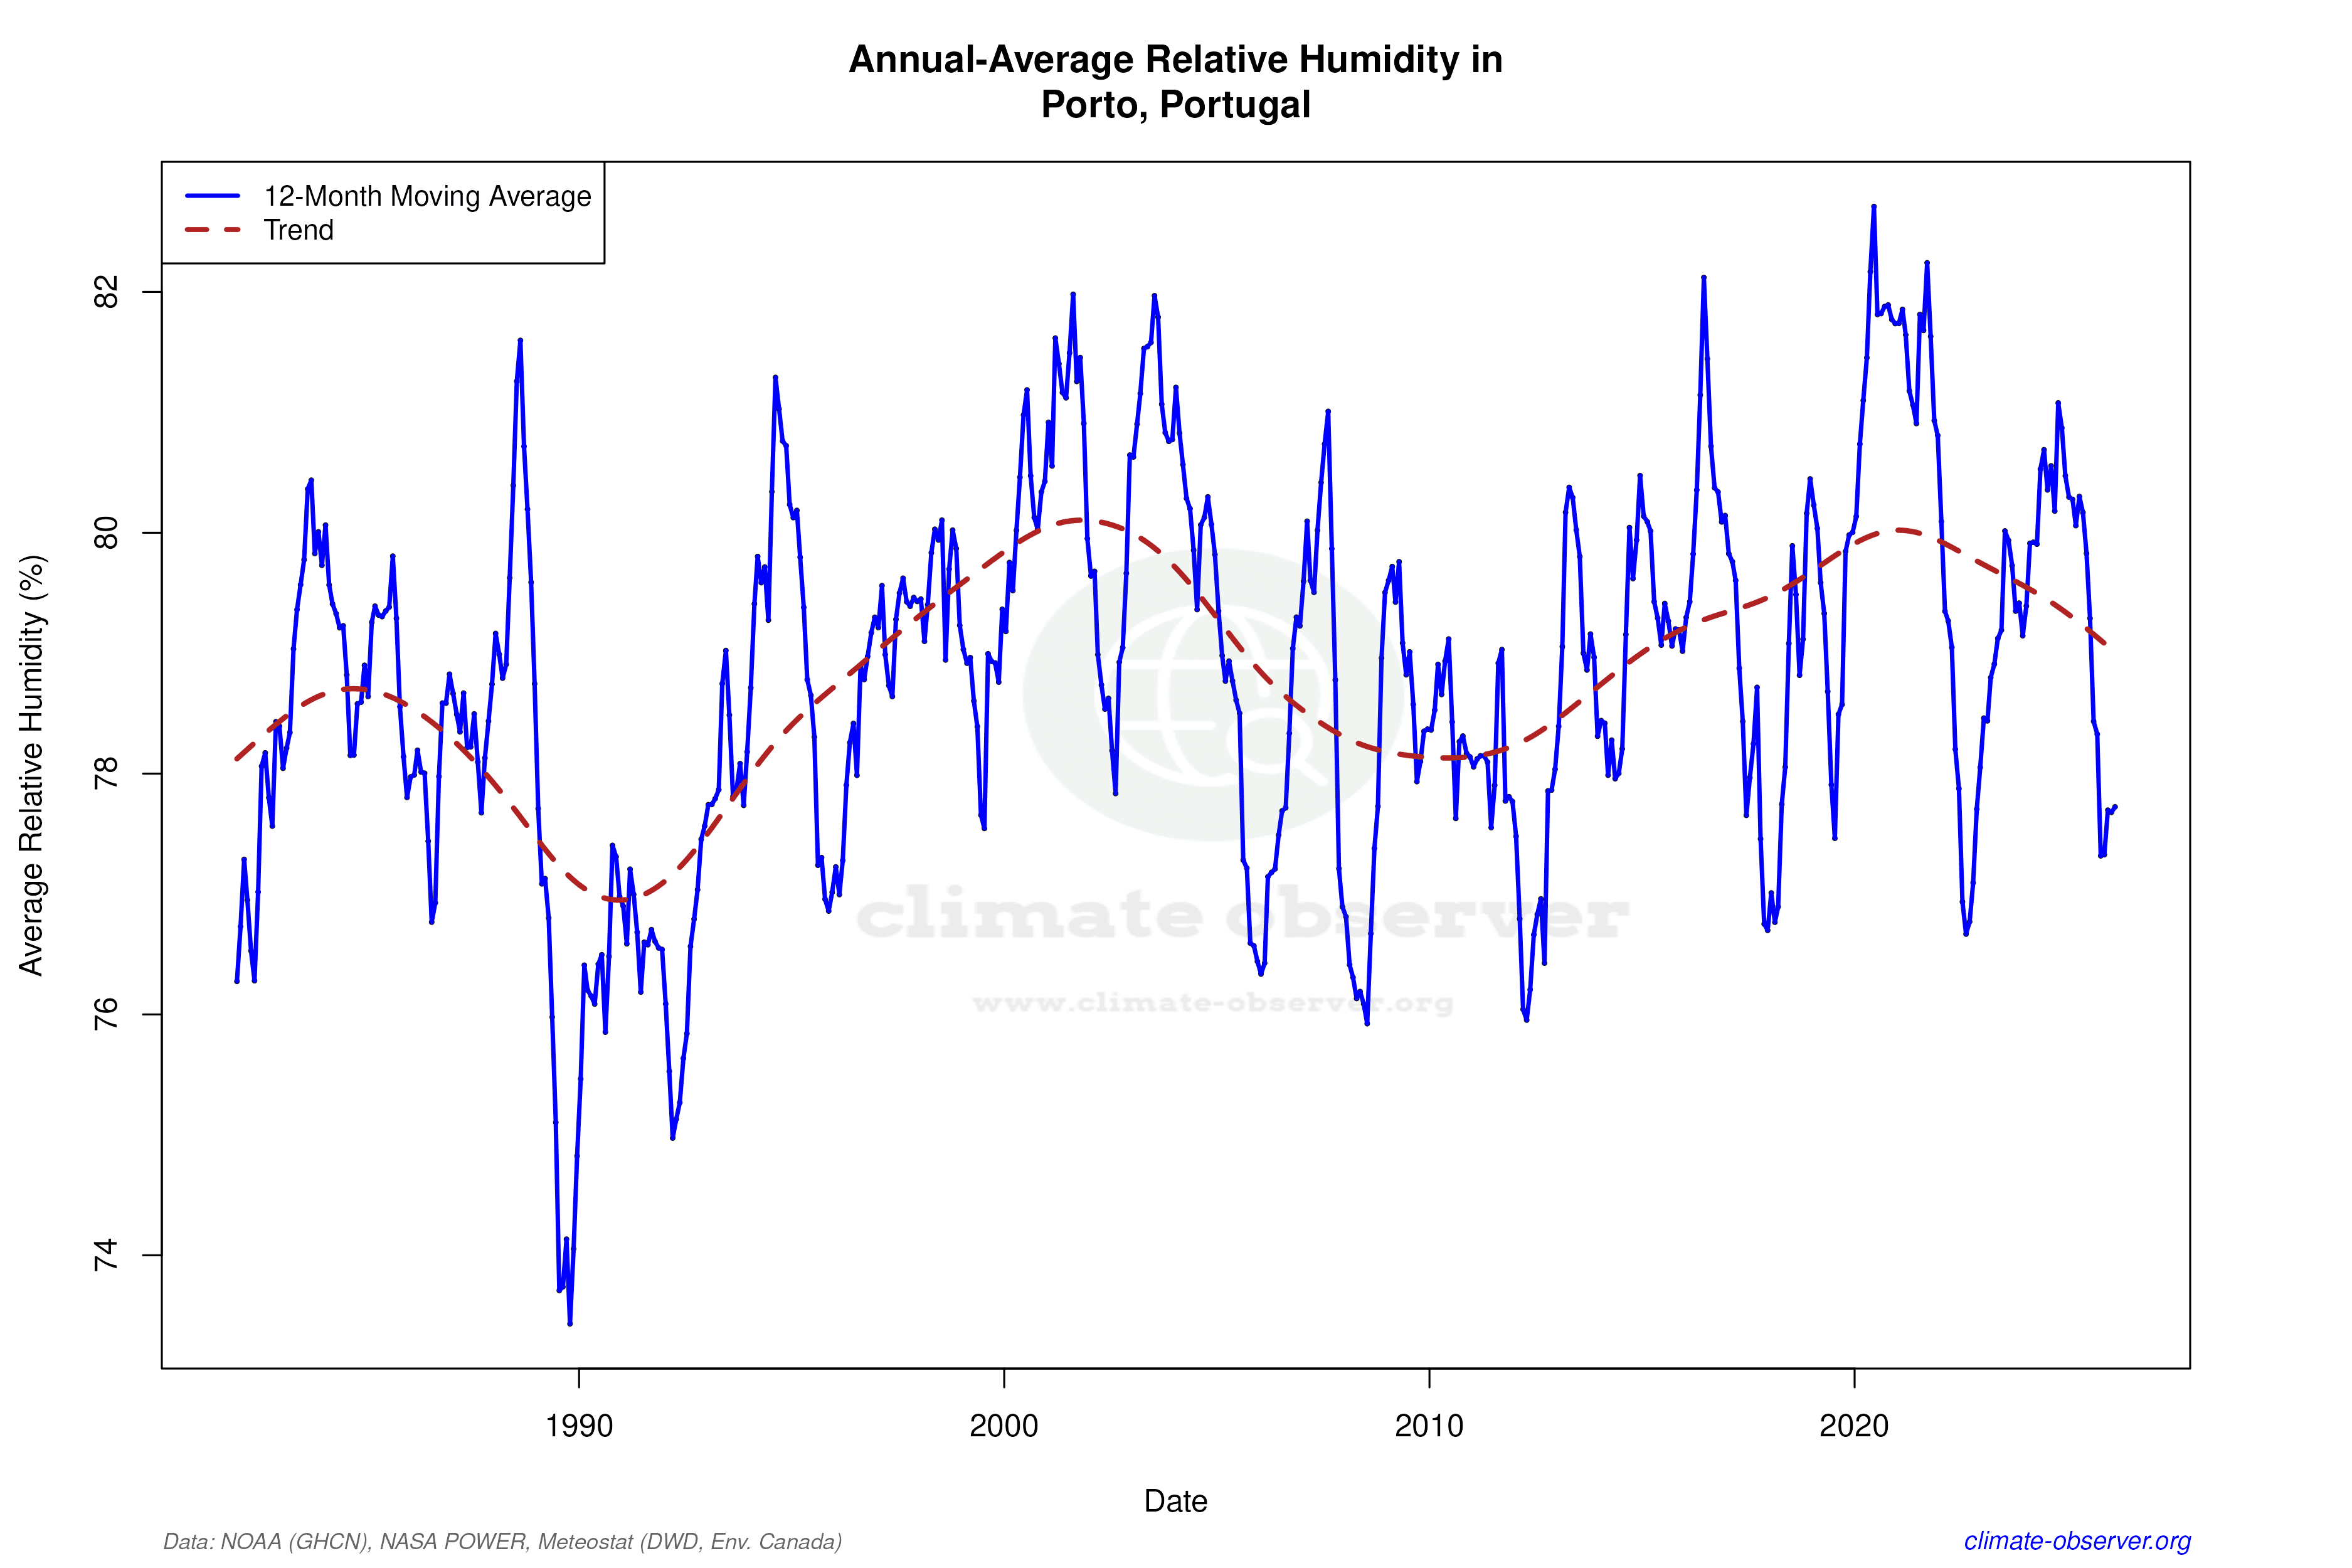
The Precipitation Concentration Index (PCI) for Porto has decreased from a baseline of 15.3 to a current value of 14.1. This indicates a more even distribution of rainfall throughout the year, as a lower PCI suggests less concentration of precipitation in fewer events. Such a shift may have implications for water management and agriculture, as more consistent rainfall can support crop growth and reduce the risk of drought.
Regional Climate Goals and Adaptation
Portugal has been proactive in addressing climate change, with initiatives aimed at reducing carbon emissions and enhancing climate resilience. Porto's recent climate trends, particularly the warming and changes in precipitation distribution, are critical data points for these regional efforts. Understanding these patterns helps in formulating strategies to mitigate adverse effects, such as heatwaves and altered water availability, ensuring sustainable development in the face of climate change.
Station Statistics
10-Year Trend
High: +1.26 °F/decade
Low: +1.10 °F/decade
Rain: +0.057 in/decade
25-Year Trend
High: +0.07 °F/decade
Low: +0.71 °F/decade
Rain: +0.007 in/decade
50-Year Trend
High: +0.25 °F/decade
Low: +0.47 °F/decade
Rain: -0.003 in/decade
All-Time Trend
High: +0.06 °F/decade
Low: +0.49 °F/decade
Rain: -0.001 in/decade
Percentage Above-Average Days
Last 12 Months: 48.2%
This Year: 37.9%
Precipitation Concentration Index (PCI) ℹ️
Last 12 Months: 16.1
Historical Average: 15.3
Percentile Rank of Last 12 Months ℹ️
High: 70th percentile
Low: 87th percentile
Rain: 83rd percentile
Change in Variance ℹ️
High: -7.1%
Low: -16.3%
Intraday: -29.5%
Data Coverage
88.7%
First Year of Data
1940
Station Location
Historical Weather Records
| Max High | Avg High | Min High | Max Avg | Avg Avg | Min Avg | Max Low | Avg Low | Min Low | Max Precipitation | Avg Precipitation | Max Snow | Avg Snow | |
|---|---|---|---|---|---|---|---|---|---|---|---|---|---|
| Record | 103.82 °F | — | 37.94 °F | 89.42 °F | — | 33.08 °F | 78.26 °F | — | 24.62 °F | 3.98 in | — | — | — |
| January | 74.66 °F | 56.71 °F | 37.94 °F | 62.96 °F | 50.06 °F | 33.08 °F | 59.00 °F | 42.46 °F | 24.62 °F | 3.42 in | 0.19 in | — | — |
| February | 78.26 °F | 58.26 °F | 42.26 °F | 63.86 °F | 51.45 °F | 35.96 °F | 59.18 °F | 43.50 °F | 25.16 °F | 2.68 in | 0.18 in | — | — |
| March | 84.38 °F | 61.75 °F | 43.52 °F | 71.42 °F | 54.25 °F | 39.02 °F | 61.34 °F | 46.38 °F | 27.86 °F | 3.15 in | 0.15 in | — | — |
| April | 89.42 °F | 64.54 °F | 47.84 °F | 76.28 °F | 56.75 °F | 43.70 °F | 67.82 °F | 48.96 °F | 32.18 °F | 2.53 in | 0.12 in | — | — |
| May | 94.46 °F | 67.81 °F | 50.72 °F | 81.86 °F | 60.70 °F | 49.46 °F | 74.30 °F | 52.78 °F | 36.68 °F | 3.36 in | 0.10 in | — | — |
| June | 100.94 °F | 72.85 °F | 55.40 °F | 86.72 °F | 65.02 °F | 53.42 °F | 75.02 °F | 57.29 °F | 42.62 °F | 2.71 in | 0.05 in | — | — |
| July | 103.82 °F | 76.21 °F | 62.06 °F | 86.18 °F | 67.88 °F | 59.00 °F | 78.26 °F | 59.40 °F | 47.84 °F | 1.68 in | 0.02 in | — | — |
| August | 102.92 °F | 76.59 °F | 63.14 °F | 89.42 °F | 68.00 °F | 57.92 °F | 75.38 °F | 59.19 °F | 45.32 °F | 1.99 in | 0.03 in | — | — |
| September | 98.24 °F | 74.39 °F | 56.30 °F | 87.98 °F | 66.00 °F | 52.70 °F | 73.22 °F | 57.69 °F | 41.90 °F | 3.31 in | 0.08 in | — | — |
| October | 93.92 °F | 69.39 °F | 53.06 °F | 76.28 °F | 61.59 °F | 46.94 °F | 68.18 °F | 53.84 °F | 34.52 °F | 3.42 in | 0.17 in | — | — |
| November | 81.86 °F | 61.96 °F | 43.88 °F | 69.98 °F | 55.37 °F | 41.00 °F | 65.30 °F | 47.74 °F | 29.66 °F | 3.98 in | 0.20 in | — | — |
| December | 76.64 °F | 57.57 °F | 38.66 °F | 64.76 °F | 51.64 °F | 38.30 °F | 65.30 °F | 44.05 °F | 27.50 °F | 3.32 in | 0.20 in | — | — |
Data Visualisations
Remove WatermarksCurrent Year Climate Trends vs Historical


Max Temperature this Year | 1 of 6
Climate 12-Month Moving Averages


Max Temperature 12-Month MA | 1 of 6
Daily Data Points and Averages Throughout the Year


Average Max Temperature Throughout Year | 1 of 5
