Climate for Station: Koror, Palau
Loading live weather...
Climate Analysis & Overview
Koror's climate profile reveals a nuanced interplay of cooling trends in high temperatures and slight warming in lows over the past decade. Precipitation has become more evenly distributed, offering a glimpse into the shifting dynamics of this tropical locale.
Tropical Climate Dynamics in Koror
Situated at latitude 7.34°N and longitude 134.48°E, Koror, Palau, is characterised by a tropical rainforest climate according to the Köppen classification. This classification suggests consistently warm temperatures and significant rainfall throughout the year. The island's geography, surrounded by the Pacific Ocean, plays a crucial role in moderating temperature fluctuations and influencing precipitation patterns.
Temperature Trends: A Decade of Cooling Highs
Over the past ten years, Koror has experienced a notable cooling trend in high temperatures, with a decrease of 1.90°C (3.42°F). This contrasts with a slight warming in low temperatures of 0.08°C (0.14°F). When we extend our view to the all-time trends, the cooling in highs is less pronounced, at 0.01°C (0.02°F), while lows have risen by 0.15°C (0.27°F). This suggests a complex interplay of factors affecting the region's thermal profile, where short-term cooling in highs may not fully align with long-term patterns.
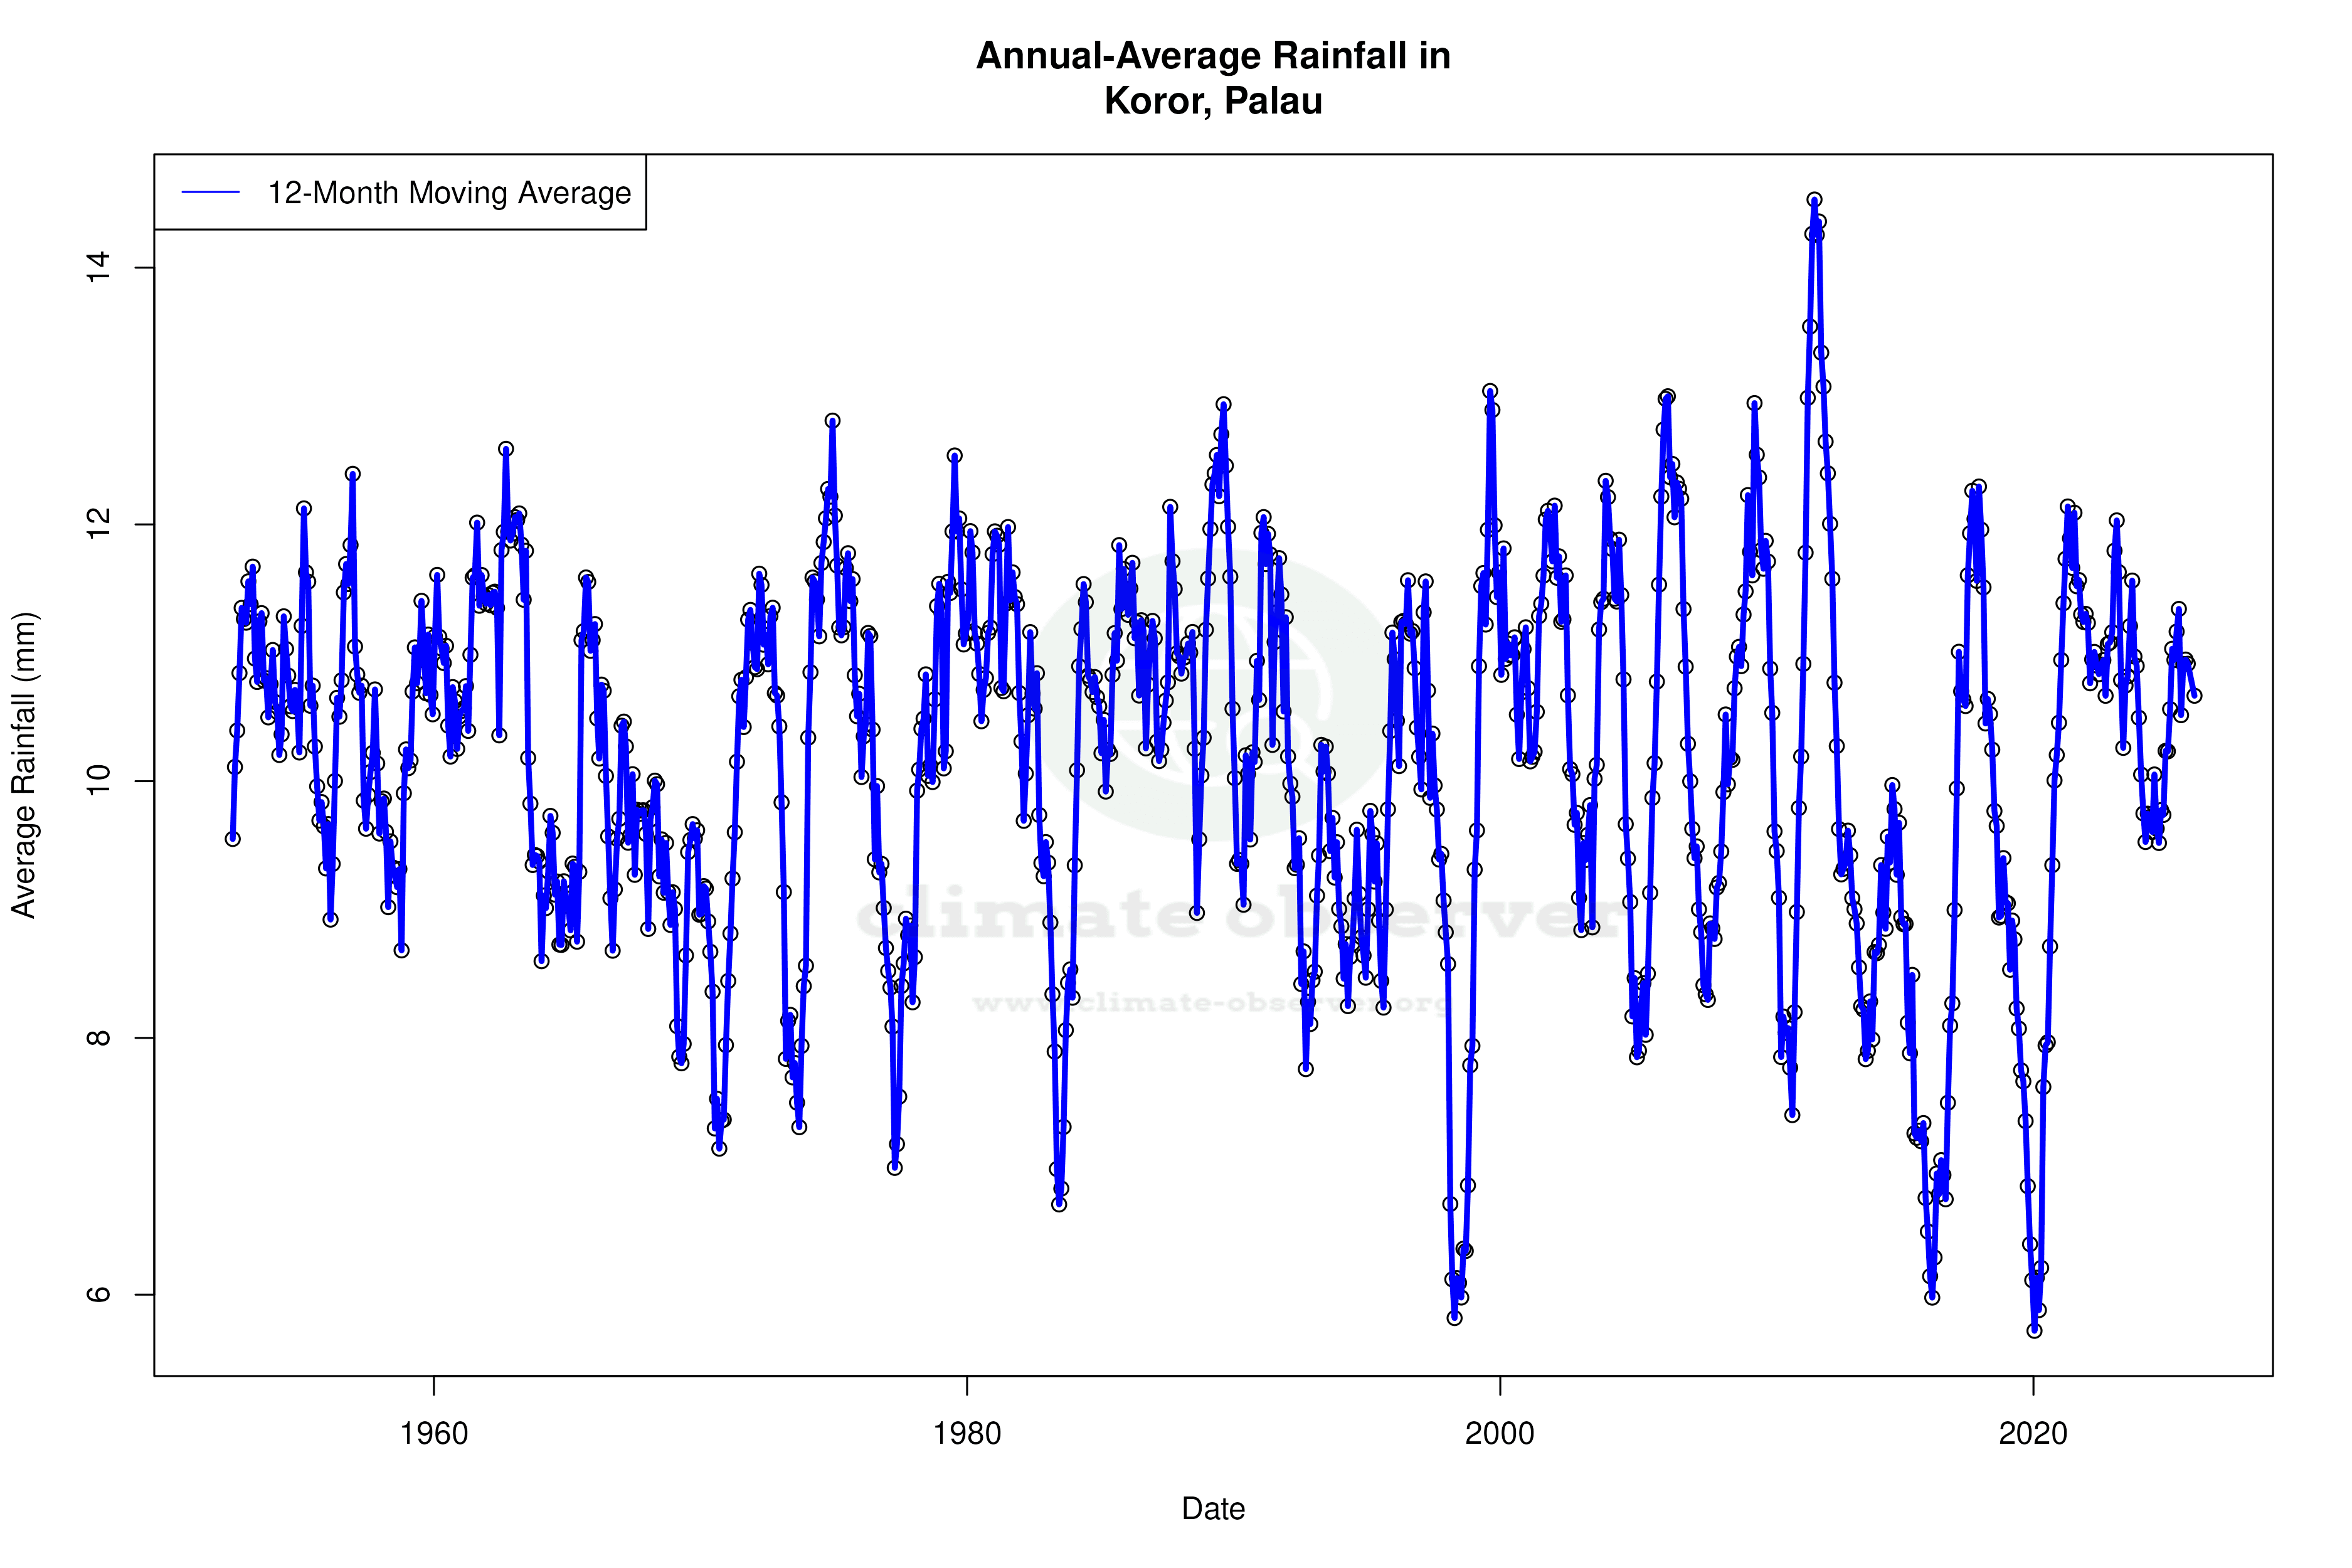
Precipitation Patterns: Shifting Towards Even Distribution
The Precipitation Concentration Index (PCI) offers insights into how rainfall is distributed over time. Koror's PCI has decreased from a baseline of 10.80 to a current value of 9.12, indicating a more even distribution of rainfall events. For a region where precipitation is a critical factor, this shift towards more evenly distributed rainfall could have significant implications for water resource management and local agriculture.
Temperature Extremes: A Historical Perspective
Koror's temperature records provide a window into the extremes experienced in this tropical setting. The highest recorded temperature stands at 35.0°C (95.0°F), while the lowest dips to 20.6°C (69.1°F). These figures underscore the relatively narrow range of temperature variation typical of tropical climates, where proximity to the equator and oceanic influences maintain a stable thermal environment.
Regional Climate Goals and Future Implications
Palau, including Koror, is engaged in regional climate initiatives aimed at sustainability and resilience in the face of climate change. The observed trends in temperature and precipitation distribution are vital for informing these efforts. As the region adapts to these changes, understanding the localised impacts of global climate phenomena becomes increasingly crucial.
Station Statistics
10-Year Trend
High: -2.99 °F/decade
Low: +0.18 °F/decade
Rain: +0.072 in/decade
25-Year Trend
High: -1.62 °F/decade
Low: +0.53 °F/decade
Rain: -0.011 in/decade
50-Year Trend
High: -0.33 °F/decade
Low: +0.46 °F/decade
Rain: -0.004 in/decade
All-Time Trend
High: -0.03 °F/decade
Low: +0.28 °F/decade
Rain: -0.003 in/decade
Percentage Above-Average Days
Last 12 Months: 14.5%
This Year: 11.2%
Precipitation Concentration Index (PCI) ℹ️
Last 12 Months: 10.1
Historical Average: 10.4
Percentile Rank of Last 12 Months ℹ️
High: 7th percentile
Low: 96th percentile
Rain: 56th percentile
Change in Variance ℹ️
High: +27.4%
Low: +42.8%
Intraday: +107.3%
Data Coverage
86.7%
First Year of Data
1947
Station Location
Historical Weather Records
| Max High | Avg High | Min High | Max Avg | Avg Avg | Min Avg | Max Low | Avg Low | Min Low | Max Precipitation | Avg Precipitation | Max Snow | Avg Snow | |
|---|---|---|---|---|---|---|---|---|---|---|---|---|---|
| Record | 95.00 °F | — | 75.92 °F | 86.72 °F | — | 74.30 °F | 86.00 °F | — | 69.08 °F | 13.72 in | — | 0.00 in | — |
| January | 93.02 °F | 87.25 °F | 77.00 °F | 84.38 °F | 81.35 °F | 74.48 °F | 82.44 °F | 75.60 °F | 69.08 °F | 13.72 in | 0.35 in | 0.00 in | 0.00 in |
| February | 93.92 °F | 87.11 °F | 75.92 °F | 84.09 °F | 81.07 °F | 75.20 °F | 82.94 °F | 75.49 °F | 69.80 °F | 7.90 in | 0.31 in | 0.00 in | 0.00 in |
| March | 95.00 °F | 87.92 °F | 80.96 °F | 84.92 °F | 81.34 °F | 75.92 °F | 83.03 °F | 75.67 °F | 69.08 °F | 6.17 in | 0.26 in | 0.00 in | 0.00 in |
| April | 95.00 °F | 88.58 °F | 80.92 °F | 85.12 °F | 82.15 °F | 74.30 °F | 83.98 °F | 76.24 °F | 69.08 °F | 12.04 in | 0.31 in | 0.00 in | 0.00 in |
| May | 93.92 °F | 88.60 °F | 80.49 °F | 85.59 °F | 82.32 °F | 74.66 °F | 84.78 °F | 76.42 °F | 71.06 °F | 9.85 in | 0.42 in | 0.00 in | 0.00 in |
| June | 95.00 °F | 87.87 °F | 78.08 °F | 85.50 °F | 81.83 °F | 74.84 °F | 83.84 °F | 75.95 °F | 71.06 °F | 8.01 in | 0.53 in | 0.00 in | 0.00 in |
| July | 93.02 °F | 87.14 °F | 78.62 °F | 86.72 °F | 81.43 °F | 75.38 °F | 82.89 °F | 75.72 °F | 69.98 °F | 8.21 in | 0.55 in | 0.00 in | 0.00 in |
| August | 93.92 °F | 87.09 °F | 78.08 °F | 86.54 °F | 81.46 °F | 74.30 °F | 82.69 °F | 76.05 °F | 69.98 °F | 7.60 in | 0.47 in | 0.00 in | 0.00 in |
| September | 91.94 °F | 87.50 °F | 78.98 °F | 85.37 °F | 81.69 °F | 75.56 °F | 82.94 °F | 76.22 °F | 69.98 °F | 5.55 in | 0.43 in | 0.00 in | 0.00 in |
| October | 93.02 °F | 87.95 °F | 78.08 °F | 85.46 °F | 81.94 °F | 75.20 °F | 86.00 °F | 76.32 °F | 71.06 °F | 6.18 in | 0.41 in | 0.00 in | 0.00 in |
| November | 93.02 °F | 88.53 °F | 80.96 °F | 85.10 °F | 82.23 °F | 76.10 °F | 83.86 °F | 76.26 °F | 69.98 °F | 7.08 in | 0.38 in | 0.00 in | 0.00 in |
| December | 93.92 °F | 87.88 °F | 78.08 °F | 84.96 °F | 81.95 °F | 75.02 °F | 83.55 °F | 75.99 °F | 71.06 °F | 7.55 in | 0.39 in | 0.00 in | 0.00 in |
Data Visualisations
Remove WatermarksCurrent Year Climate Trends vs Historical


Max Temperature this Year | 1 of 6
Climate 12-Month Moving Averages


Max Temperature 12-Month MA | 1 of 6
Daily Data Points and Averages Throughout the Year


Average Max Temperature Throughout Year | 1 of 5
