Climate for Station: Aparri, Cagayan, Philippines
Loading live weather...
Climate Analysis & Overview
Aparri, situated in the Cagayan Valley of the Philippines, is experiencing a complex climate pattern with a notable 1.27°C (2.28°F) rise in high temperatures over the past decade, juxtaposed with a 1.15°C (2.07°F) decline in low temperatures. This dynamic is set against a backdrop of more evenly distributed rainfall, as indicated by a decrease in the Precipitation Concentration Index.
Geographical Influence and Climate Classification
Aparri is located at the northern tip of Luzon, where the Cagayan River meets the Babuyan Channel. This geographical setting subjects it to a tropical monsoon climate, classified as "Am" under the Köppen system. The proximity to the ocean and the river significantly influences its weather patterns, often leading to high humidity and substantial rainfall, especially during the monsoon season. The coastal location also exposes Aparri to typhoons, which can exacerbate temperature fluctuations and precipitation patterns.
Temperature Trends: A Decade of Change
Over the last ten years, Aparri has experienced a significant warming trend in daytime temperatures, with highs increasing by 1.27°C (2.28°F). This warming trend contrasts sharply with the cooling of nighttime temperatures, which have decreased by 1.15°C (2.07°F). These opposing trends may suggest shifts in atmospheric circulation patterns or changes in cloud cover that affect day and night temperatures differently.
Long-term Temperature Stability
When examining all-time temperature trends, Aparri presents a picture of relative stability. The highs have shown a negligible increase of 0.00°C (0.00°F), while the lows have risen by 0.24°C (0.43°F). This long-term stability contrasts with the more pronounced changes observed over the past decade, suggesting that recent climatic shifts may be part of a shorter-term variability rather than a sustained long-term trend.
Precipitation Patterns: A More Even Distribution
The Precipitation Concentration Index (PCI) has decreased from a baseline of 14.76 to 13.41, indicating a more even distribution of rainfall throughout the year. This shift suggests that rainfall events are becoming less concentrated, potentially reducing the risk of extreme flooding events that can occur when precipitation is highly concentrated. This change aligns with broader regional goals to mitigate the impacts of climate variability and enhance resilience against extreme weather events.
Record Temperatures and Regional Context
Aparri's climate records show a maximum temperature of 39.2°C (102.6°F) and a minimum of 13.7°C (56.7°F). These extremes highlight the potential for significant temperature variability in the region. The Philippines has been actively working towards enhancing climate resilience, with initiatives focusing on improving weather forecasting and disaster preparedness. These efforts are crucial in a region where climate variability can have profound impacts on agriculture, infrastructure, and livelihoods.
Station Statistics
10-Year Trend
High: +1.99 °F/decade
Low: -1.99 °F/decade
Rain: +0.048 in/decade
25-Year Trend
High: -0.91 °F/decade
Low: +0.98 °F/decade
Rain: +0.045 in/decade
50-Year Trend
High: -0.25 °F/decade
Low: +0.83 °F/decade
Rain: +0.017 in/decade
All-Time Trend
High: -0.00 °F/decade
Low: +0.44 °F/decade
Rain: -0.001 in/decade
Percentage Above-Average Days
Last 12 Months: 37.3%
This Year: 4.6%
Precipitation Concentration Index (PCI) ℹ️
Last 12 Months: 13.2
Historical Average: 13.8
Percentile Rank of Last 12 Months ℹ️
High: 8th percentile
Low: 93rd percentile
Rain: 95th percentile
Change in Variance ℹ️
High: -2.3%
Low: +9.3%
Intraday: +24.1%
Data Coverage
88.9%
First Year of Data
1945
Station Location
Historical Weather Records
| Max High | Avg High | Min High | Max Avg | Avg Avg | Min Avg | Max Low | Avg Low | Min Low | Max Precipitation | Avg Precipitation | Max Snow | Avg Snow | |
|---|---|---|---|---|---|---|---|---|---|---|---|---|---|
| Record | 102.56 °F | — | 65.48 °F | 92.84 °F | — | 63.68 °F | 84.56 °F | — | 56.66 °F | 17.83 in | — | — | — |
| January | 92.12 °F | 80.15 °F | 65.48 °F | 82.76 °F | 75.08 °F | 63.68 °F | 77.74 °F | 69.72 °F | 59.00 °F | 5.16 in | 0.16 in | — | — |
| February | 101.84 °F | 82.13 °F | 68.00 °F | 84.02 °F | 76.15 °F | 65.12 °F | 77.20 °F | 70.21 °F | 56.66 °F | 2.91 in | 0.10 in | — | — |
| March | 96.80 °F | 85.59 °F | 67.28 °F | 85.46 °F | 78.92 °F | 68.72 °F | 79.52 °F | 72.43 °F | 57.74 °F | 2.48 in | 0.06 in | — | — |
| April | 99.50 °F | 89.10 °F | 71.96 °F | 88.34 °F | 81.87 °F | 71.60 °F | 83.12 °F | 75.20 °F | 64.94 °F | 2.64 in | 0.04 in | — | — |
| May | 102.20 °F | 91.51 °F | 75.92 °F | 91.04 °F | 83.86 °F | 76.28 °F | 84.04 °F | 76.95 °F | 69.80 °F | 6.02 in | 0.14 in | — | — |
| June | 102.02 °F | 92.14 °F | 79.16 °F | 92.84 °F | 84.31 °F | 74.30 °F | 84.56 °F | 77.44 °F | 69.44 °F | 8.07 in | 0.21 in | — | — |
| July | 98.96 °F | 90.96 °F | 77.00 °F | 89.96 °F | 83.73 °F | 75.02 °F | 84.56 °F | 77.29 °F | 68.00 °F | 8.78 in | 0.25 in | — | — |
| August | 99.50 °F | 90.01 °F | 78.08 °F | 89.60 °F | 83.11 °F | 75.20 °F | 84.25 °F | 76.92 °F | 68.00 °F | 8.03 in | 0.31 in | — | — |
| September | 96.98 °F | 88.98 °F | 76.10 °F | 87.44 °F | 82.52 °F | 75.02 °F | 83.34 °F | 76.42 °F | 69.80 °F | 9.96 in | 0.34 in | — | — |
| October | 102.56 °F | 86.88 °F | 75.92 °F | 86.72 °F | 81.20 °F | 74.12 °F | 82.76 °F | 75.48 °F | 67.10 °F | 10.87 in | 0.41 in | — | — |
| November | 95.90 °F | 84.15 °F | 72.14 °F | 86.72 °F | 79.22 °F | 68.90 °F | 82.40 °F | 74.03 °F | 64.40 °F | 17.83 in | 0.45 in | — | — |
| December | 91.40 °F | 80.88 °F | 70.34 °F | 82.94 °F | 76.20 °F | 67.64 °F | 79.63 °F | 71.40 °F | 60.80 °F | 7.05 in | 0.27 in | — | — |
Data Visualisations
Remove WatermarksCurrent Year Climate Trends vs Historical


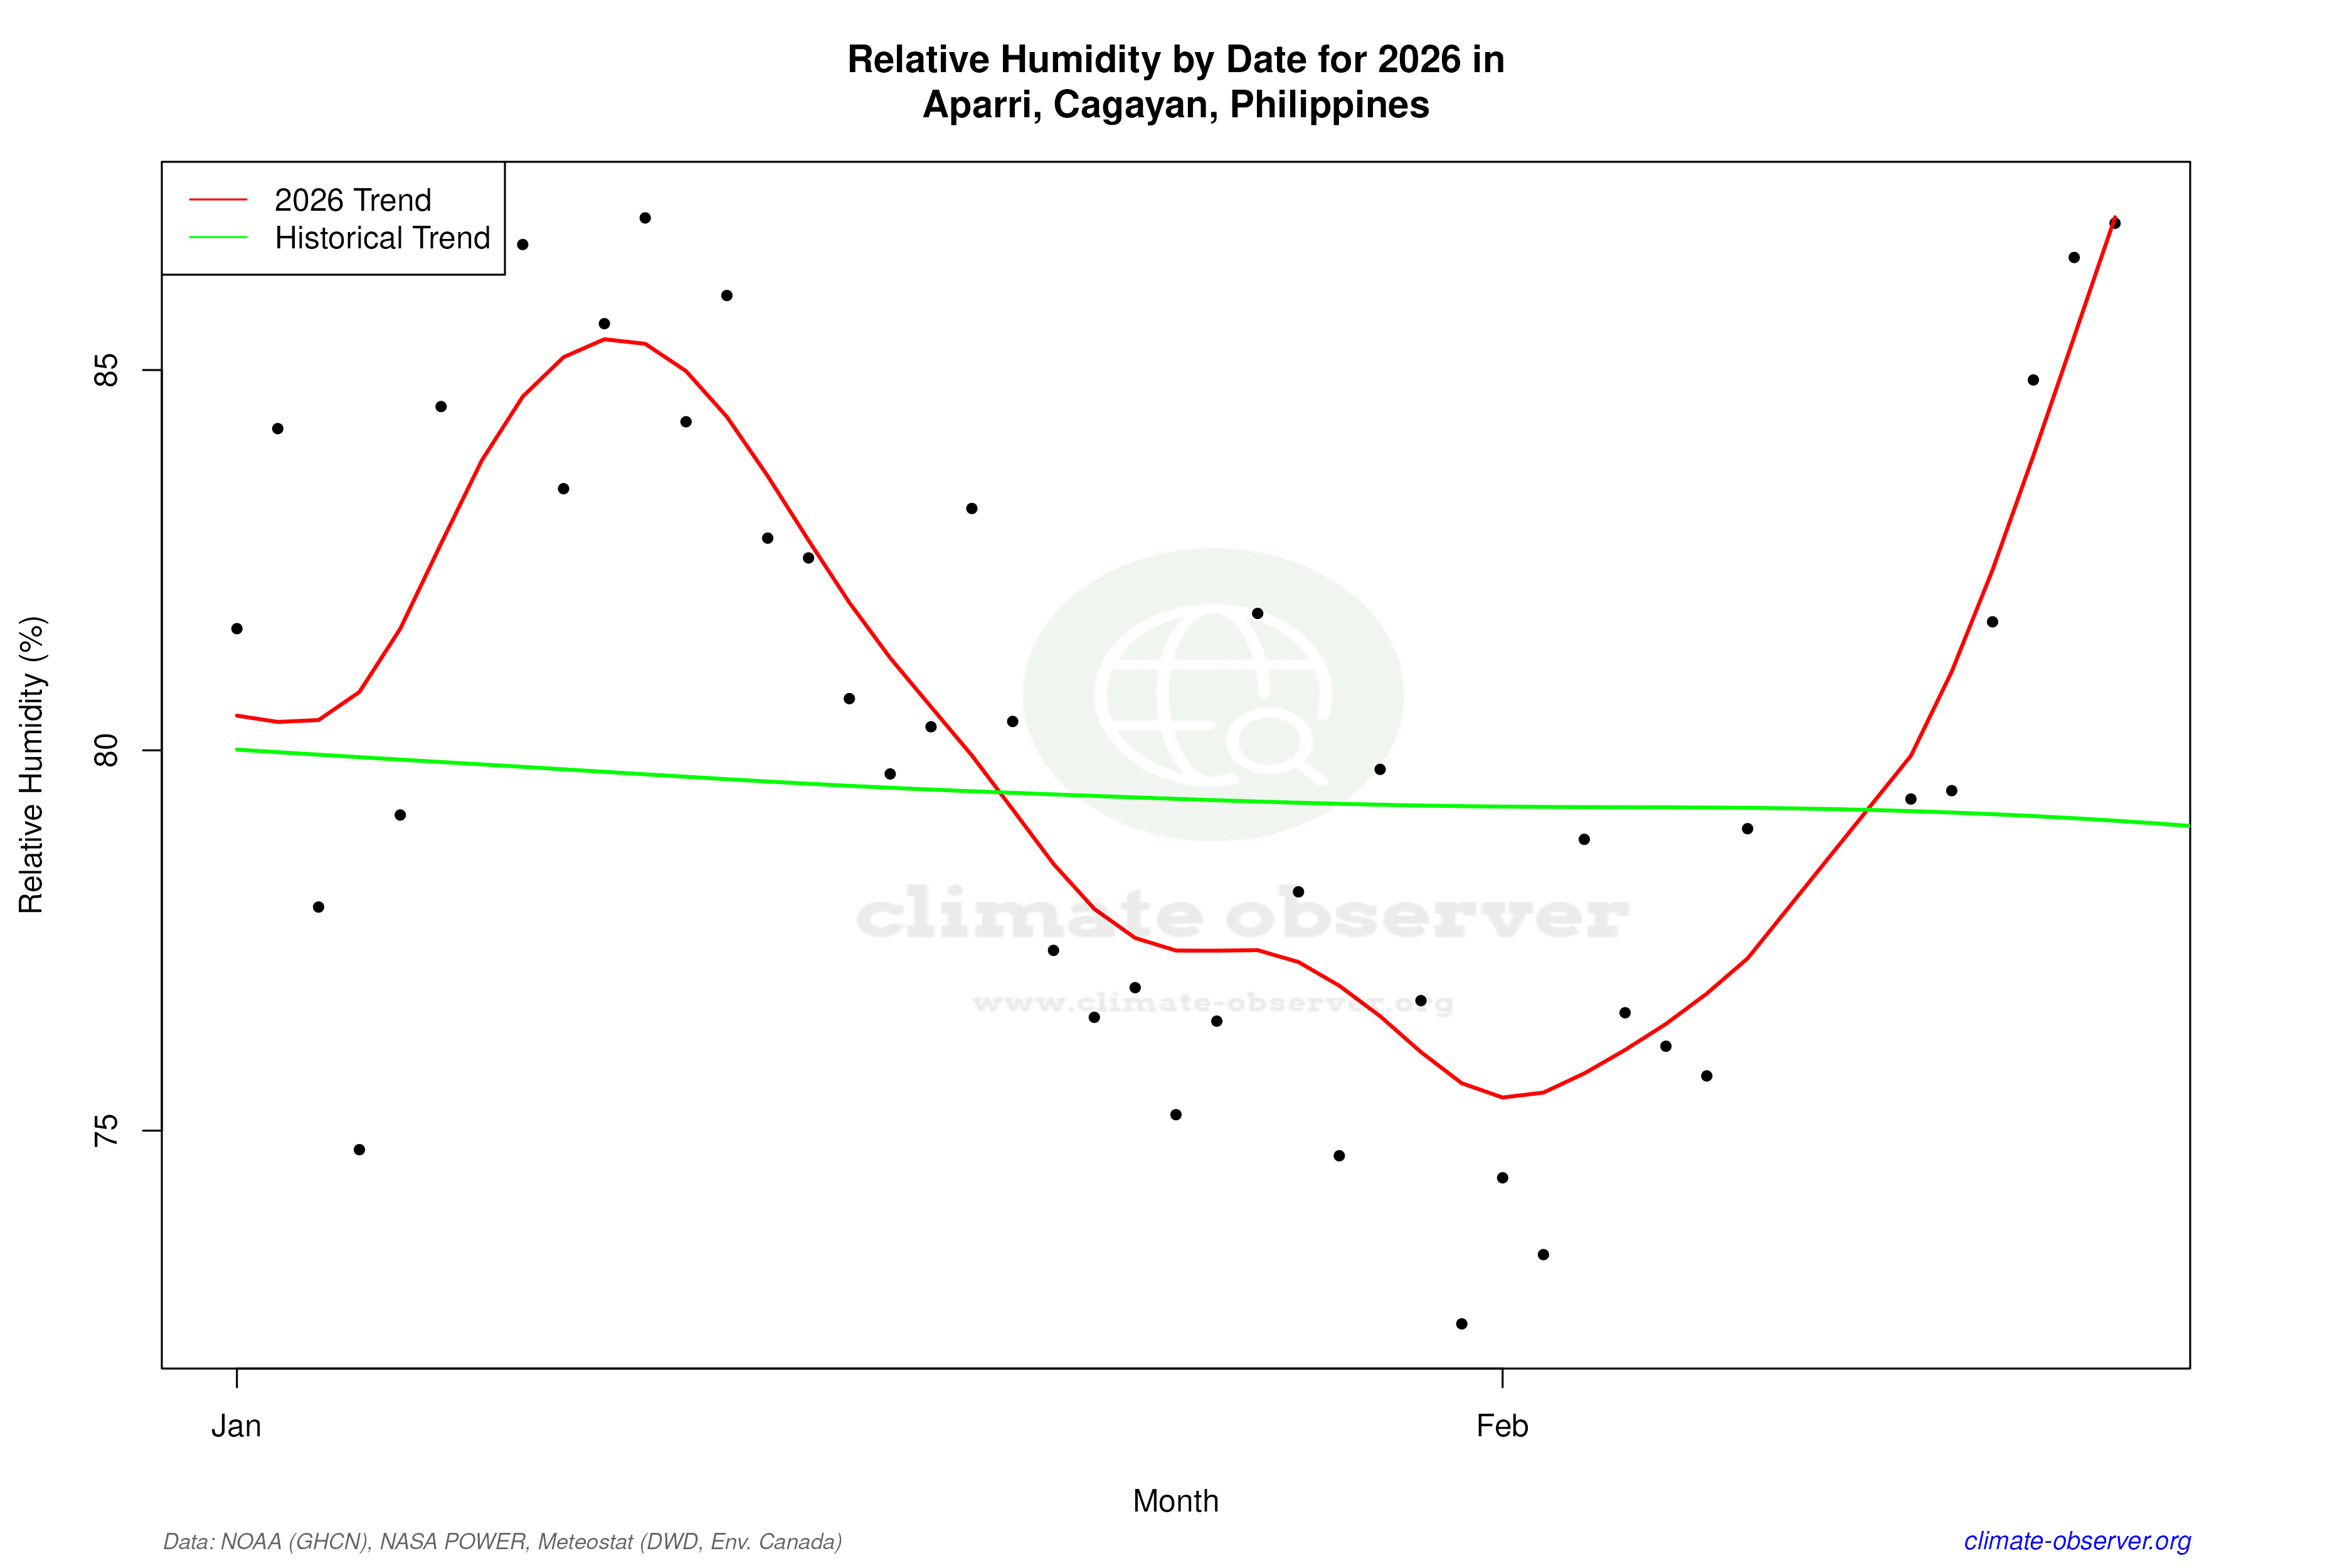

Max Temperature this Year | 1 of 6
Climate 12-Month Moving Averages


Max Temperature 12-Month MA | 1 of 6
Daily Data Points and Averages Throughout the Year


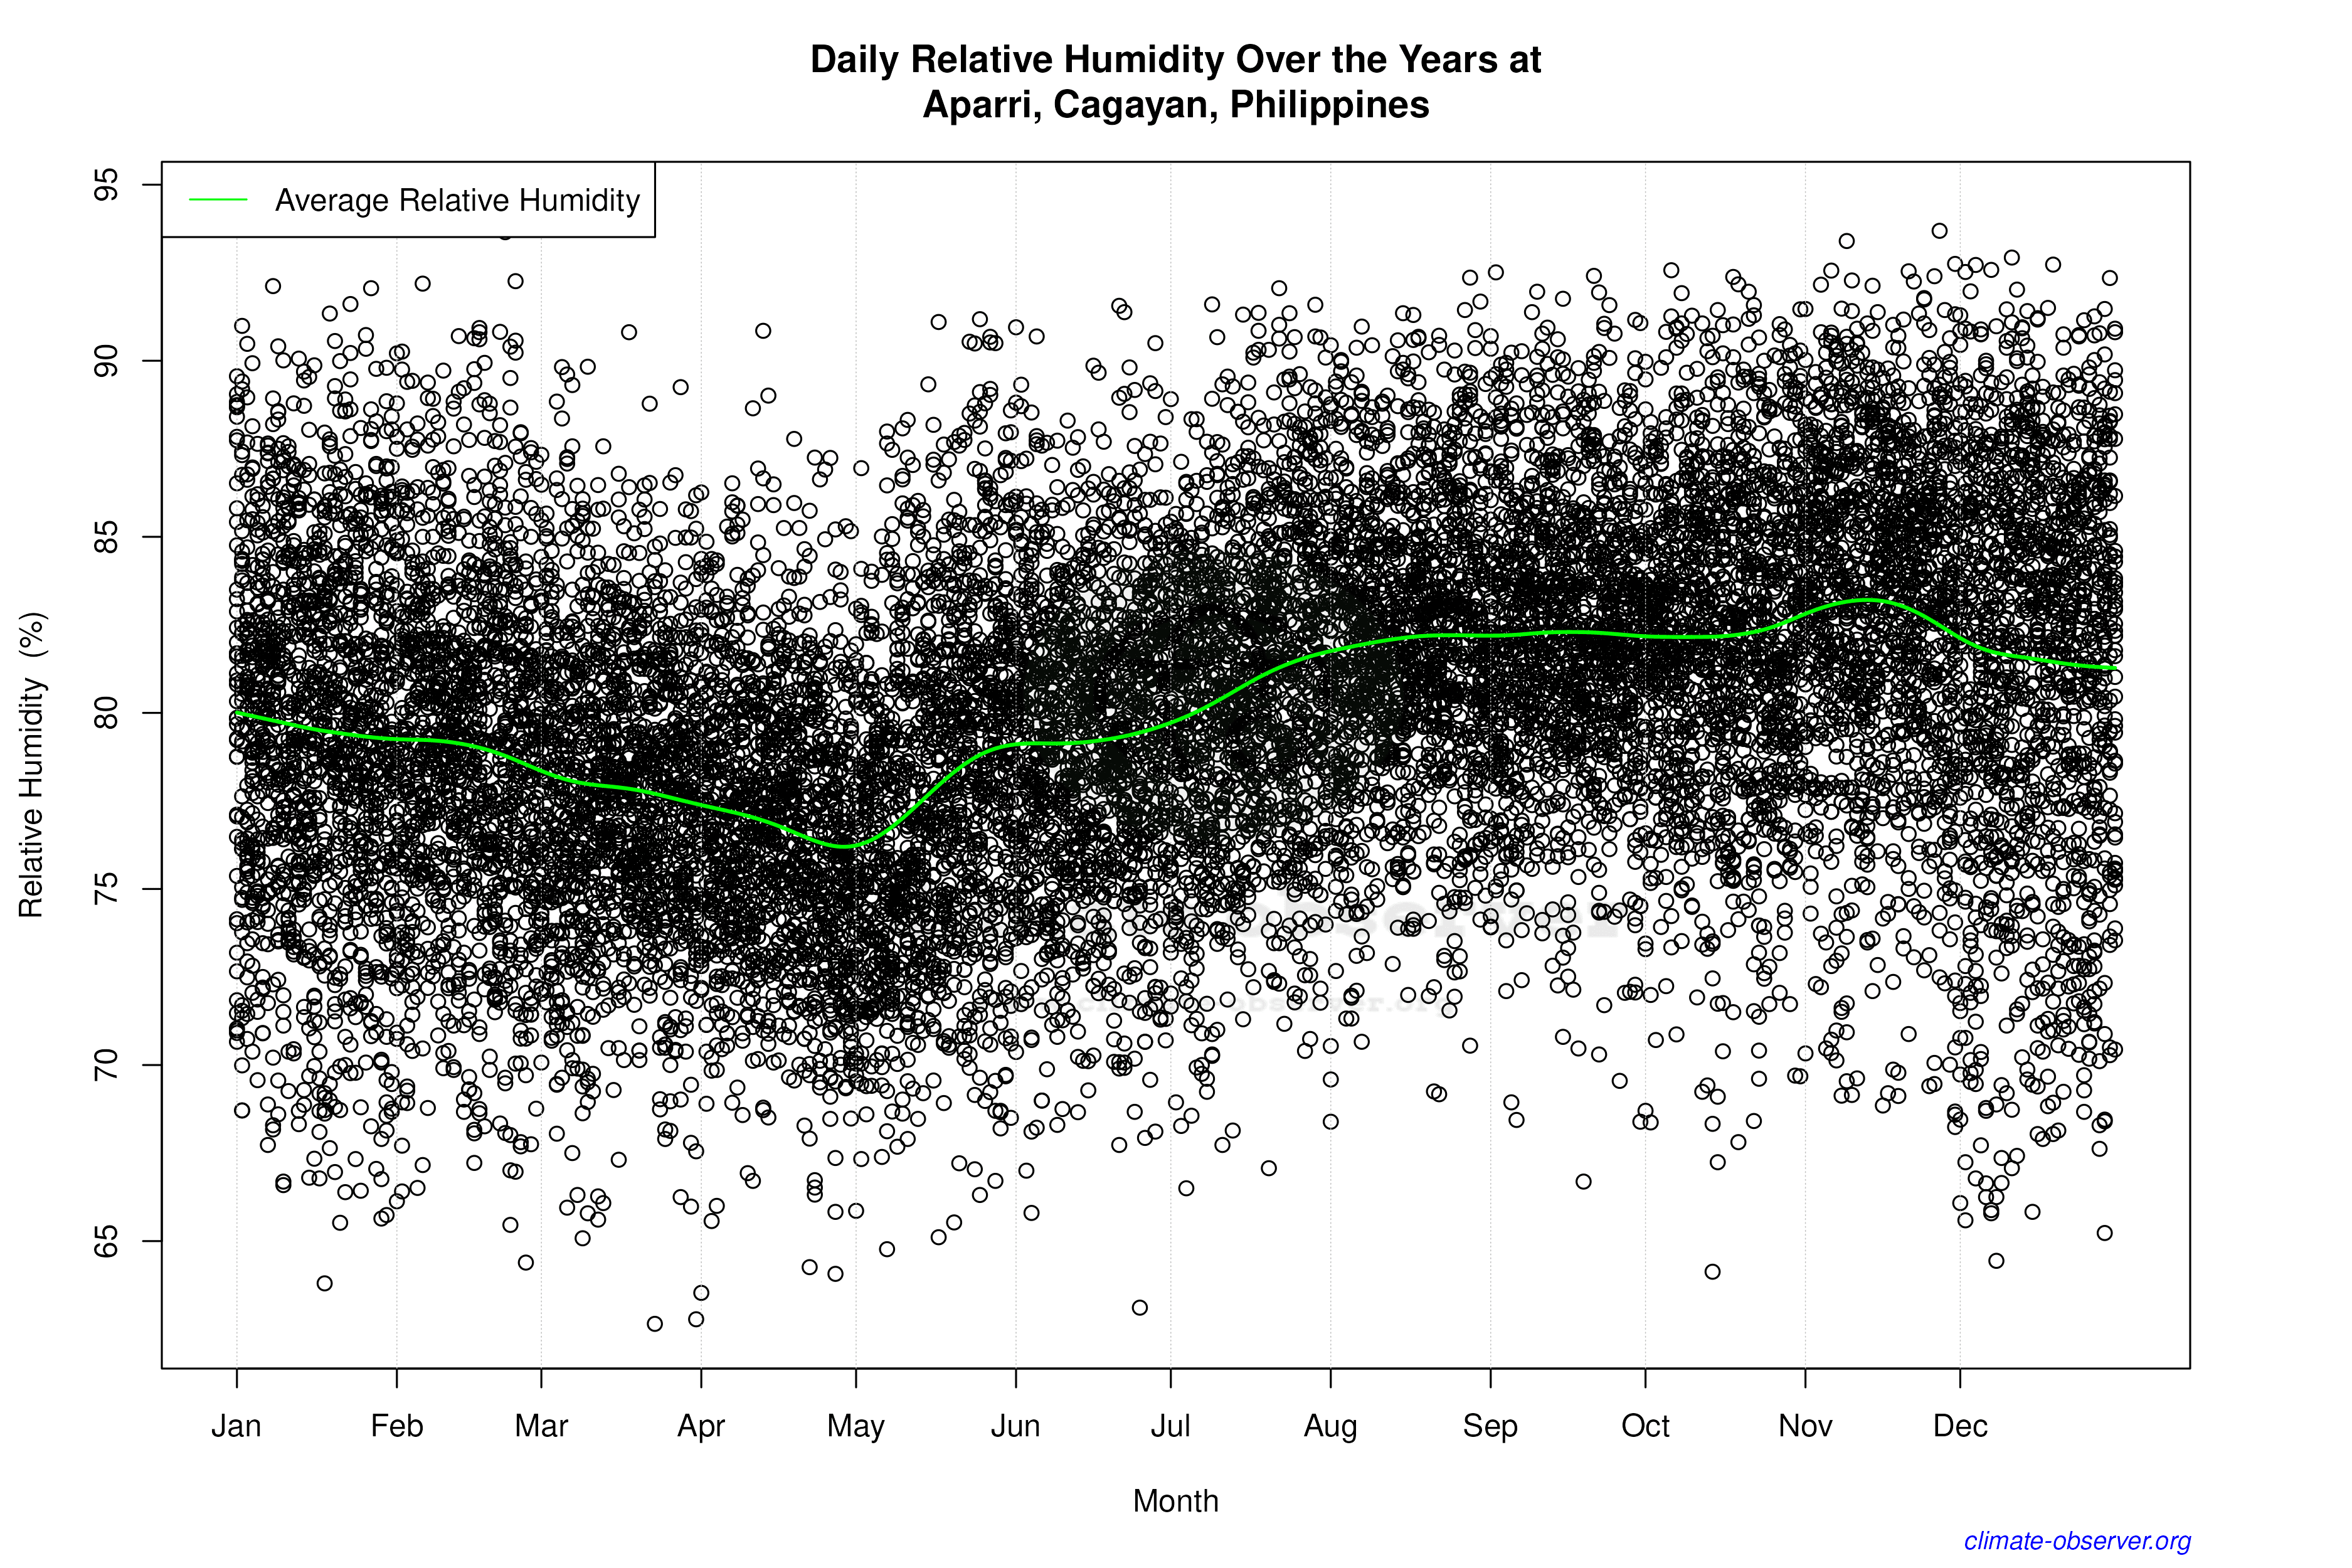

Average Max Temperature Throughout Year | 1 of 5
