Climate for Station: Science Garden, Philippines
Loading live weather...
Climate Analysis & Overview
The Science Garden in Quezon City, Metro Manila, is experiencing a complex climate narrative marked by a warming trend in lows and a cooling trend in highs over the past decade. The precipitation distribution has become more even, while all-time temperature trends indicate a subtle overall warming.
Tropical Climate Dynamics
The Science Garden, located in Quezon City, falls under the tropical monsoon climate category according to the Köppen classification. This climate is characterised by significant seasonal rainfall variations, influenced by the southwest monsoon and the northeast trade winds. The geography of Metro Manila, bordered by the Sierra Madre mountains to the east and the Manila Bay to the west, plays a crucial role in modulating local weather patterns. The data reveals a 10-year cooling trend in high temperatures of -0.67°C (-1.21°F), juxtaposed with a warming trend in low temperatures of 0.23°C (0.41°F). This duality suggests a narrowing of the diurnal temperature range, potentially impacting local ecosystems and urban energy demands.
Subtle Long-term Warming
Over the all-time record, the Science Garden has experienced a modest warming in both high and low temperatures. Highs have risen by 0.12°C (0.22°F), while lows have increased by 0.17°C (0.31°F). These incremental changes, although not drastic, align with broader regional climate patterns observed across the Philippines, where warming trends are contributing to shifts in agricultural zones and biodiversity. The highest recorded temperature at this station is 39.6°C (103.3°F), and the lowest is 12.2°C (54.0°F), underscoring the range of thermal conditions experienced here.
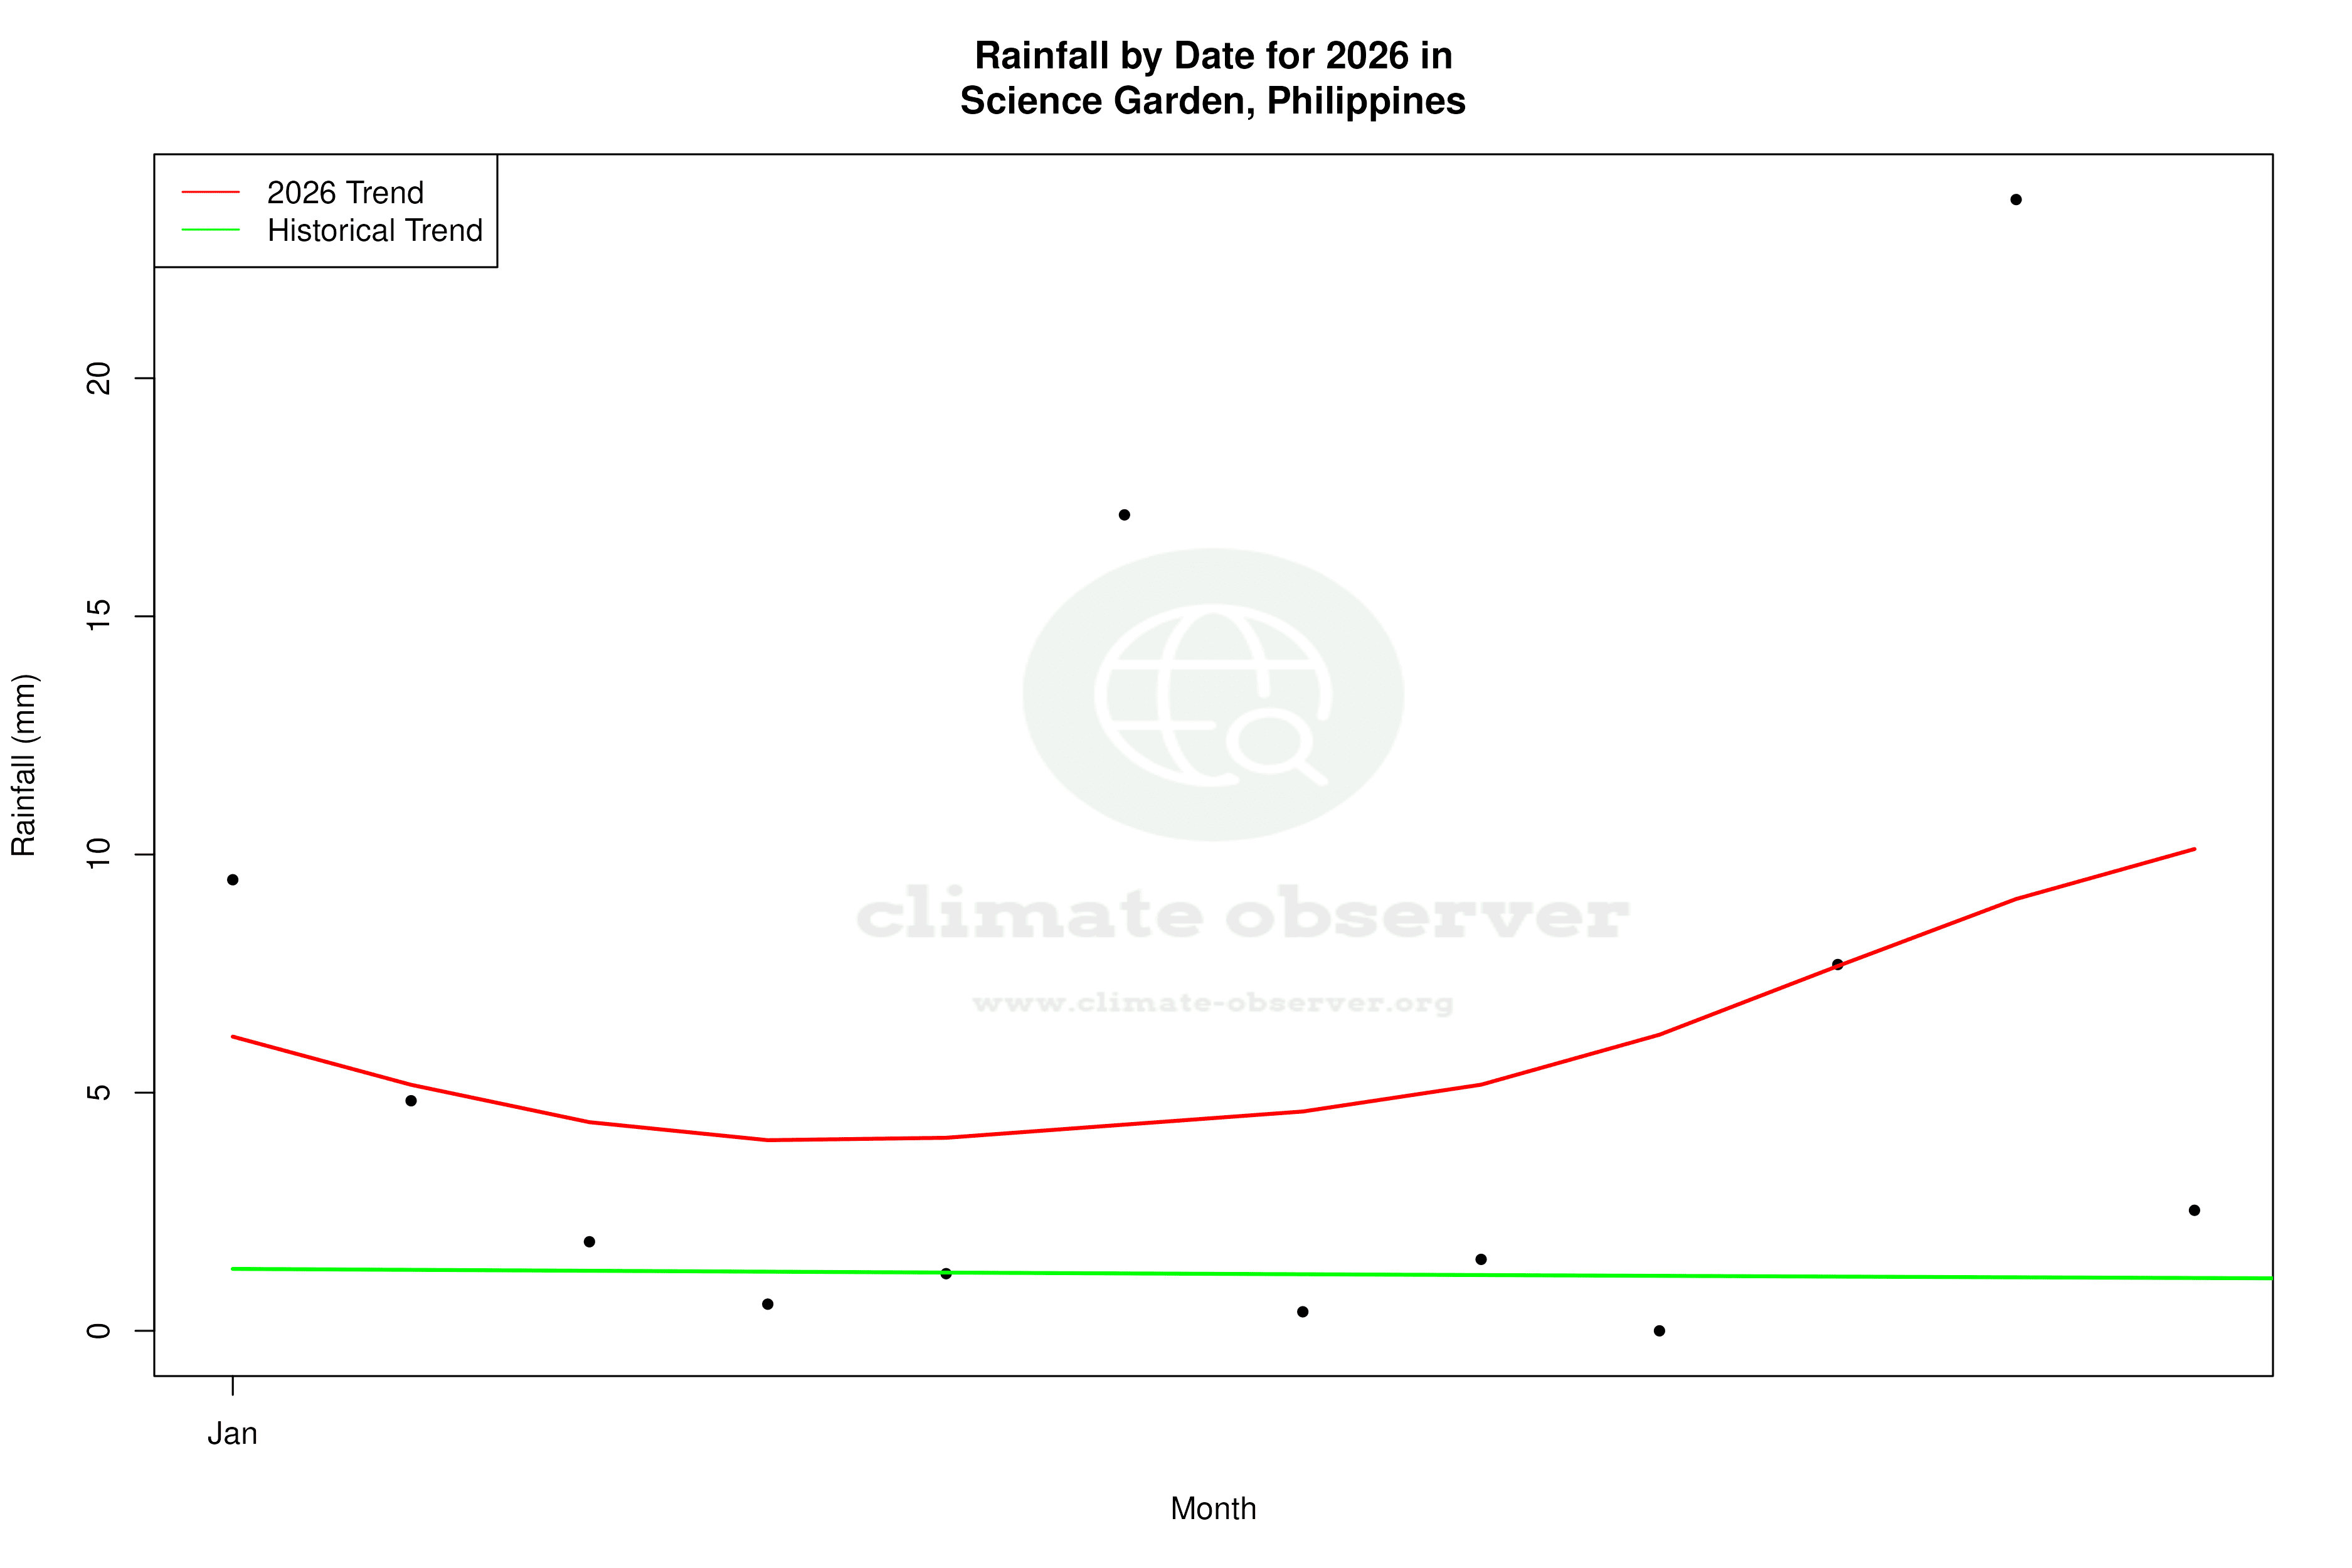
Precipitation Patterns and Distribution
The Precipitation Concentration Index (PCI) at the Science Garden has shown a decrease from a baseline of 12.68 to a current value of 10.93. This indicates that rainfall is becoming more evenly distributed throughout the year, which can mitigate the risks of flooding and drought. Such a shift is beneficial in a region prone to extreme weather events, as it can lead to more sustainable water management practices. A PCI below 10 is considered very even, so this shift towards more balanced precipitation is noteworthy, albeit still slightly above the very even threshold.
Implications for Regional Climate Goals
The Philippines has been actively pursuing climate resilience and sustainability goals, particularly in the face of increasing climate variability. The trends observed at the Science Garden reflect the broader challenges and opportunities faced by the nation. The warming of low temperatures and the more even distribution of precipitation could support agricultural productivity and water resource management, aligning with national objectives to enhance food security and climate adaptation strategies. These insights contribute to a nuanced understanding of how local climate dynamics are evolving within the context of global climate change.
Station Statistics
10-Year Trend
High: -1.36 °F/decade
Low: +0.39 °F/decade
Rain: -0.036 in/decade
25-Year Trend
High: -0.13 °F/decade
Low: +0.79 °F/decade
Rain: +0.017 in/decade
50-Year Trend
High: -0.14 °F/decade
Low: +1.03 °F/decade
Rain: +0.023 in/decade
All-Time Trend
High: +0.20 °F/decade
Low: +0.29 °F/decade
Rain: +0.018 in/decade
Percentage Above-Average Days
Last 12 Months: 28.2%
This Year: 20.8%
Precipitation Concentration Index (PCI) ℹ️
Last 12 Months: 22.5
Historical Average: 15.9
Percentile Rank of Last 12 Months ℹ️
High: 20th percentile
Low: 93rd percentile
Rain: 80th percentile
Change in Variance ℹ️
High: -15.6%
Low: -39.1%
Intraday: -30.4%
Data Coverage
94.8%
First Year of Data
1945
Station Location
Historical Weather Records
| Max High | Avg High | Min High | Max Avg | Avg Avg | Min Avg | Max Low | Avg Low | Min Low | Max Precipitation | Avg Precipitation | Max Snow | Avg Snow | |
|---|---|---|---|---|---|---|---|---|---|---|---|---|---|
| Record | 103.28 °F | — | 71.96 °F | 94.46 °F | — | 67.28 °F | 85.82 °F | — | 53.96 °F | 13.19 in | — | — | — |
| January | 99.32 °F | 86.45 °F | 73.04 °F | 85.64 °F | 78.10 °F | 67.28 °F | 78.80 °F | 70.29 °F | 59.90 °F | 2.32 in | 0.04 in | — | — |
| February | 97.34 °F | 88.31 °F | 77.00 °F | 88.34 °F | 79.33 °F | 70.88 °F | 80.42 °F | 70.49 °F | 53.96 °F | 6.45 in | 0.04 in | — | — |
| March | 100.22 °F | 91.04 °F | 77.00 °F | 89.96 °F | 81.78 °F | 71.96 °F | 81.68 °F | 72.31 °F | 58.82 °F | 3.37 in | 0.04 in | — | — |
| April | 102.38 °F | 93.87 °F | 80.06 °F | 92.48 °F | 84.53 °F | 75.74 °F | 84.20 °F | 74.96 °F | 62.96 °F | 5.97 in | 0.06 in | — | — |
| May | 102.38 °F | 93.74 °F | 77.72 °F | 94.46 °F | 85.08 °F | 75.38 °F | 85.10 °F | 76.74 °F | 64.04 °F | 6.54 in | 0.19 in | — | — |
| June | 103.28 °F | 90.77 °F | 75.20 °F | 91.94 °F | 83.20 °F | 74.12 °F | 83.66 °F | 76.44 °F | 68.36 °F | 13.19 in | 0.38 in | — | — |
| July | 97.16 °F | 88.61 °F | 76.28 °F | 88.88 °F | 81.68 °F | 74.48 °F | 85.82 °F | 75.65 °F | 65.48 °F | 11.25 in | 0.56 in | — | — |
| August | 96.98 °F | 87.69 °F | 75.74 °F | 88.70 °F | 81.26 °F | 72.86 °F | 82.76 °F | 75.61 °F | 64.40 °F | 12.73 in | 0.60 in | — | — |
| September | 99.32 °F | 87.99 °F | 76.46 °F | 90.68 °F | 81.13 °F | 74.84 °F | 82.22 °F | 75.31 °F | 68.00 °F | 10.91 in | 0.51 in | — | — |
| October | 97.34 °F | 88.20 °F | 75.38 °F | 87.98 °F | 80.96 °F | 73.76 °F | 84.02 °F | 74.60 °F | 65.48 °F | 8.66 in | 0.33 in | — | — |
| November | 96.08 °F | 87.91 °F | 71.96 °F | 87.44 °F | 80.20 °F | 72.14 °F | 80.96 °F | 73.34 °F | 60.08 °F | 6.69 in | 0.18 in | — | — |
| December | 102.74 °F | 86.52 °F | 73.04 °F | 85.82 °F | 78.71 °F | 71.24 °F | 80.60 °F | 71.77 °F | 59.18 °F | 5.18 in | 0.12 in | — | — |
Data Visualisations
Remove WatermarksCurrent Year Climate Trends vs Historical


Max Temperature this Year | 1 of 6
Climate 12-Month Moving Averages


Max Temperature 12-Month MA | 1 of 6
Daily Data Points and Averages Throughout the Year


Average Max Temperature Throughout Year | 1 of 5
