Climate for Station: Kanin Nos, Nenets Autonomous Okrug, Russia
Loading live weather...
Climate Analysis & Overview
Kanin Nos, situated in the remote reaches of the Russian Arctic, is experiencing a warming trend, particularly in its low temperatures. The area's precipitation patterns have become more evenly distributed, reflecting a subtle shift in climate dynamics.
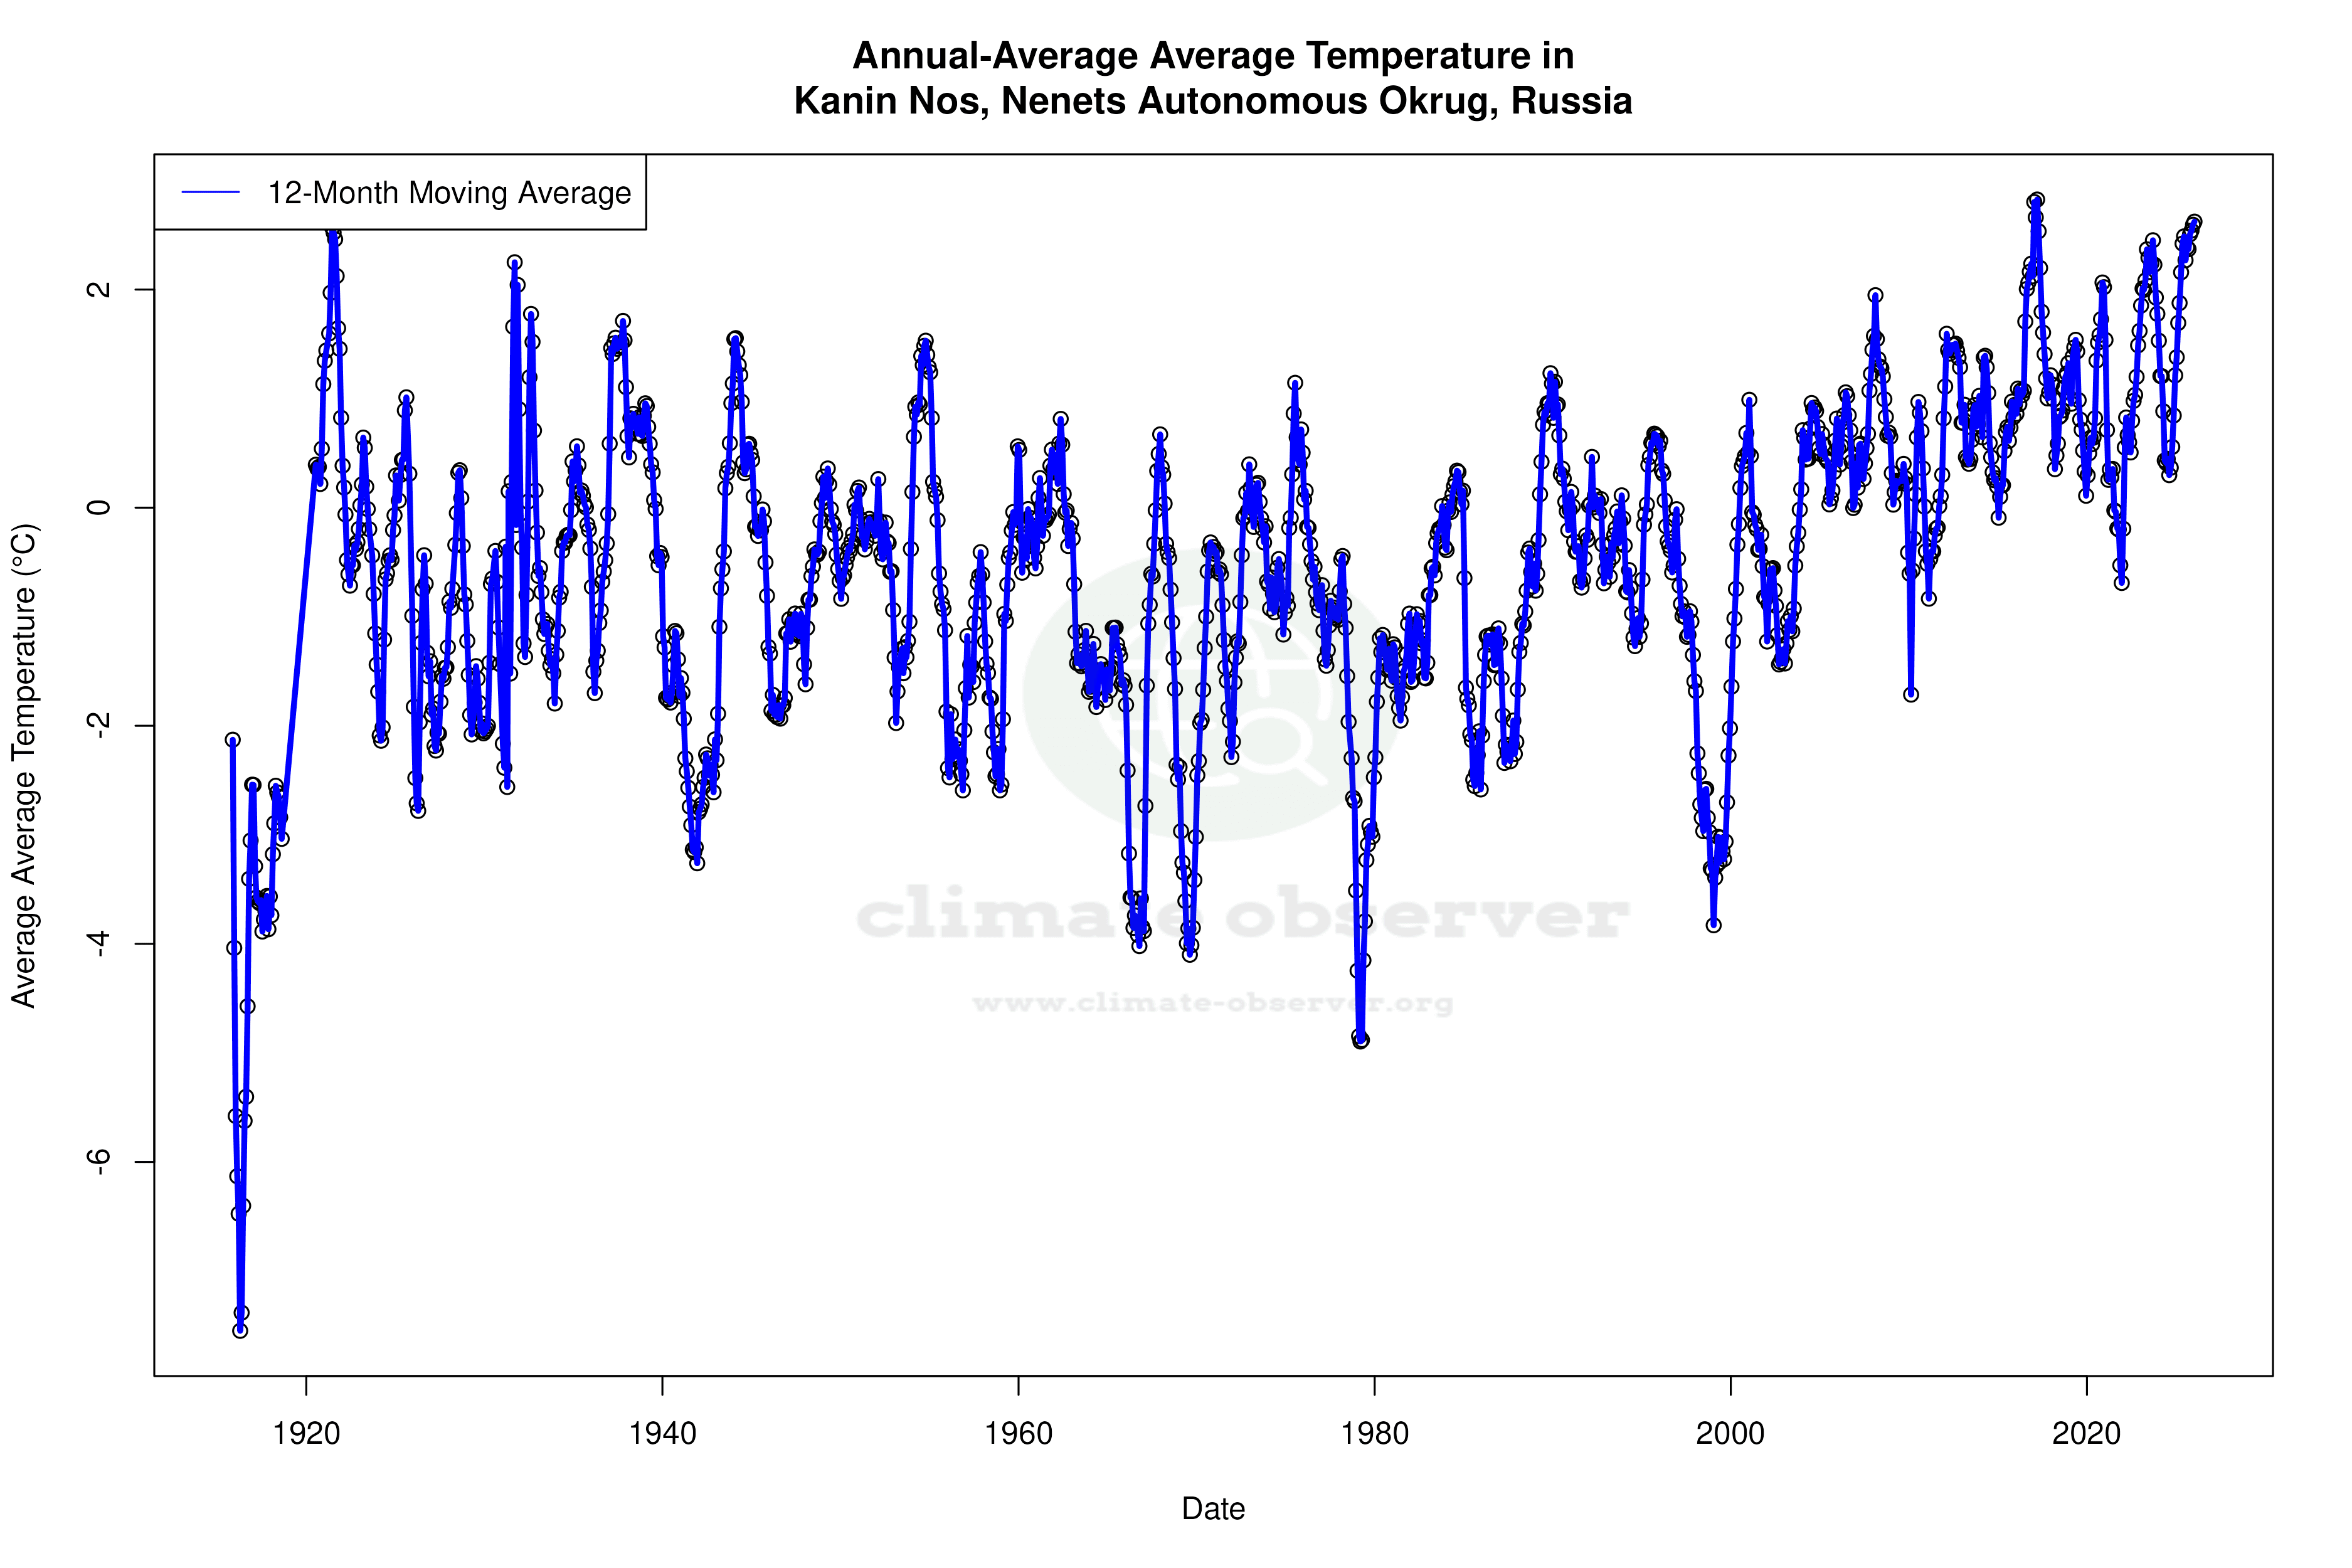
Arctic Warming Trends
Kanin Nos, located at 68.65°N, 43.3°E in the Nenets Autonomous Okrug of Russia, falls under the Tundra climate classification according to the Köppen system. This region is characterised by long, harsh winters and short, cool summers. Over the past decade, a notable warming trend has been observed, with low temperatures rising by 0.89°C (1.60°F). This is more pronounced than the all-time trend, where lows have increased by 0.26°C (0.47°F). High temperatures have also shown a warming trend, albeit less dramatic, with a 10-year increase of 0.32°C (0.58°F) and an all-time rise of 0.12°C (0.22°F). These shifts suggest a gradual warming of the region, aligning with broader Arctic warming patterns.
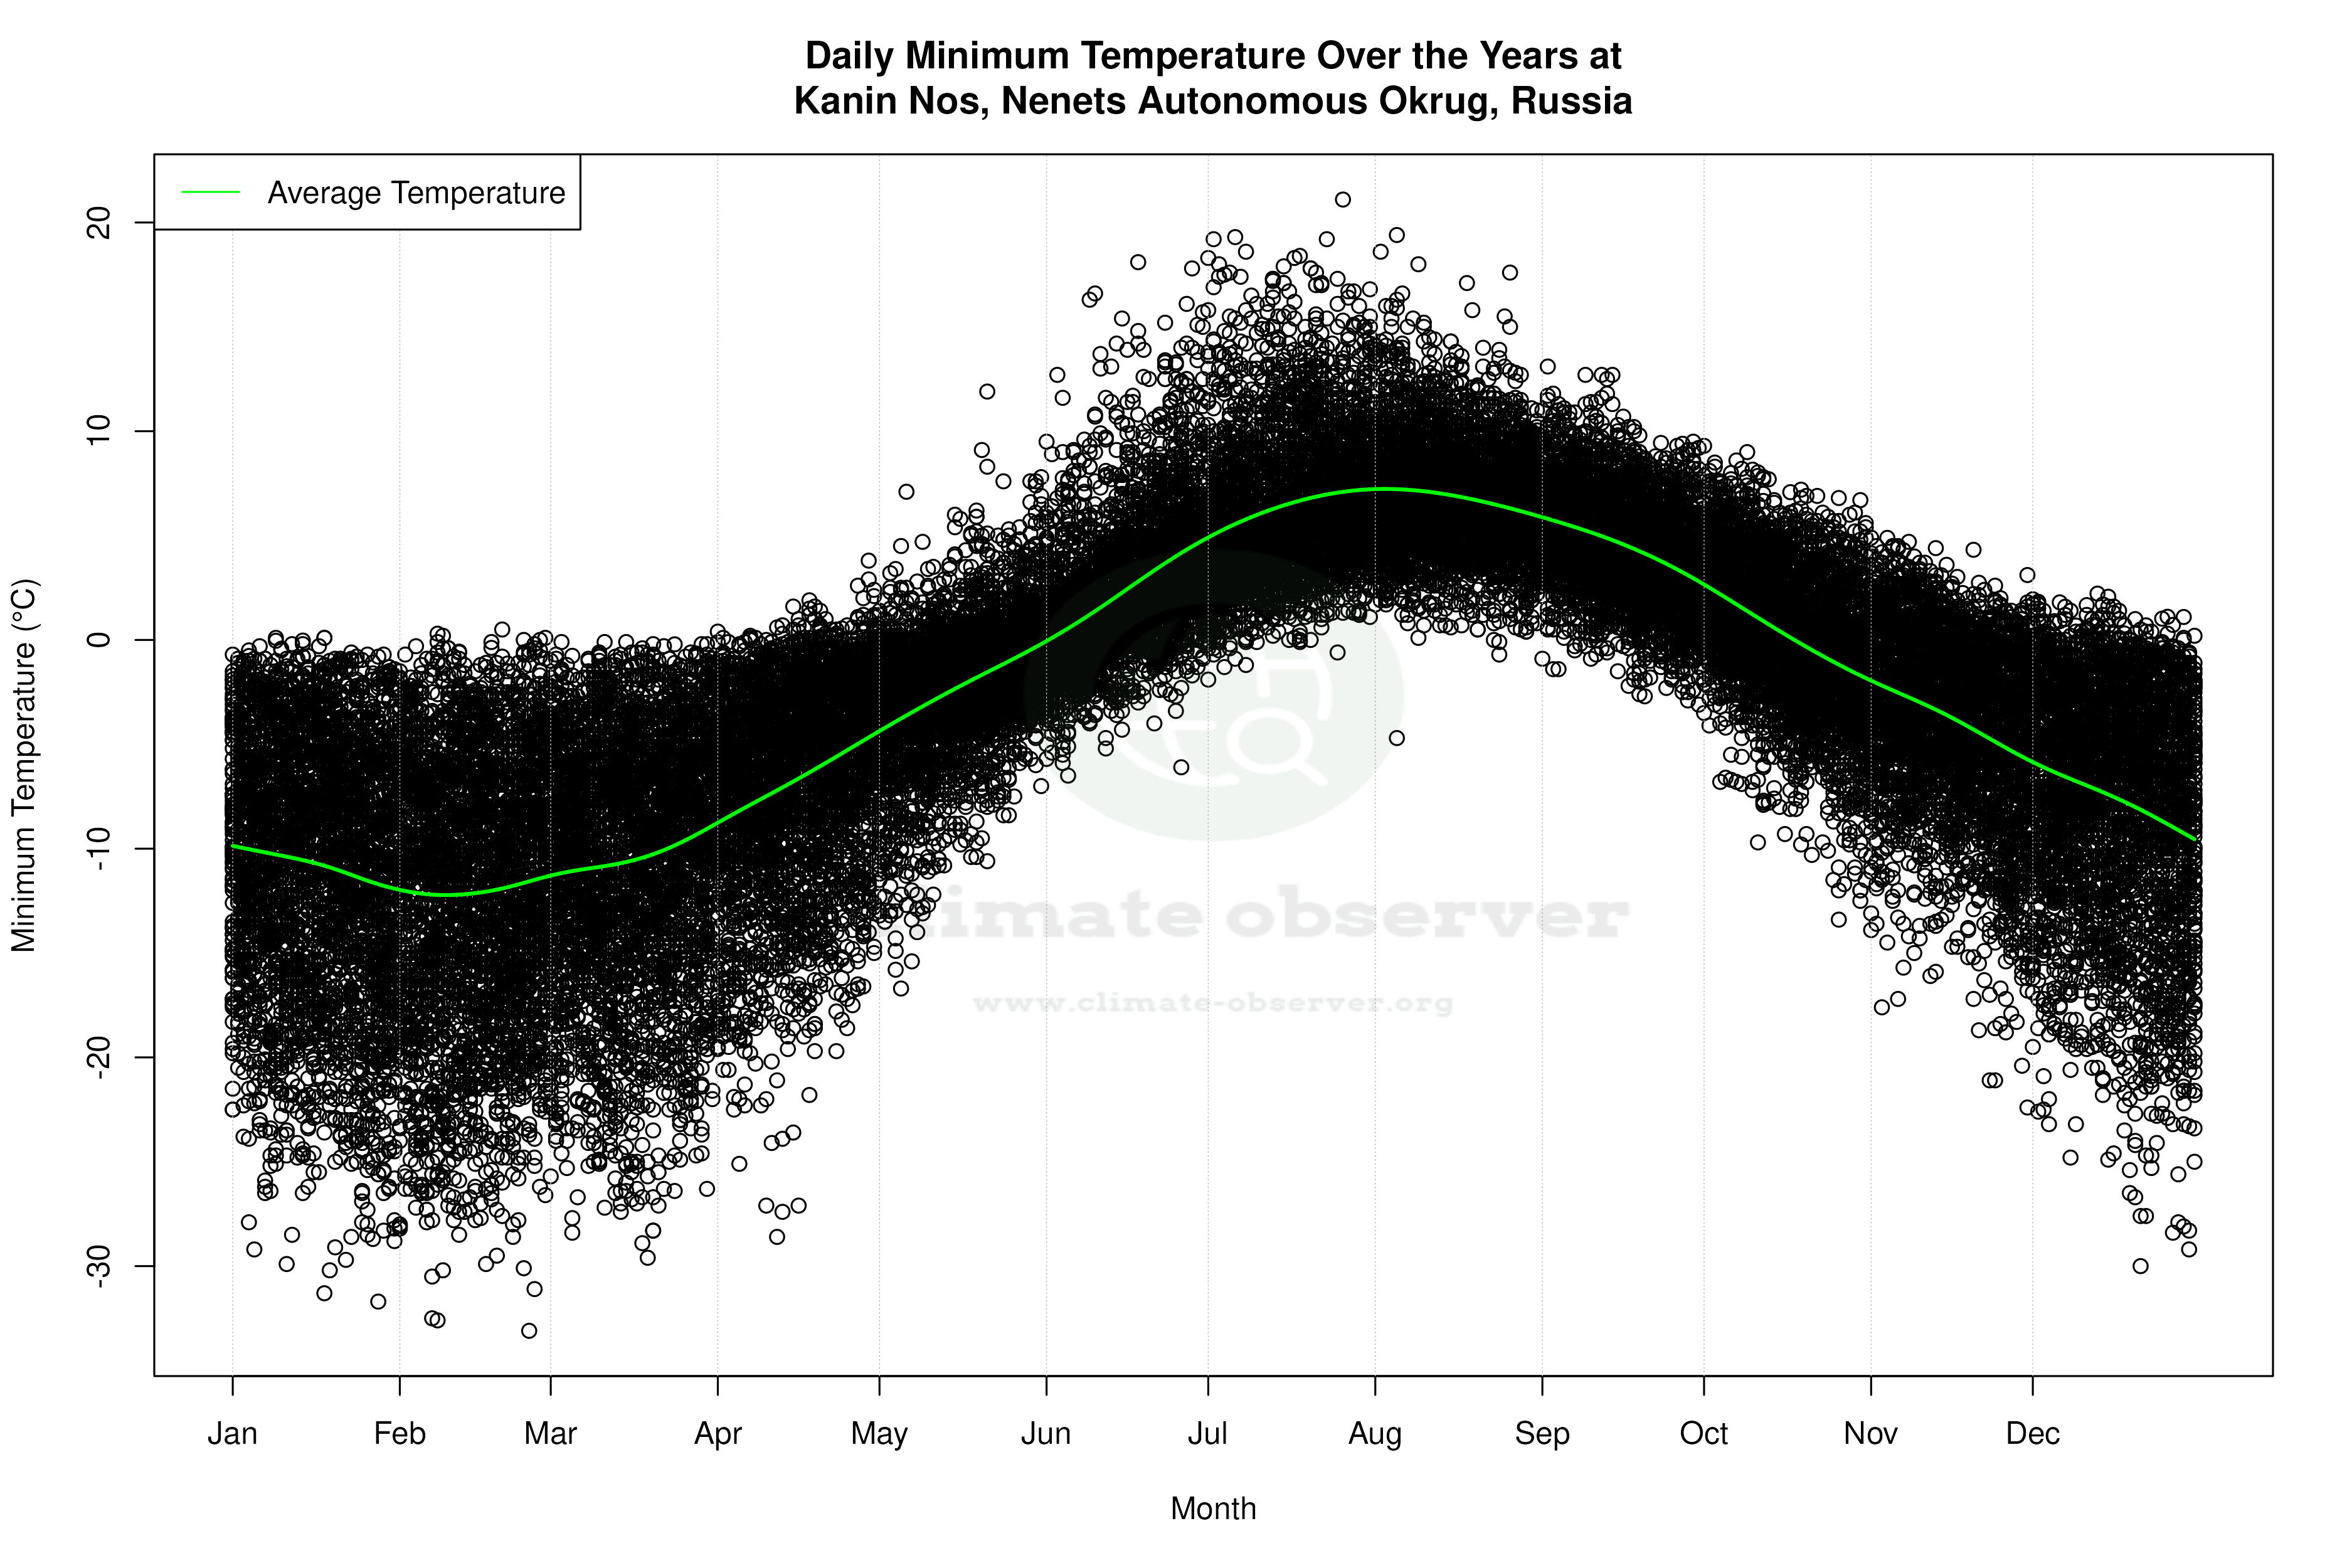
Temperature Extremes and Records
The climate in Kanin Nos is marked by extreme temperatures, with historical records showing a maximum of 30.5°C (86.9°F) and a minimum of -33.1°C (-27.6°F). These extremes highlight the region's capacity for both intense cold and surprising warmth during summer months. Such variability is typical for Arctic regions, where temperature fluctuations can be stark due to the absence of moderating geographical features like large bodies of water or mountain ranges.
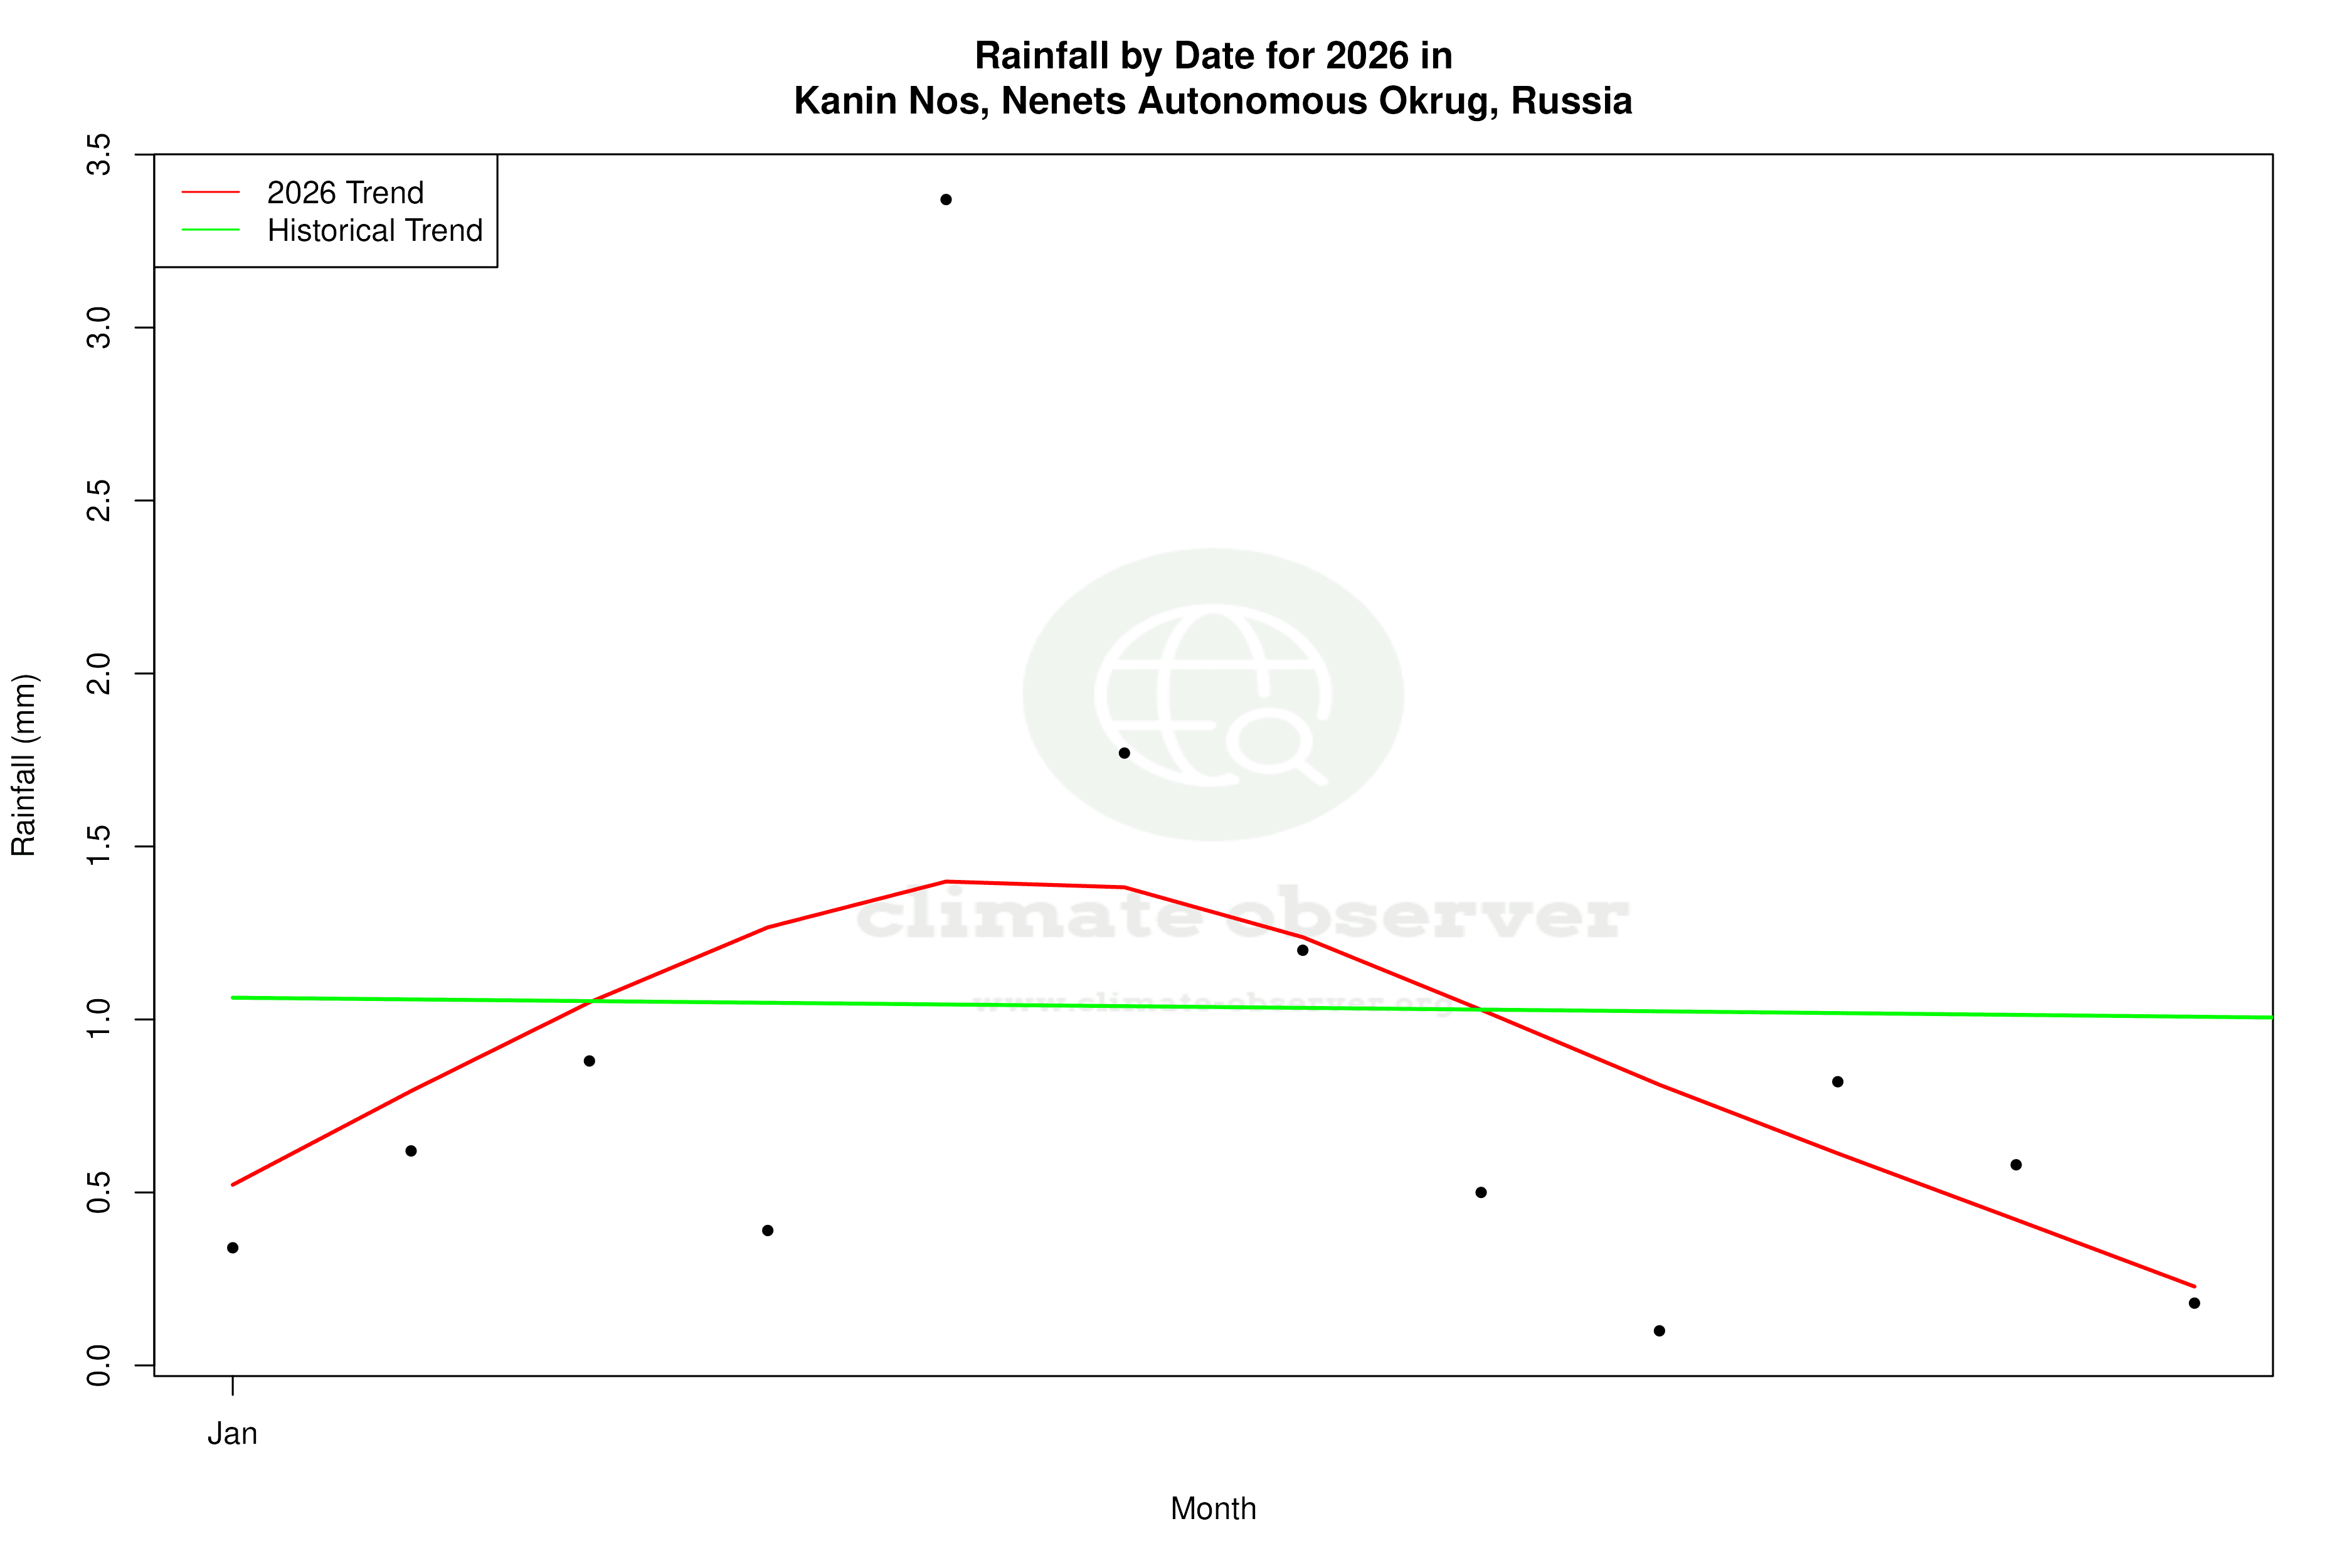
Precipitation Patterns and Distribution
The Precipitation Concentration Index (PCI) for Kanin Nos has decreased from a baseline of 10.67 to a current value of 8.89. This indicates that precipitation is now more evenly distributed throughout the year. A PCI below 10 suggests a very even distribution, reducing the likelihood of intense precipitation events concentrated in short periods. This shift could be beneficial for local ecosystems, potentially reducing the risk of flooding and soil erosion.
Regional Climate Goals and Implications
Russia's climate policy aims to address the impacts of climate change, particularly in vulnerable Arctic regions like Kanin Nos. The observed warming trends and changes in precipitation distribution could have significant implications for local wildlife and human activities. As the Arctic continues to warm, understanding these trends is crucial for developing adaptive strategies that align with Russia's broader climate goals. The warming of low temperatures, in particular, could influence permafrost stability, impacting infrastructure and natural habitats in the region.
Station Statistics
10-Year Trend
High: +1.62 °F/decade
Low: +2.68 °F/decade
Rain: +0.011 in/decade
25-Year Trend
High: +1.31 °F/decade
Low: +1.93 °F/decade
Rain: +0.000 in/decade
50-Year Trend
High: +0.75 °F/decade
Low: +1.32 °F/decade
Rain: +0.001 in/decade
All-Time Trend
High: +0.22 °F/decade
Low: +0.41 °F/decade
Rain: +0.002 in/decade
Percentage Above-Average Days
Last 12 Months: 55.0%
This Year: 33.6%
Precipitation Concentration Index (PCI) ℹ️
Last 12 Months: 10.6
Historical Average: 10.7
Percentile Rank of Last 12 Months ℹ️
High: 96th percentile
Low: 98th percentile
Rain: 94th percentile
Change in Variance ℹ️
High: -10.9%
Low: -17.5%
Intraday: -4.5%
Data Coverage
97.5%
First Year of Data
1915
Station Location
Historical Weather Records
| Max High | Avg High | Min High | Max Avg | Avg Avg | Min Avg | Max Low | Avg Low | Min Low | Max Precipitation | Avg Precipitation | Max Snow | Avg Snow | |
|---|---|---|---|---|---|---|---|---|---|---|---|---|---|
| Record | 86.90 °F | — | -21.28 °F | 78.80 °F | — | -24.16 °F | 69.98 °F | — | -27.58 °F | 3.34 in | — | — | — |
| January | 39.20 °F | 22.21 °F | -15.16 °F | 35.60 °F | 17.47 °F | -20.20 °F | 32.18 °F | 12.63 °F | -25.06 °F | 0.67 in | 0.04 in | — | — |
| February | 39.38 °F | 20.07 °F | -21.28 °F | 35.60 °F | 15.35 °F | -24.16 °F | 32.90 °F | 10.46 °F | -27.58 °F | 0.98 in | 0.03 in | — | — |
| March | 36.68 °F | 22.48 °F | -12.82 °F | 34.52 °F | 17.99 °F | -17.32 °F | 32.14 °F | 13.36 °F | -21.28 °F | 0.58 in | 0.03 in | — | — |
| April | 49.28 °F | 28.17 °F | -0.04 °F | 43.34 °F | 24.27 °F | -5.80 °F | 38.84 °F | 20.16 °F | -23.08 °F | 0.67 in | 0.02 in | — | — |
| May | 61.70 °F | 35.00 °F | 12.38 °F | 54.50 °F | 31.33 °F | 7.88 °F | 53.42 °F | 28.06 °F | 3.56 °F | 0.55 in | 0.03 in | — | — |
| June | 79.34 °F | 45.83 °F | 24.80 °F | 72.14 °F | 40.44 °F | 22.82 °F | 64.58 °F | 36.21 °F | 20.30 °F | 1.57 in | 0.04 in | — | — |
| July | 86.90 °F | 53.67 °F | 33.44 °F | 78.80 °F | 47.97 °F | 31.10 °F | 69.98 °F | 43.47 °F | 28.58 °F | 3.34 in | 0.04 in | — | — |
| August | 82.58 °F | 52.38 °F | 38.30 °F | 72.68 °F | 47.82 °F | 34.70 °F | 66.92 °F | 44.20 °F | 23.54 °F | 1.85 in | 0.05 in | — | — |
| September | 67.46 °F | 46.47 °F | 31.10 °F | 62.42 °F | 43.20 °F | 29.84 °F | 55.58 °F | 40.21 °F | 26.42 °F | 1.01 in | 0.06 in | — | — |
| October | 53.96 °F | 38.52 °F | 21.20 °F | 50.18 °F | 35.72 °F | 16.70 °F | 48.74 °F | 32.54 °F | 7.88 °F | 1.05 in | 0.06 in | — | — |
| November | 50.90 °F | 32.15 °F | 2.66 °F | 42.62 °F | 28.83 °F | -2.56 °F | 40.82 °F | 25.28 °F | -8.32 °F | 0.90 in | 0.05 in | — | — |
| December | 46.76 °F | 26.63 °F | -6.70 °F | 37.40 °F | 22.53 °F | -15.34 °F | 36.00 °F | 18.30 °F | -22.00 °F | 0.49 in | 0.04 in | — | — |
Data Visualisations
Remove WatermarksCurrent Year Climate Trends vs Historical


Max Temperature this Year | 1 of 6
Climate 12-Month Moving Averages


Max Temperature 12-Month MA | 1 of 6
Daily Data Points and Averages Throughout the Year


Average Max Temperature Throughout Year | 1 of 5
