Climate for Station: Marre-Sale, Yamalo-Nenets Autonomous Okrug, Russia
Loading live weather...
Climate Analysis & Overview
Marre-Sale, located in the Yamal-Nenets Autonomous Okrug of Russia, is experiencing a complex climate narrative. While long-term data indicates a slight warming trend, recent years have shown a cooling trend for high temperatures, suggesting nuanced climate dynamics. Precipitation patterns have become more evenly distributed, reflecting shifts in local weather behaviour.
Arctic Climate Dynamics
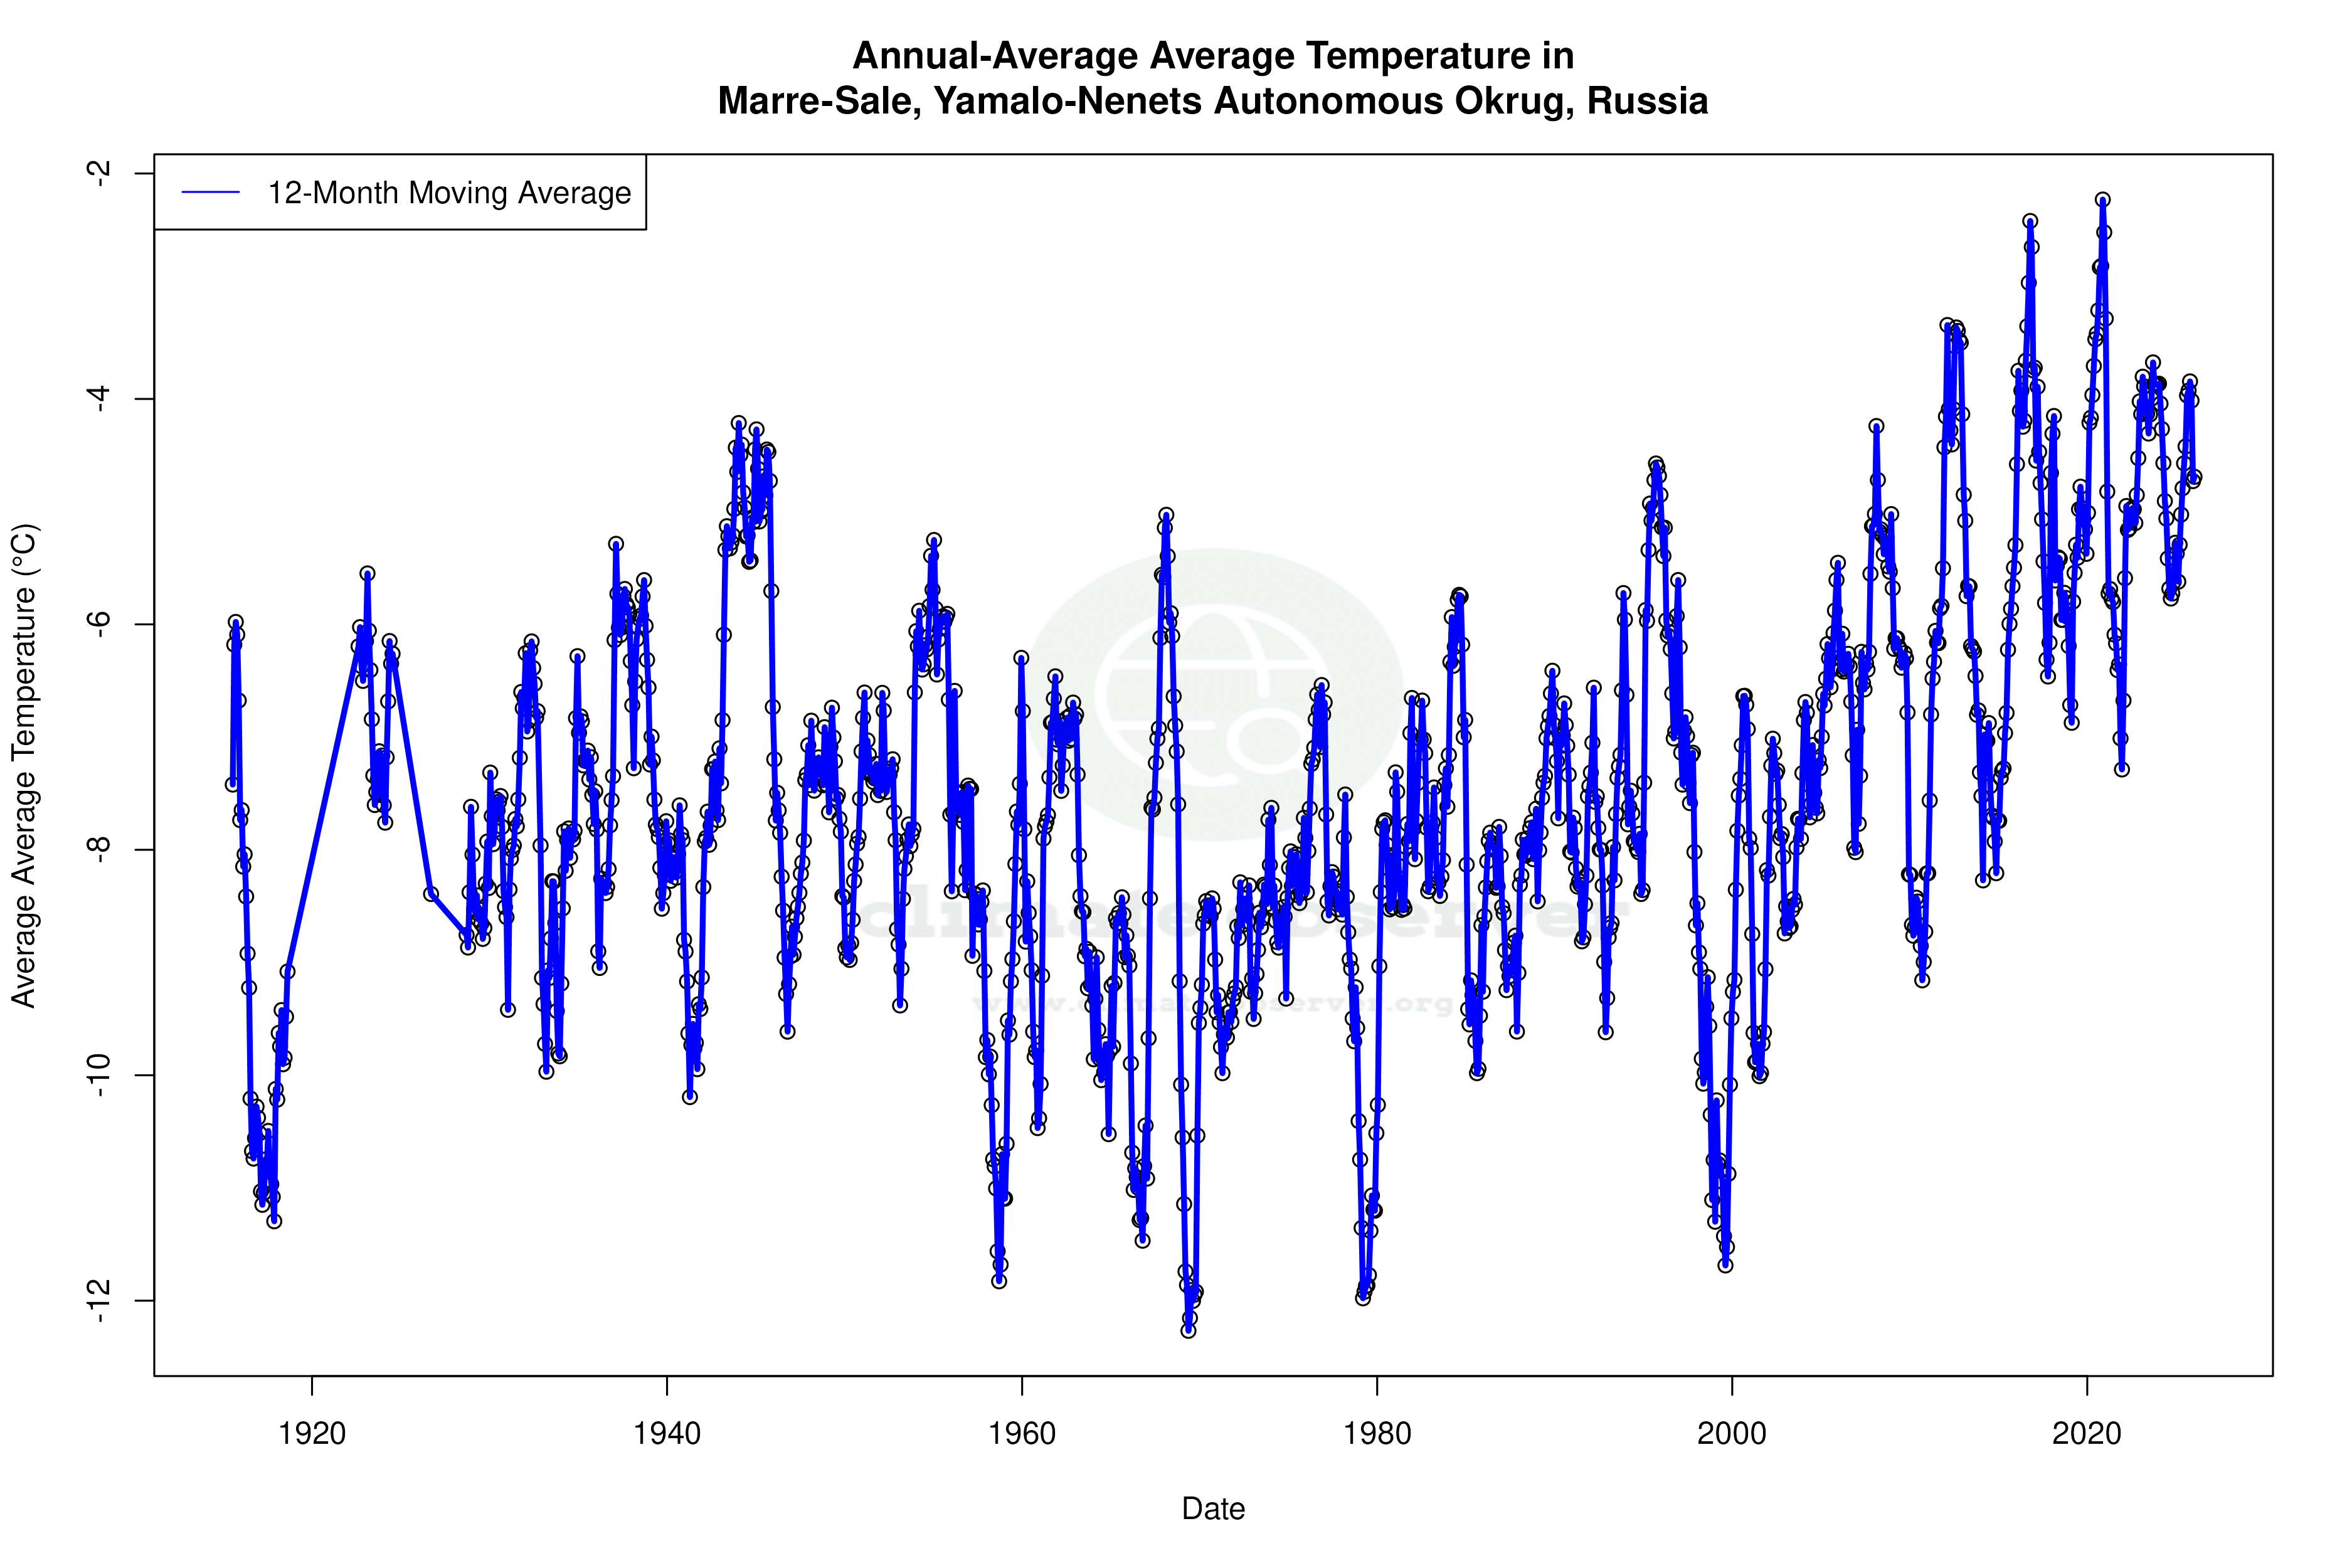
Marre-Sale is situated within the Arctic tundra climate zone, classified as ET in the Köppen climate classification. This region is characterised by long, extremely cold winters and short, cool summers. The local geography, with its flat tundra landscape and proximity to the Kara Sea, profoundly influences its climatic conditions. The all-time temperature trends reveal a modest warming, with highs increasing by 0.21°C (0.38°F) and lows by 0.28°C (0.50°F). However, the past decade has shown a contrasting cooling trend for high temperatures, decreasing by 0.93°C (1.67°F), while low temperatures have risen by 0.86°C (1.55°F). This divergence suggests complex interactions between local and broader climatic forces.
Temperature Extremes and Variability
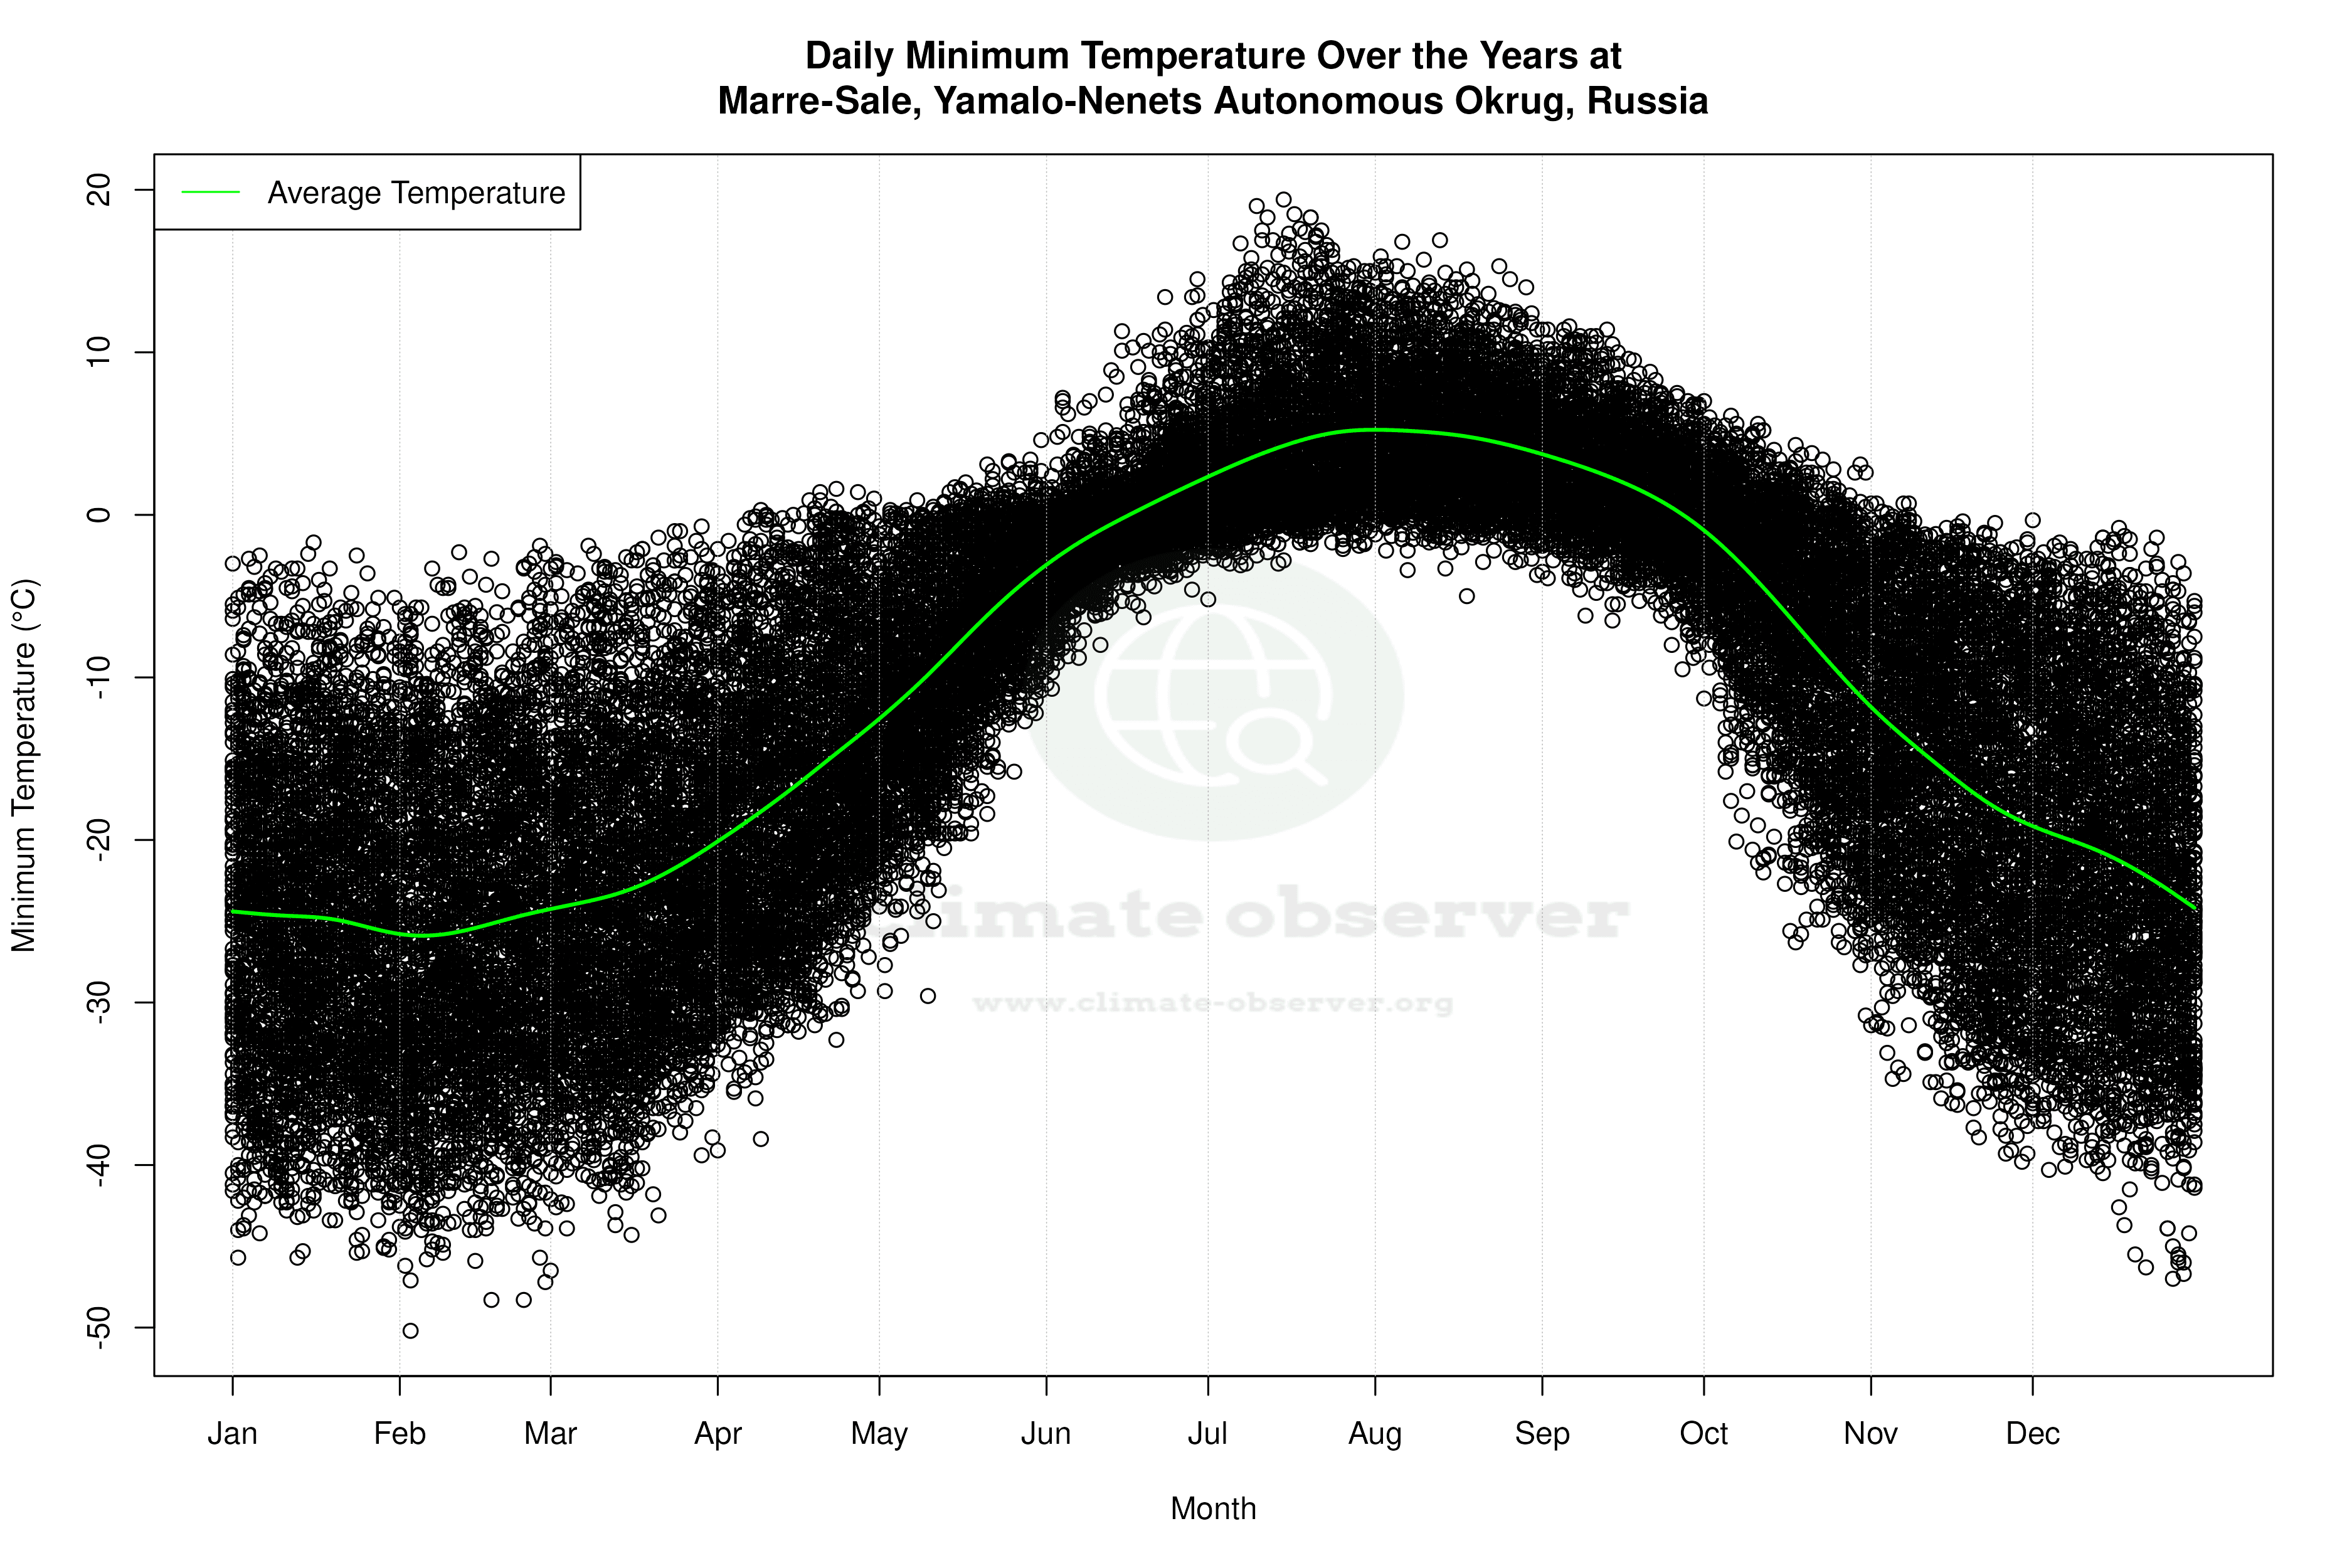
The temperature records for Marre-Sale underscore the harshness of its climate. The highest recorded temperature is 29.5°C (85.1°F), while the lowest plunges to -50.2°C (-58.4°F). These extremes highlight the significant thermal variability inherent to Arctic regions. The recent cooling trend in high temperatures over the past decade contrasts with the long-term warming, indicating potential shifts in atmospheric patterns or sea ice dynamics.
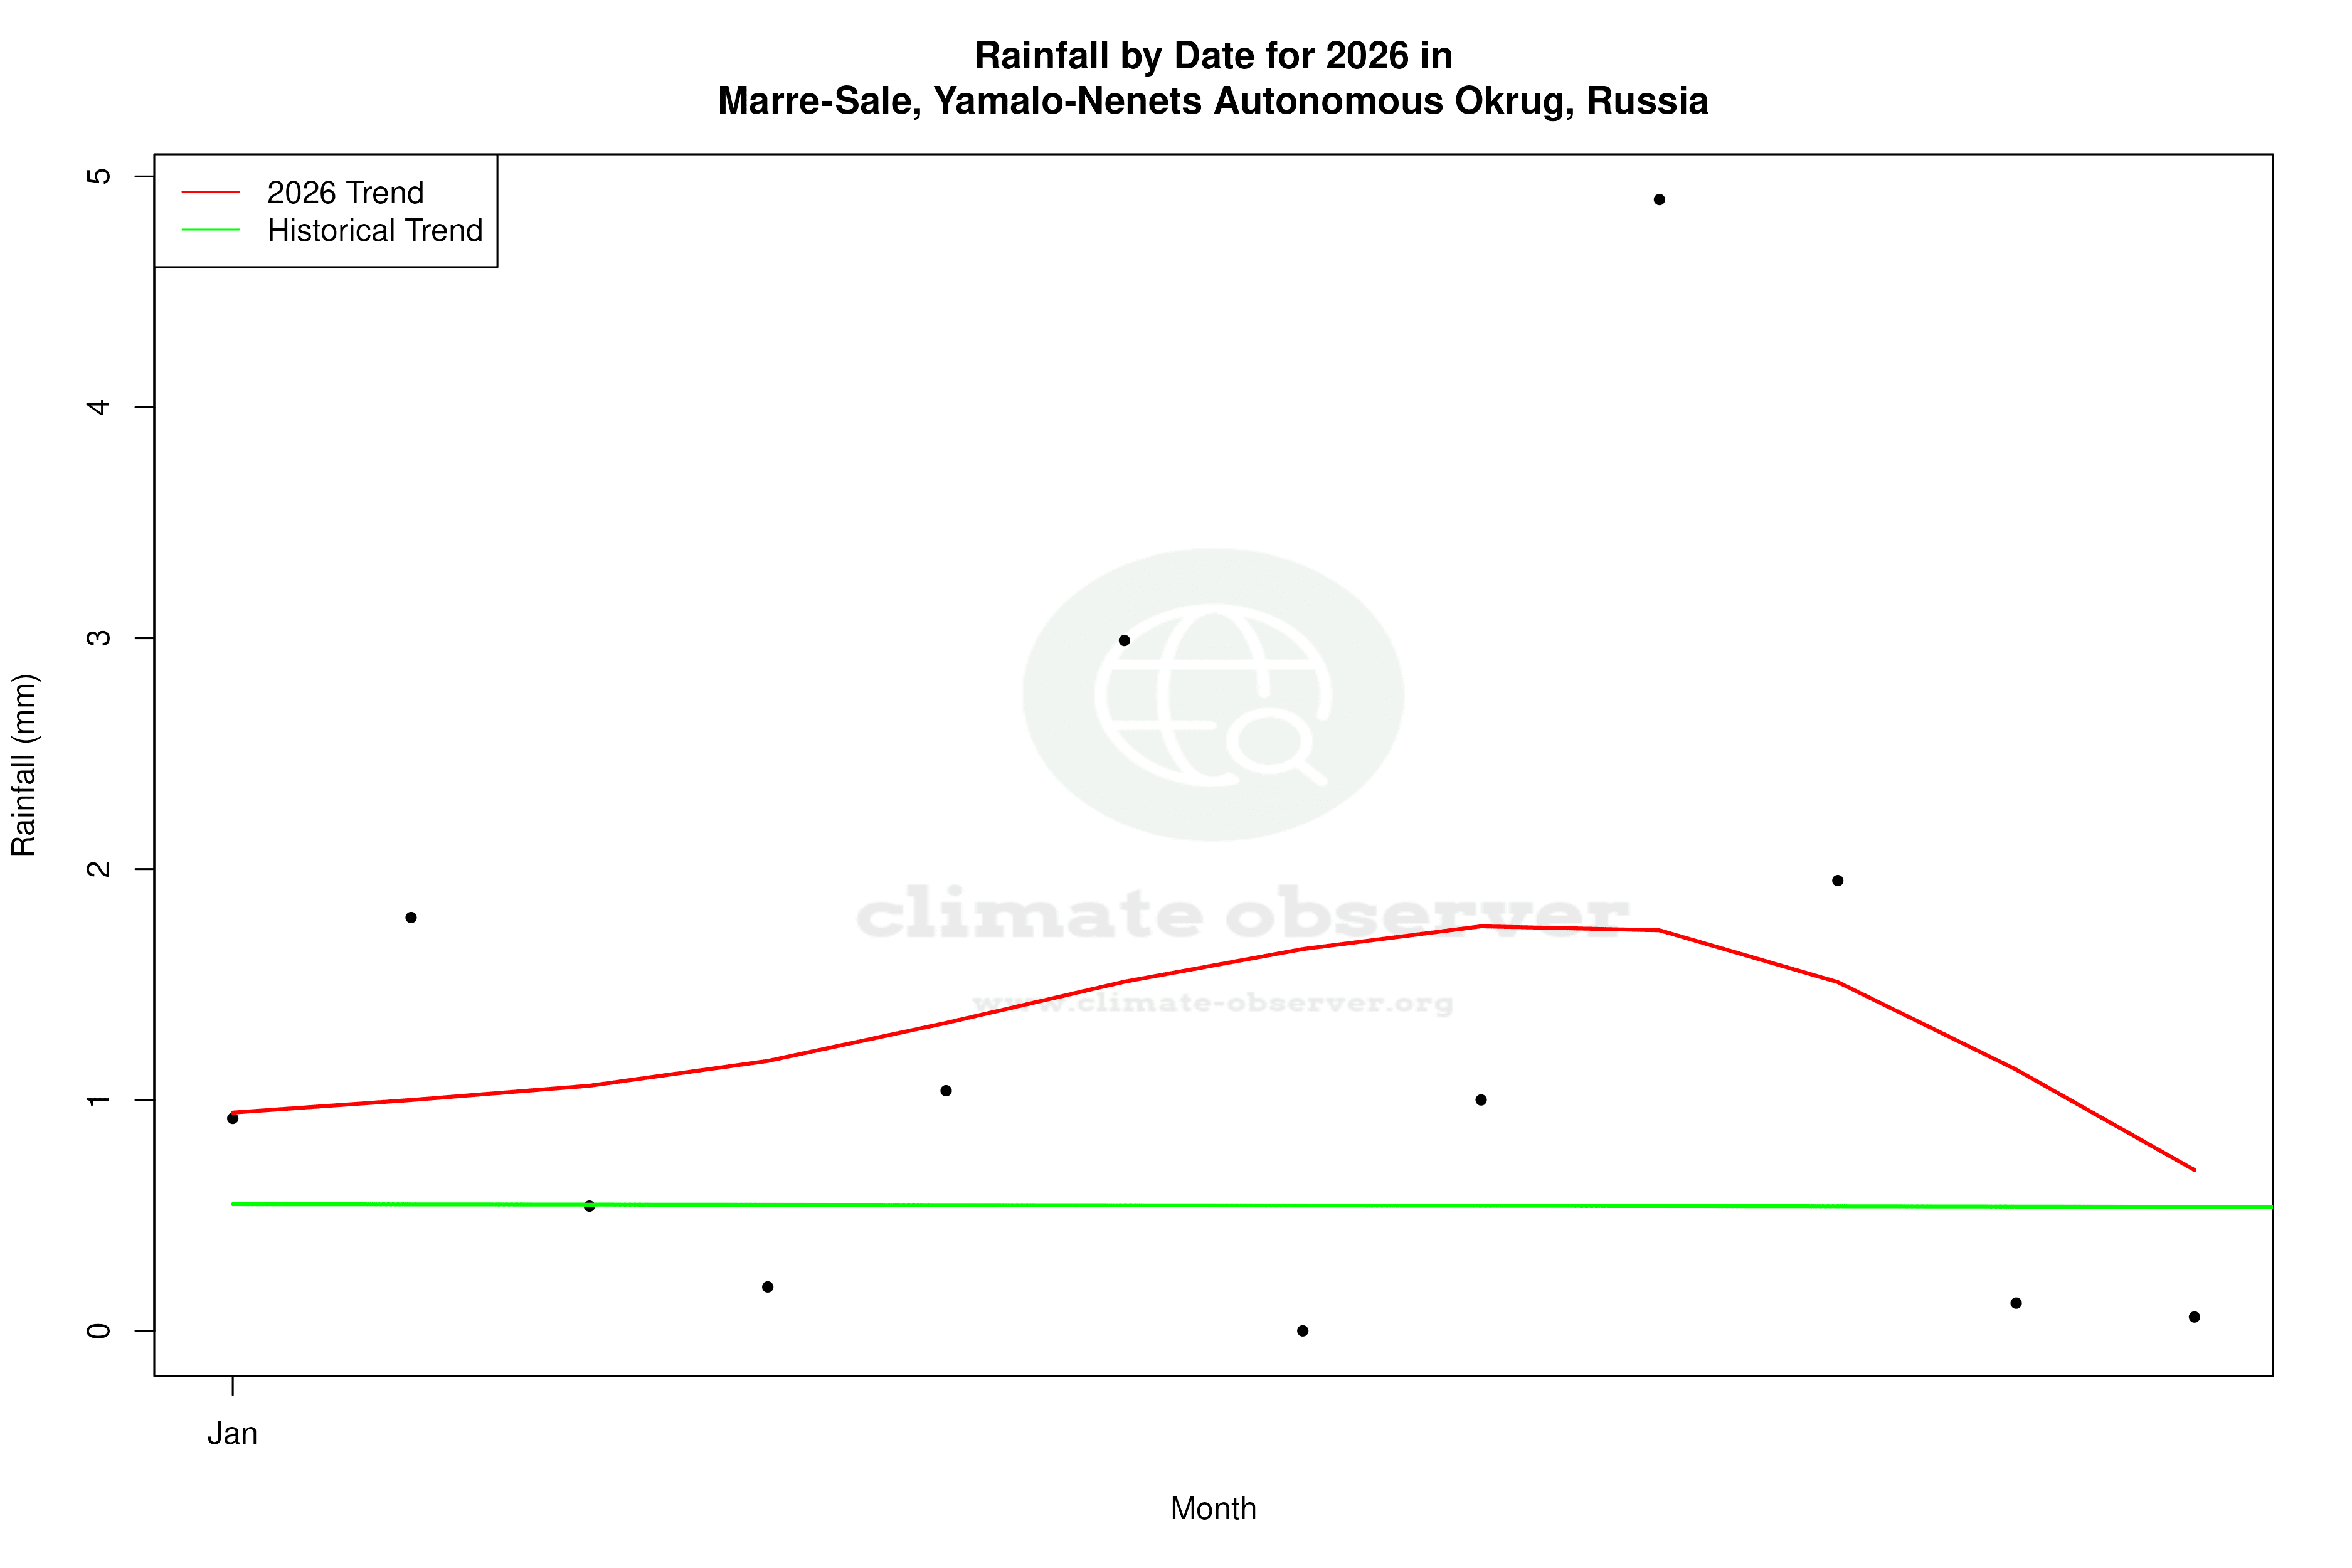
Precipitation Patterns Shifting
The Precipitation Concentration Index (PCI) offers insights into how rainfall is distributed over time. A decrease from a baseline of 11.16 to a current value of 10.21 suggests that precipitation events have become more evenly distributed. This marginal change indicates a shift towards a more balanced distribution of rainfall, which could be a response to broader climatic changes or localised weather phenomena. Such changes can have significant implications for the local ecosystem and human activities.
Regional Climate Goals and Observations
Russia's climate goals, particularly in the Arctic, focus on adapting to and mitigating the impacts of climate change. The observed trends in Marre-Sale, with its nuanced temperature dynamics and evolving precipitation patterns, provide valuable data for understanding regional climate behaviour. The cooling trend in high temperatures over the last decade may inform adaptive strategies, while the more even distribution of precipitation could influence resource management and infrastructure planning.
Implications for Future Research
The climate profile of Marre-Sale illustrates the complexity of Arctic climate systems. The interplay between long-term warming and recent cooling trends, alongside changes in precipitation distribution, underscores the need for continued monitoring and research. Understanding these dynamics is crucial for predicting future climate scenarios and developing effective adaptation strategies for the region.
Station Statistics
10-Year Trend
High: -1.32 °F/decade
Low: +1.93 °F/decade
Rain: +0.007 in/decade
25-Year Trend
High: +1.75 °F/decade
Low: +2.68 °F/decade
Rain: +0.005 in/decade
50-Year Trend
High: +1.28 °F/decade
Low: +1.79 °F/decade
Rain: +0.002 in/decade
All-Time Trend
High: +0.40 °F/decade
Low: +0.54 °F/decade
Rain: +0.002 in/decade
Percentage Above-Average Days
Last 12 Months: 60.0%
This Year: 52.3%
Precipitation Concentration Index (PCI) ℹ️
Last 12 Months: 12.4
Historical Average: 11.9
Percentile Rank of Last 12 Months ℹ️
High: 74th percentile
Low: 92nd percentile
Rain: 91st percentile
Change in Variance ℹ️
High: -4.3%
Low: -8.5%
Intraday: -12.1%
Data Coverage
95.0%
First Year of Data
1914
Station Location
Historical Weather Records
| Max High | Avg High | Min High | Max Avg | Avg Avg | Min Avg | Max Low | Avg Low | Min Low | Max Precipitation | Avg Precipitation | Max Snow | Avg Snow | |
|---|---|---|---|---|---|---|---|---|---|---|---|---|---|
| Record | 85.10 °F | — | -46.84 °F | 74.48 °F | — | -50.62 °F | 66.92 °F | — | -58.36 °F | 2.76 in | — | — | — |
| January | 33.98 °F | 2.05 °F | -42.70 °F | 31.28 °F | -5.25 °F | -47.74 °F | 28.94 °F | -12.69 °F | -50.26 °F | 2.06 in | 0.02 in | — | — |
| February | 33.98 °F | 0.54 °F | -46.48 °F | 31.46 °F | -6.40 °F | -49.90 °F | 28.76 °F | -13.56 °F | -58.36 °F | 0.68 in | 0.02 in | — | — |
| March | 39.74 °F | 5.80 °F | -37.30 °F | 33.80 °F | -1.58 °F | -43.24 °F | 30.20 °F | -9.04 °F | -51.70 °F | 2.76 in | 0.02 in | — | — |
| April | 41.72 °F | 16.99 °F | -21.28 °F | 37.22 °F | 9.75 °F | -29.92 °F | 34.88 °F | 2.32 °F | -38.38 °F | 0.40 in | 0.02 in | — | — |
| May | 60.80 °F | 28.06 °F | -3.82 °F | 48.38 °F | 23.04 °F | -10.66 °F | 42.01 °F | 17.93 °F | -21.28 °F | 1.11 in | 0.02 in | — | — |
| June | 75.20 °F | 41.48 °F | 21.02 °F | 64.76 °F | 35.88 °F | 19.04 °F | 51.98 °F | 31.53 °F | 12.74 °F | 1.50 in | 0.04 in | — | — |
| July | 85.10 °F | 53.15 °F | 31.82 °F | 74.48 °F | 45.63 °F | 30.20 °F | 66.92 °F | 39.58 °F | 22.64 °F | 1.59 in | 0.04 in | — | — |
| August | 80.06 °F | 50.85 °F | 31.28 °F | 69.44 °F | 45.23 °F | 29.30 °F | 62.42 °F | 40.53 °F | 23.00 °F | 1.55 in | 0.05 in | — | — |
| September | 66.02 °F | 42.51 °F | 25.88 °F | 57.56 °F | 38.80 °F | 22.64 °F | 52.52 °F | 35.31 °F | 14.90 °F | 1.11 in | 0.05 in | — | — |
| October | 51.26 °F | 29.79 °F | -7.78 °F | 46.40 °F | 25.61 °F | -19.30 °F | 44.60 °F | 21.19 °F | -23.44 °F | 0.70 in | 0.04 in | — | — |
| November | 40.10 °F | 16.45 °F | -36.58 °F | 35.96 °F | 9.98 °F | -38.56 °F | 33.26 °F | 3.39 °F | -39.64 °F | 2.09 in | 0.02 in | — | — |
| December | 33.98 °F | 7.86 °F | -46.84 °F | 32.18 °F | 0.88 °F | -50.62 °F | 30.56 °F | -6.29 °F | -52.60 °F | 2.01 in | 0.02 in | — | — |
Data Visualisations
Remove WatermarksCurrent Year Climate Trends vs Historical


Max Temperature this Year | 1 of 6
Climate 12-Month Moving Averages


Max Temperature 12-Month MA | 1 of 6
Daily Data Points and Averages Throughout the Year


Average Max Temperature Throughout Year | 1 of 5
