Climate for Station: Ust Tzilma, Komi Republic, Russia
Loading live weather...
Climate Analysis & Overview
Ust Tzilma, located in Russia's Komi Republic, is experiencing a warming trend in both high and low temperatures, with a notable decrease in precipitation concentration, suggesting more evenly distributed rainfall. This aligns with Russia's regional climate goals to mitigate extreme weather patterns and improve water resource management.
Geographical Context and Climate Classification
Ust Tzilma is situated in the Komi Republic, within the Northwestern Federal District of Russia. The region is characterised by a subarctic climate (Köppen Dfc), marked by long, cold winters and short, mild summers. The local geography, including expansive forests and proximity to the Pechora River, influences its climate patterns, contributing to significant seasonal temperature variations and precipitation distribution.
Temperature Trends: A Warming Trajectory
Over the past decade, Ust Tzilma has experienced a warming trend, with high temperatures increasing by 0.11°C (0.20°F) and low temperatures by 0.15°C (0.27°F). When examining the all-time trends, the warming is even more pronounced, with high temperatures rising by 0.15°C (0.27°F) and low temperatures by 0.20°C (0.36°F). These trends indicate a consistent increase in temperature, which could have implications for local ecosystems and human activities, such as agriculture and energy consumption.
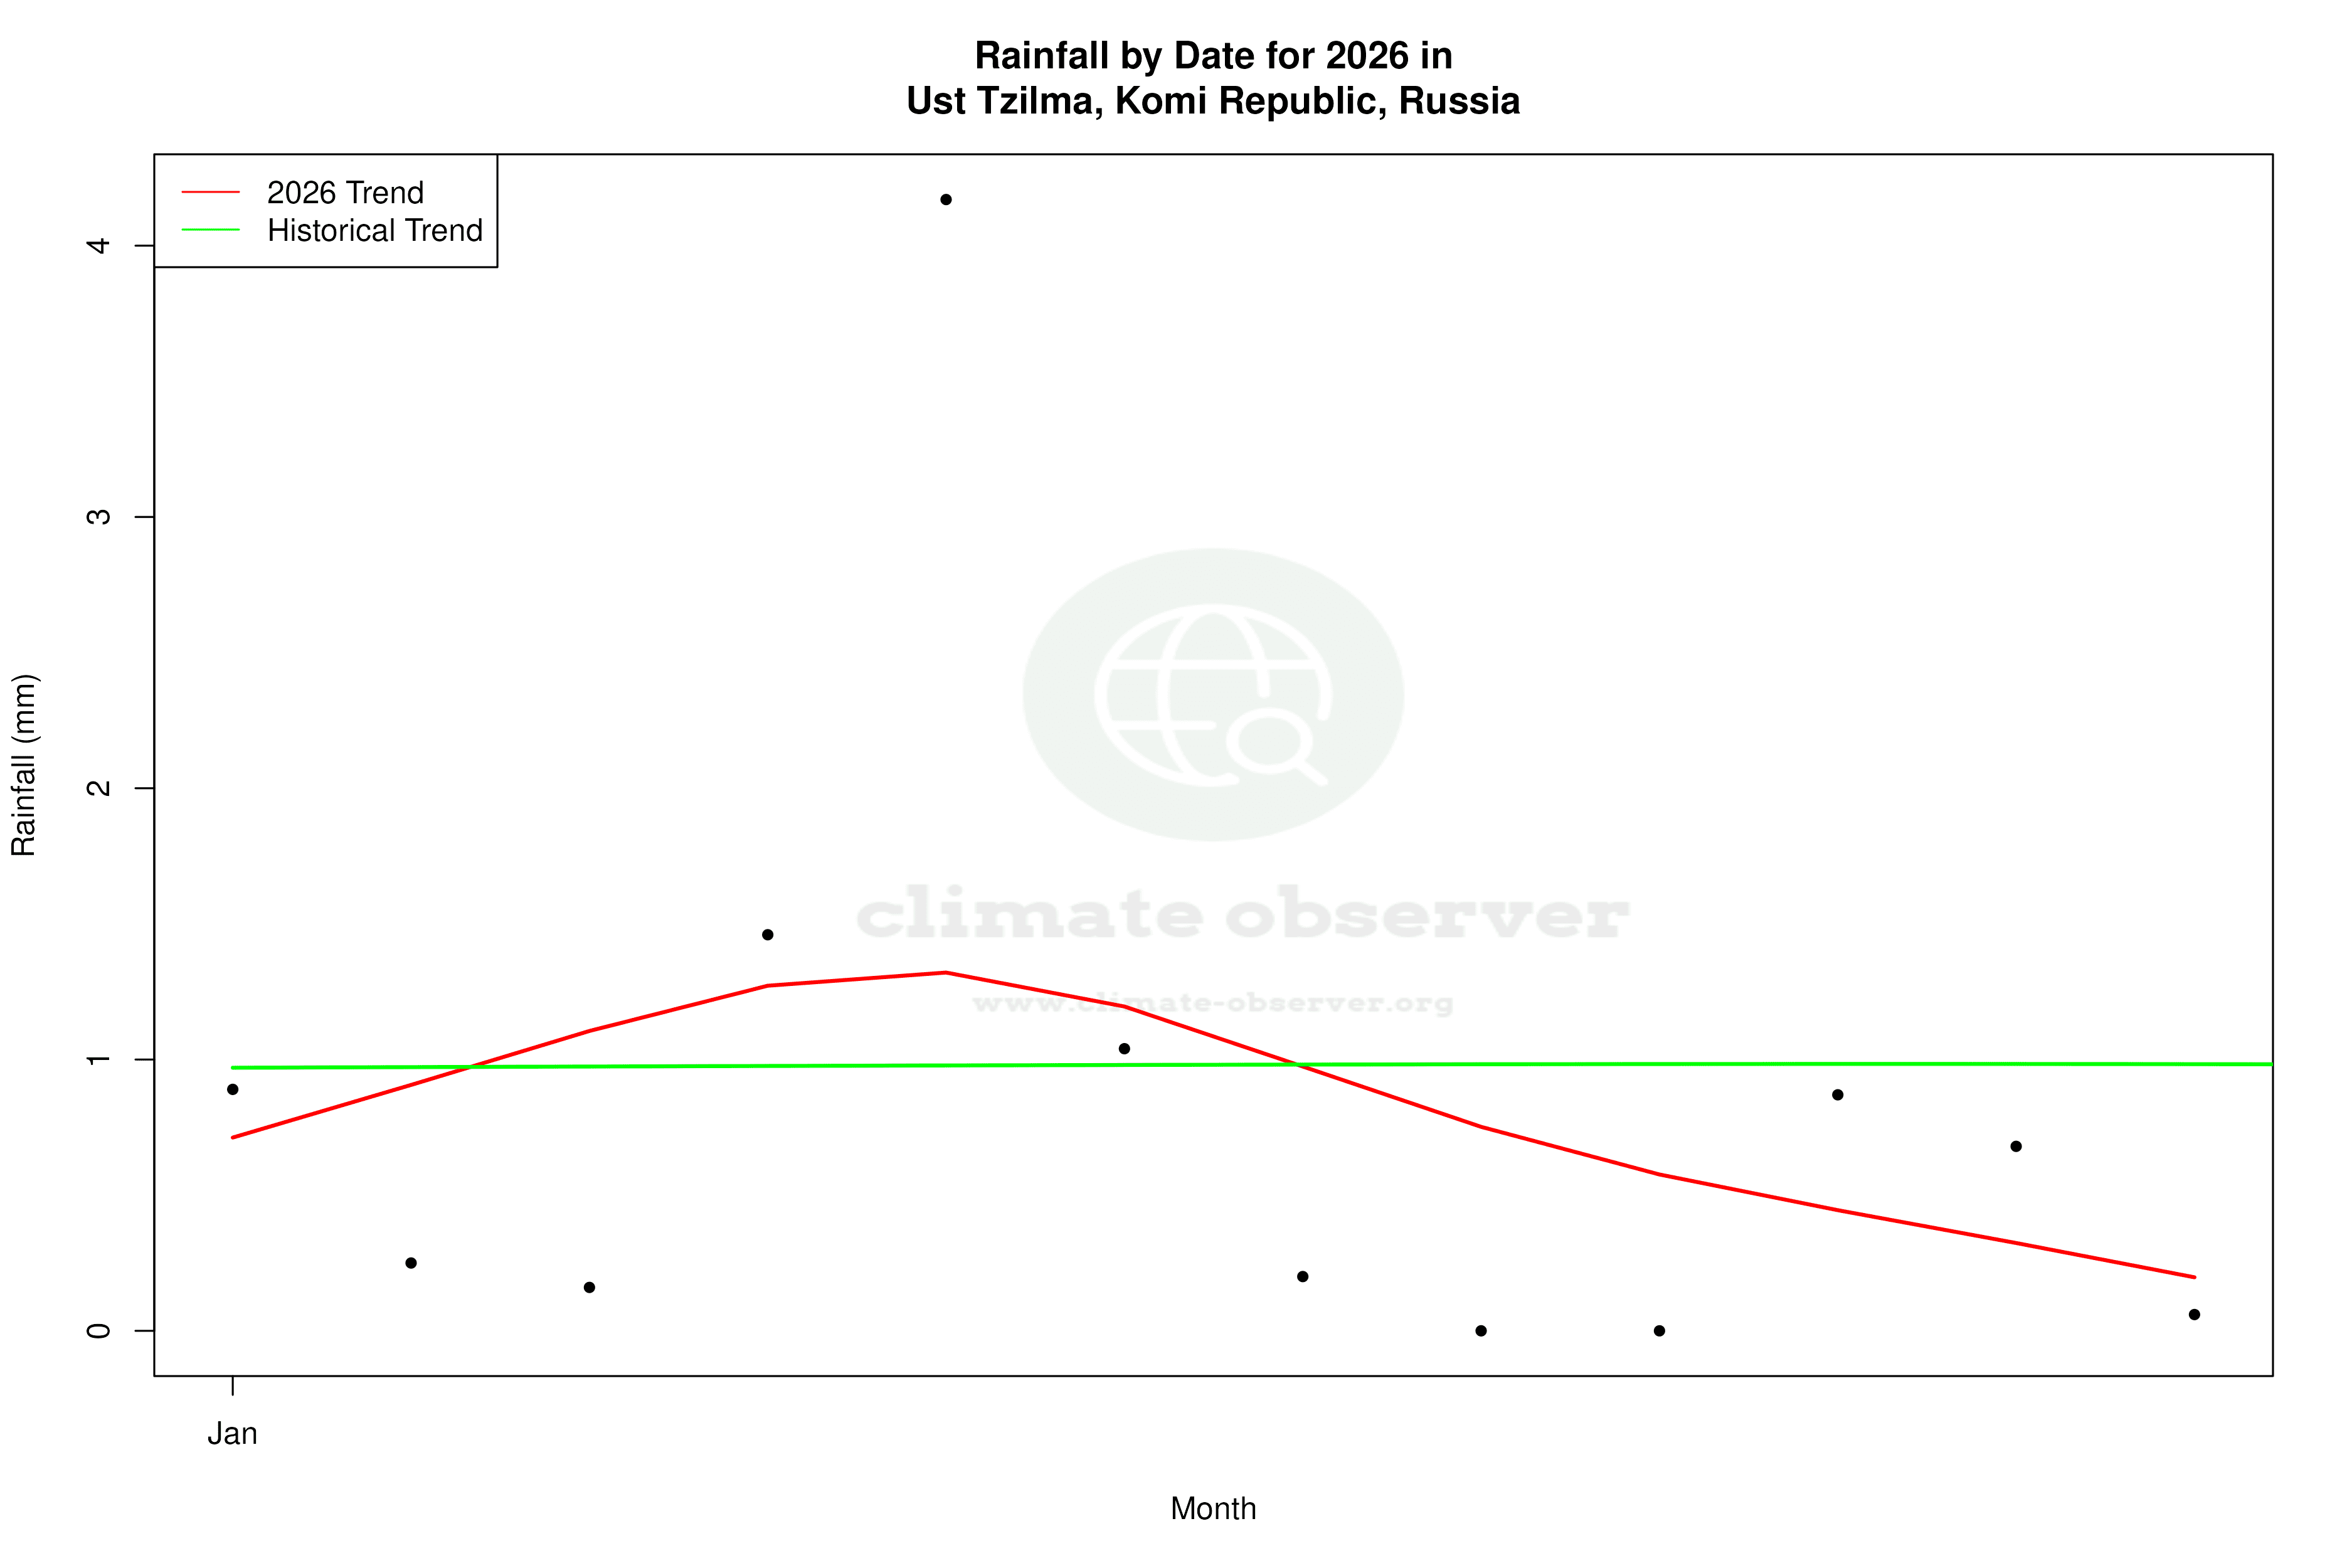
Precipitation Patterns: A Shift Towards Even Distribution
The Precipitation Concentration Index (PCI) for Ust Tzilma has decreased from a baseline of 11.29 to a current value of 9.20. This change signifies a more even distribution of precipitation events throughout the year, reducing the likelihood of intense, sporadic rainfall. Such a shift could benefit water management strategies, aligning with Russia's goals to adapt to climate change by enhancing the resilience of water resources.
Extreme Temperature Records
Ust Tzilma's climate is marked by extreme temperature records, with a maximum recorded temperature of 33.6°C (92.5°F) and a minimum of -51.5°C (-60.7°F). These extremes highlight the region's vulnerability to both heatwaves and severe cold spells, which can have significant impacts on infrastructure and public health.
Implications and Regional Context
The observed climatic changes in Ust Tzilma are part of broader regional trends in Russia, where efforts are underway to address climate variability and its impacts. The warming trends and changes in precipitation distribution align with national objectives to reduce the adverse effects of climate change, such as flooding and droughts, while promoting sustainable development and environmental conservation.
Station Statistics
10-Year Trend
High: -0.80 °F/decade
Low: -0.30 °F/decade
Rain: -0.005 in/decade
25-Year Trend
High: +0.90 °F/decade
Low: +1.18 °F/decade
Rain: +0.000 in/decade
50-Year Trend
High: +0.77 °F/decade
Low: +0.94 °F/decade
Rain: +0.000 in/decade
All-Time Trend
High: +0.27 °F/decade
Low: +0.32 °F/decade
Rain: +0.002 in/decade
Percentage Above-Average Days
Last 12 Months: 48.1%
This Year: 47.0%
Precipitation Concentration Index (PCI) ℹ️
Last 12 Months: 10.1
Historical Average: 10.7
Percentile Rank of Last 12 Months ℹ️
High: 83rd percentile
Low: 90th percentile
Rain: 62nd percentile
Change in Variance ℹ️
High: -1.8%
Low: -12.5%
Intraday: +13.3%
Data Coverage
92.7%
First Year of Data
1892
Station Location
Historical Weather Records
| Max High | Avg High | Min High | Max Avg | Avg Avg | Min Avg | Max Low | Avg Low | Min Low | Max Precipitation | Avg Precipitation | Max Snow | Avg Snow | |
|---|---|---|---|---|---|---|---|---|---|---|---|---|---|
| Record | 92.48 °F | — | -55.30 °F | 82.58 °F | — | -56.20 °F | 73.76 °F | — | -60.70 °F | 2.60 in | — | — | — |
| January | 37.58 °F | 8.55 °F | -47.38 °F | 35.78 °F | 1.53 °F | -52.96 °F | 33.26 °F | -5.82 °F | -59.98 °F | 0.59 in | 0.04 in | — | — |
| February | 38.48 °F | 11.16 °F | -39.28 °F | 35.78 °F | 4.27 °F | -43.42 °F | 34.16 °F | -2.68 °F | -52.06 °F | 0.38 in | 0.03 in | — | — |
| March | 53.78 °F | 22.98 °F | -22.00 °F | 45.14 °F | 14.51 °F | -37.12 °F | 40.46 °F | 6.20 °F | -46.84 °F | 0.63 in | 0.03 in | — | — |
| April | 75.38 °F | 36.48 °F | 2.12 °F | 56.66 °F | 27.98 °F | -11.02 °F | 49.64 °F | 19.68 °F | -27.94 °F | 1.02 in | 0.04 in | — | — |
| May | 89.96 °F | 48.04 °F | 13.10 °F | 75.92 °F | 39.09 °F | 6.08 °F | 64.94 °F | 31.36 °F | -4.90 °F | 1.30 in | 0.05 in | — | — |
| June | 90.86 °F | 61.82 °F | 32.18 °F | 82.58 °F | 52.22 °F | 27.32 °F | 70.88 °F | 43.62 °F | 19.76 °F | 1.54 in | 0.07 in | — | — |
| July | 92.48 °F | 68.41 °F | 40.10 °F | 81.68 °F | 59.07 °F | 36.68 °F | 73.76 °F | 50.35 °F | 31.82 °F | 2.60 in | 0.08 in | — | — |
| August | 90.14 °F | 62.32 °F | 41.36 °F | 75.92 °F | 53.87 °F | 35.42 °F | 70.34 °F | 46.42 °F | 20.48 °F | 2.22 in | 0.08 in | — | — |
| September | 78.98 °F | 50.59 °F | 30.92 °F | 66.38 °F | 43.91 °F | 20.30 °F | 59.18 °F | 38.39 °F | 11.84 °F | 1.71 in | 0.08 in | — | — |
| October | 66.02 °F | 35.14 °F | -3.28 °F | 57.74 °F | 30.70 °F | -5.62 °F | 53.78 °F | 26.31 °F | -14.26 °F | 1.02 in | 0.07 in | — | — |
| November | 50.54 °F | 22.60 °F | -36.94 °F | 42.98 °F | 17.22 °F | -41.44 °F | 40.28 °F | 11.39 °F | -46.12 °F | 0.79 in | 0.05 in | — | — |
| December | 38.84 °F | 13.66 °F | -55.30 °F | 36.32 °F | 7.09 °F | -56.20 °F | 34.88 °F | 0.55 °F | -60.70 °F | 0.54 in | 0.04 in | — | — |
Data Visualisations
Remove WatermarksCurrent Year Climate Trends vs Historical


Max Temperature this Year | 1 of 6
Climate 12-Month Moving Averages


Max Temperature 12-Month MA | 1 of 6
Daily Data Points and Averages Throughout the Year


Average Max Temperature Throughout Year | 1 of 5
