Climate for Station: Markovo, Chukotka Autonomous Okrug, Russia
Loading live weather...
Climate Analysis & Overview
Markovo, located in the far reaches of Russia's Chukotka Autonomous Okrug, is experiencing a complex climate narrative. While all-time temperature trends show a slight warming, recent decades have seen a cooling trend in high temperatures. Precipitation is becoming more concentrated, suggesting shifts in local weather patterns.
A Tale of Two Temperature Trends
Markovo's climate, classified as subarctic under the Köppen system, is shaped by its proximity to the Bering Sea and the surrounding tundra. The all-time temperature trends reveal a subtle warming, with high temperatures rising by 0.32°C (0.58°F) and lows by 0.18°C (0.32°F). However, the past decade tells a different story. Highs have cooled by 2.85°C (5.13°F), a significant change, while lows have decreased by 0.80°C (1.44°F). This divergence between long-term and recent trends highlights the complexity of local climate dynamics, possibly influenced by regional atmospheric patterns and oceanic currents.
Extreme Temperature Records
Markovo's extreme temperature records underscore its harsh climate. The highest recorded temperature is 33.3°C (91.9°F), while the lowest plummets to a frigid -66.9°C (-88.4°F). These extremes reflect the region's capacity for severe weather, driven by its high latitude and continental influences. Such variability poses challenges for both the ecosystem and human activities, particularly in light of Russia's regional climate goals aimed at mitigating the impacts of extreme weather.
Precipitation Patterns: A Shift Towards Concentration
The Precipitation Concentration Index (PCI) for Markovo has increased from a baseline of 12.34 to a current value of 13.80, indicating a more concentrated precipitation pattern. This means that rainfall is occurring in fewer, more intense events rather than being evenly distributed throughout the year. Such a shift can lead to challenges in water management and agriculture, as periods of drought may alternate with flooding.
Regional Climate Context
Markovo's climate trends are set against the backdrop of broader regional changes. The Chukotka region, part of Russia's Far East, is experiencing shifts in sea ice extent and permafrost stability, both of which can influence local climate patterns. Recent weather events, such as unseasonably warm winters or intense summer storms, may be symptomatic of these larger shifts. Understanding these trends is crucial for adapting to future changes and aligning with Russia's climate adaptation strategies.
Station Statistics
10-Year Trend
High: -5.12 °F/decade
Low: -0.92 °F/decade
Rain: -0.010 in/decade
25-Year Trend
High: +0.19 °F/decade
Low: +0.84 °F/decade
Rain: +0.006 in/decade
50-Year Trend
High: +0.76 °F/decade
Low: +0.69 °F/decade
Rain: +0.002 in/decade
All-Time Trend
High: +0.58 °F/decade
Low: +0.33 °F/decade
Rain: +0.002 in/decade
Percentage Above-Average Days
Last 12 Months: 54.2%
This Year: 42.8%
Precipitation Concentration Index (PCI) ℹ️
Last 12 Months: 10.9
Historical Average: 12.3
Percentile Rank of Last 12 Months ℹ️
High: 77th percentile
Low: 95th percentile
Rain: 58th percentile
Change in Variance ℹ️
High: -5.2%
Low: -9.6%
Intraday: +24.2%
Data Coverage
83.4%
First Year of Data
1894
Station Location
Historical Weather Records
| Max High | Avg High | Min High | Max Avg | Avg Avg | Min Avg | Max Low | Avg Low | Min Low | Max Precipitation | Avg Precipitation | Max Snow | Avg Snow | |
|---|---|---|---|---|---|---|---|---|---|---|---|---|---|
| Record | 91.94 °F | — | -75.82 °F | 78.26 °F | — | -80.68 °F | 68.36 °F | — | -88.42 °F | 2.54 in | — | — | — |
| January | 41.36 °F | -6.97 °F | -75.82 °F | 37.76 °F | -14.77 °F | -80.68 °F | 35.06 °F | -24.12 °F | -88.42 °F | 0.82 in | 0.03 in | — | — |
| February | 38.84 °F | -4.81 °F | -59.80 °F | 35.60 °F | -13.40 °F | -63.94 °F | 27.14 °F | -23.22 °F | -72.22 °F | 0.67 in | 0.03 in | — | — |
| March | 40.28 °F | 2.66 °F | -40.00 °F | 37.94 °F | -7.48 °F | -48.10 °F | 32.72 °F | -18.70 °F | -66.64 °F | 1.15 in | 0.02 in | — | — |
| April | 44.96 °F | 17.28 °F | -20.38 °F | 37.40 °F | 7.69 °F | -28.30 °F | 33.98 °F | -3.97 °F | -45.94 °F | 0.50 in | 0.02 in | — | — |
| May | 72.14 °F | 38.09 °F | 3.56 °F | 60.98 °F | 31.04 °F | -7.78 °F | 47.30 °F | 22.44 °F | -29.74 °F | 0.64 in | 0.02 in | — | — |
| June | 90.32 °F | 62.03 °F | 32.36 °F | 77.18 °F | 52.42 °F | 28.58 °F | 63.86 °F | 41.17 °F | 20.30 °F | 1.05 in | 0.04 in | — | — |
| July | 91.94 °F | 67.42 °F | 44.42 °F | 78.26 °F | 57.83 °F | 41.00 °F | 68.36 °F | 47.08 °F | 25.88 °F | 1.47 in | 0.06 in | — | — |
| August | 84.02 °F | 61.01 °F | 35.60 °F | 71.78 °F | 51.57 °F | 32.90 °F | 63.68 °F | 41.83 °F | 19.04 °F | 2.54 in | 0.07 in | — | — |
| September | 73.94 °F | 48.07 °F | 23.00 °F | 72.86 °F | 39.22 °F | 1.76 °F | 52.88 °F | 30.90 °F | 0.68 °F | 1.72 in | 0.05 in | — | — |
| October | 58.28 °F | 24.78 °F | -14.26 °F | 50.72 °F | 17.48 °F | -23.26 °F | 46.40 °F | 10.05 °F | -36.22 °F | 0.96 in | 0.04 in | — | — |
| November | 43.16 °F | 5.87 °F | -45.94 °F | 37.22 °F | -1.40 °F | -55.12 °F | 32.90 °F | -10.10 °F | -61.06 °F | 1.09 in | 0.04 in | — | — |
| December | 48.56 °F | -5.65 °F | -59.98 °F | 37.58 °F | -12.92 °F | -61.78 °F | 31.82 °F | -21.75 °F | -64.84 °F | 0.78 in | 0.03 in | — | — |
Data Visualisations
Remove WatermarksCurrent Year Climate Trends vs Historical


Max Temperature this Year | 1 of 6
Climate 12-Month Moving Averages


Max Temperature 12-Month MA | 1 of 6
Daily Data Points and Averages Throughout the Year

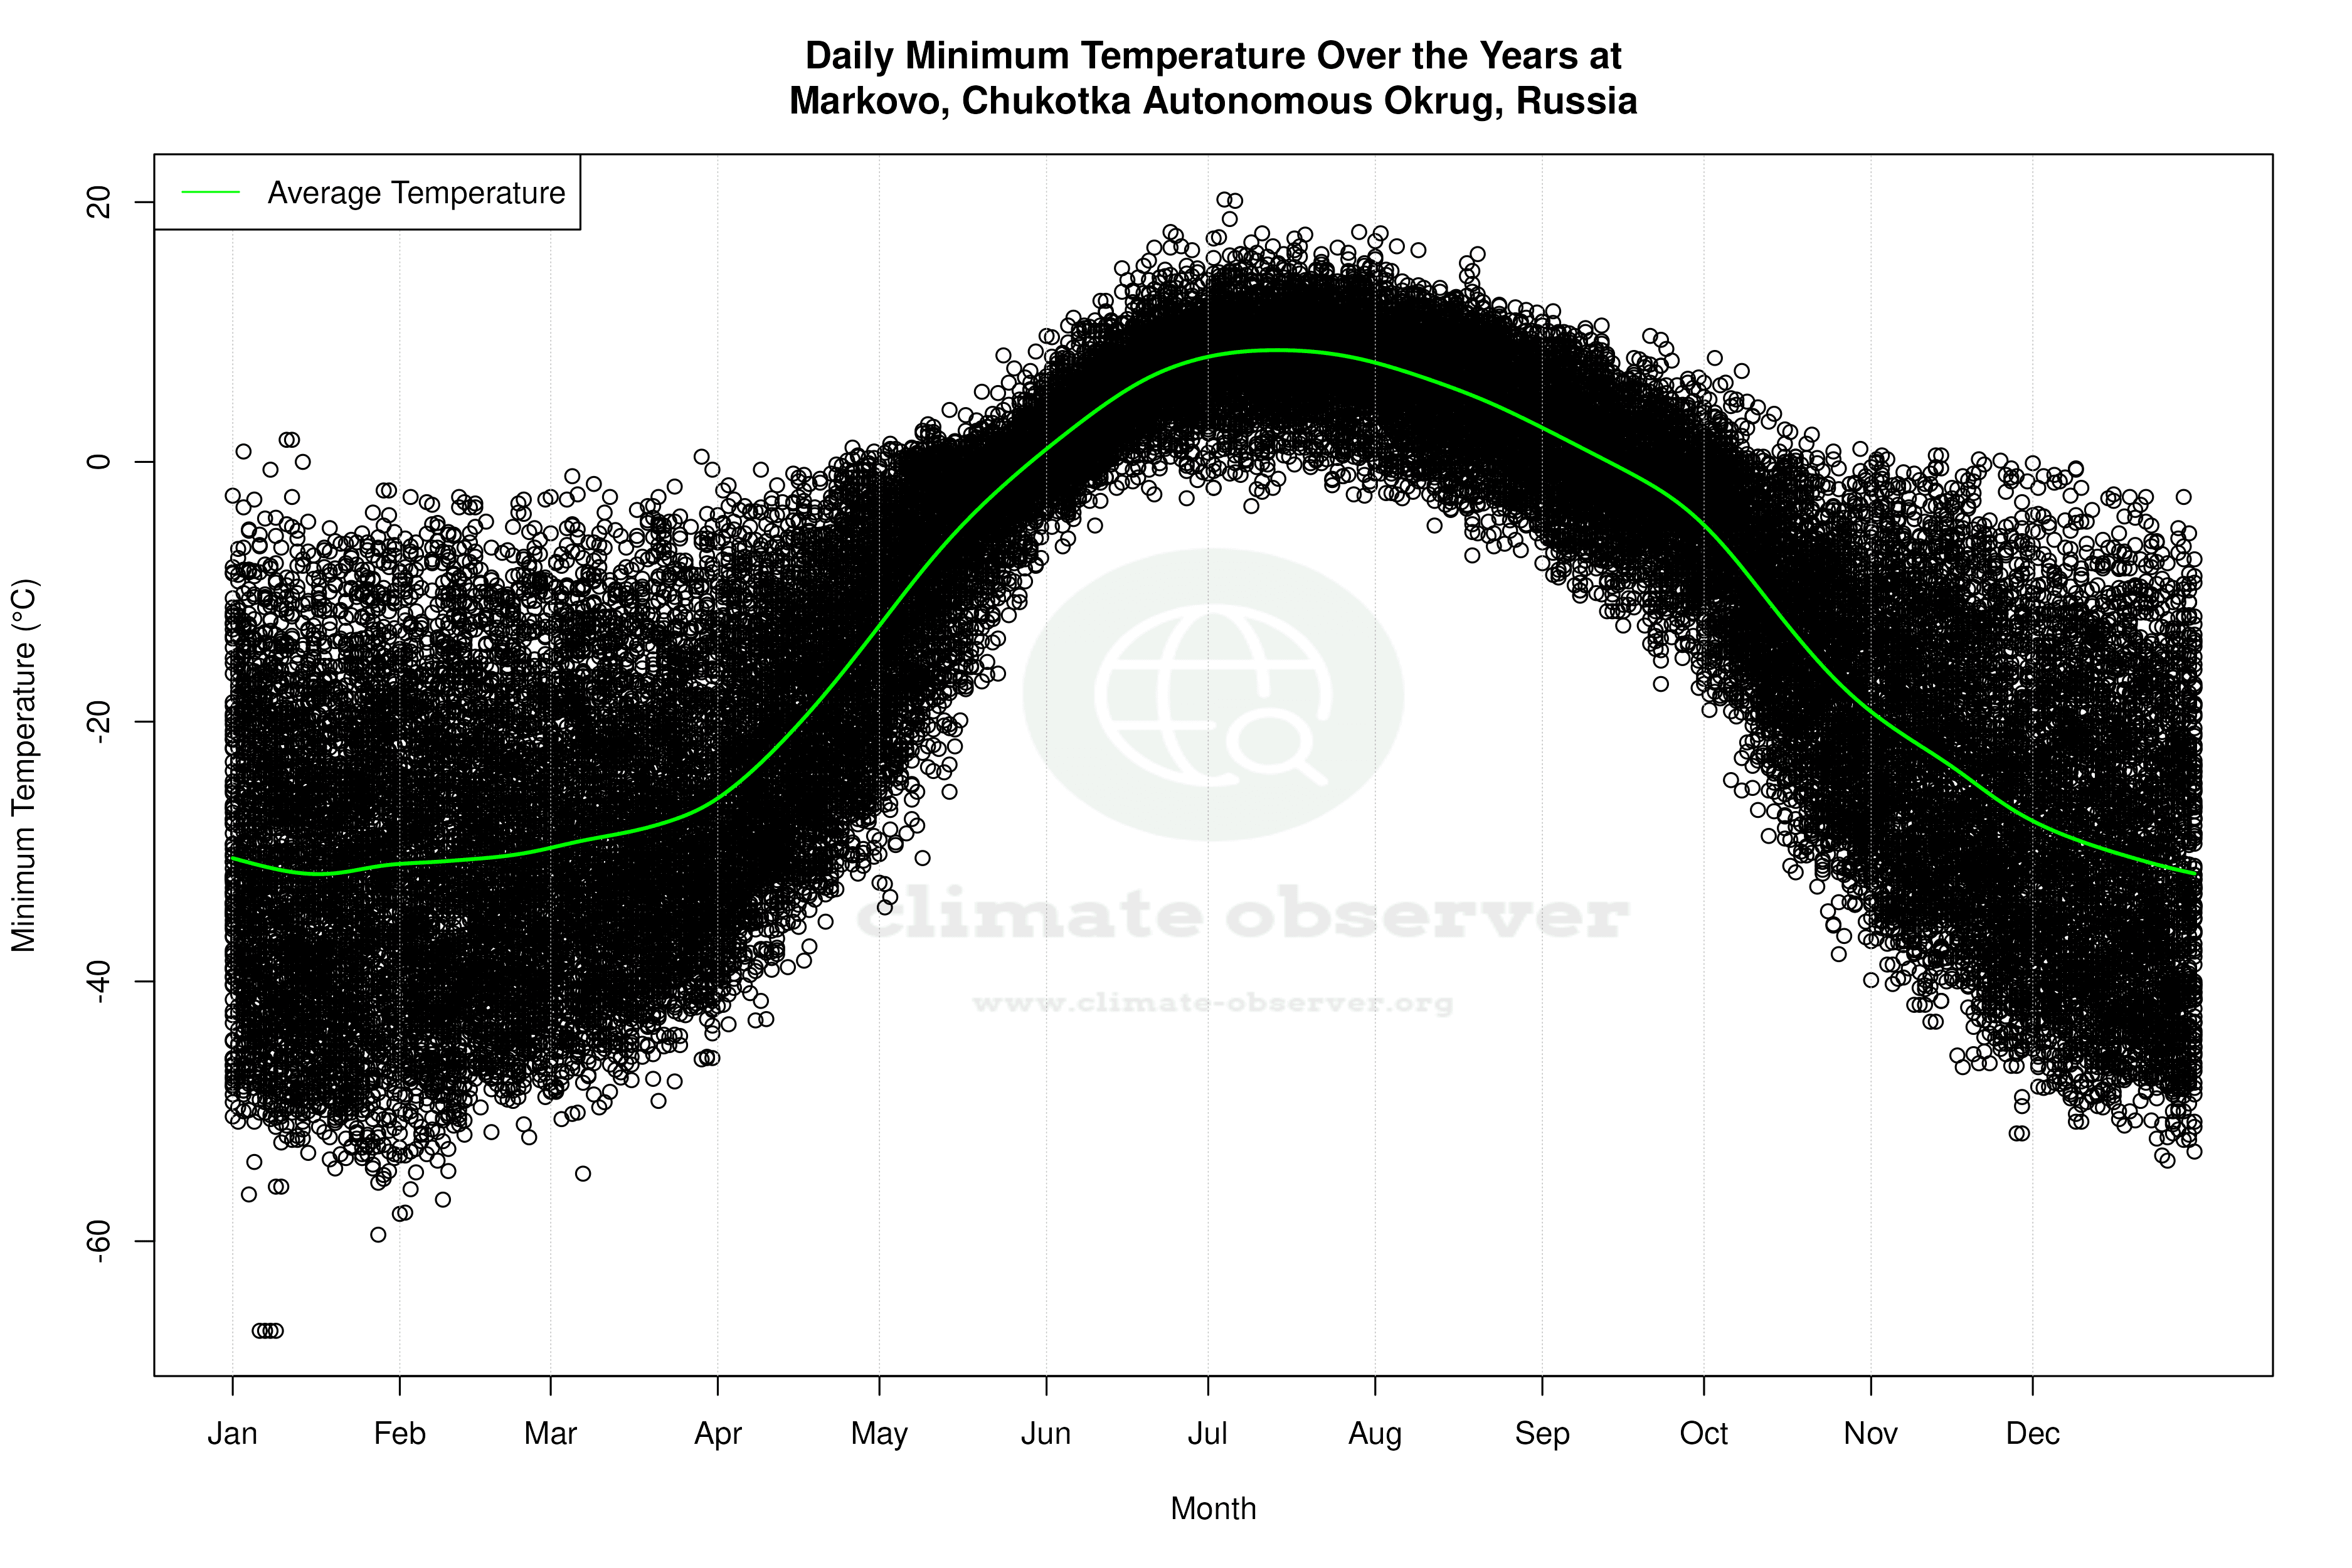


Average Max Temperature Throughout Year | 1 of 5
