Climate for Station: Anadyr, Chukotka Autonomous Okrug, Russia
Loading live weather...
Climate Analysis & Overview
Anadyr's climate profile reveals a complex interplay of warming and cooling trends. While the all-time data suggests a slight warming, recent trends indicate a notable cooling, particularly in nighttime temperatures. Precipitation patterns are becoming more concentrated, highlighting changes in local weather dynamics.
Geographical Context and Climate Classification
Anadyr, located at 64.7831°N, 177.5667°E, is situated in the Chukotka Autonomous Okrug of Russia. This region is characterised by a Tundra climate (ET) under the Köppen classification, which is defined by long, harsh winters and short, cool summers. The proximity to the Bering Sea influences its climate, moderating temperatures slightly compared to more inland areas. The surrounding geography, with its vast expanses of tundra and proximity to the sea, plays a crucial role in shaping local weather patterns.
Temperature Trends: A Tale of Two Stories
The temperature trends in Anadyr present a nuanced picture. Over the past decade, there has been a cooling trend with average highs falling by 2.21°C (3.98°F) and lows decreasing by 2.96°C (5.33°F). This recent cooling contrasts with the all-time data, which shows a slight warming with highs rising by 0.25°C (0.45°F) and lows by 0.23°C (0.41°F). This divergence suggests that while long-term trends indicate a gradual warming, recent years have experienced a reversal, particularly in nighttime temperatures.
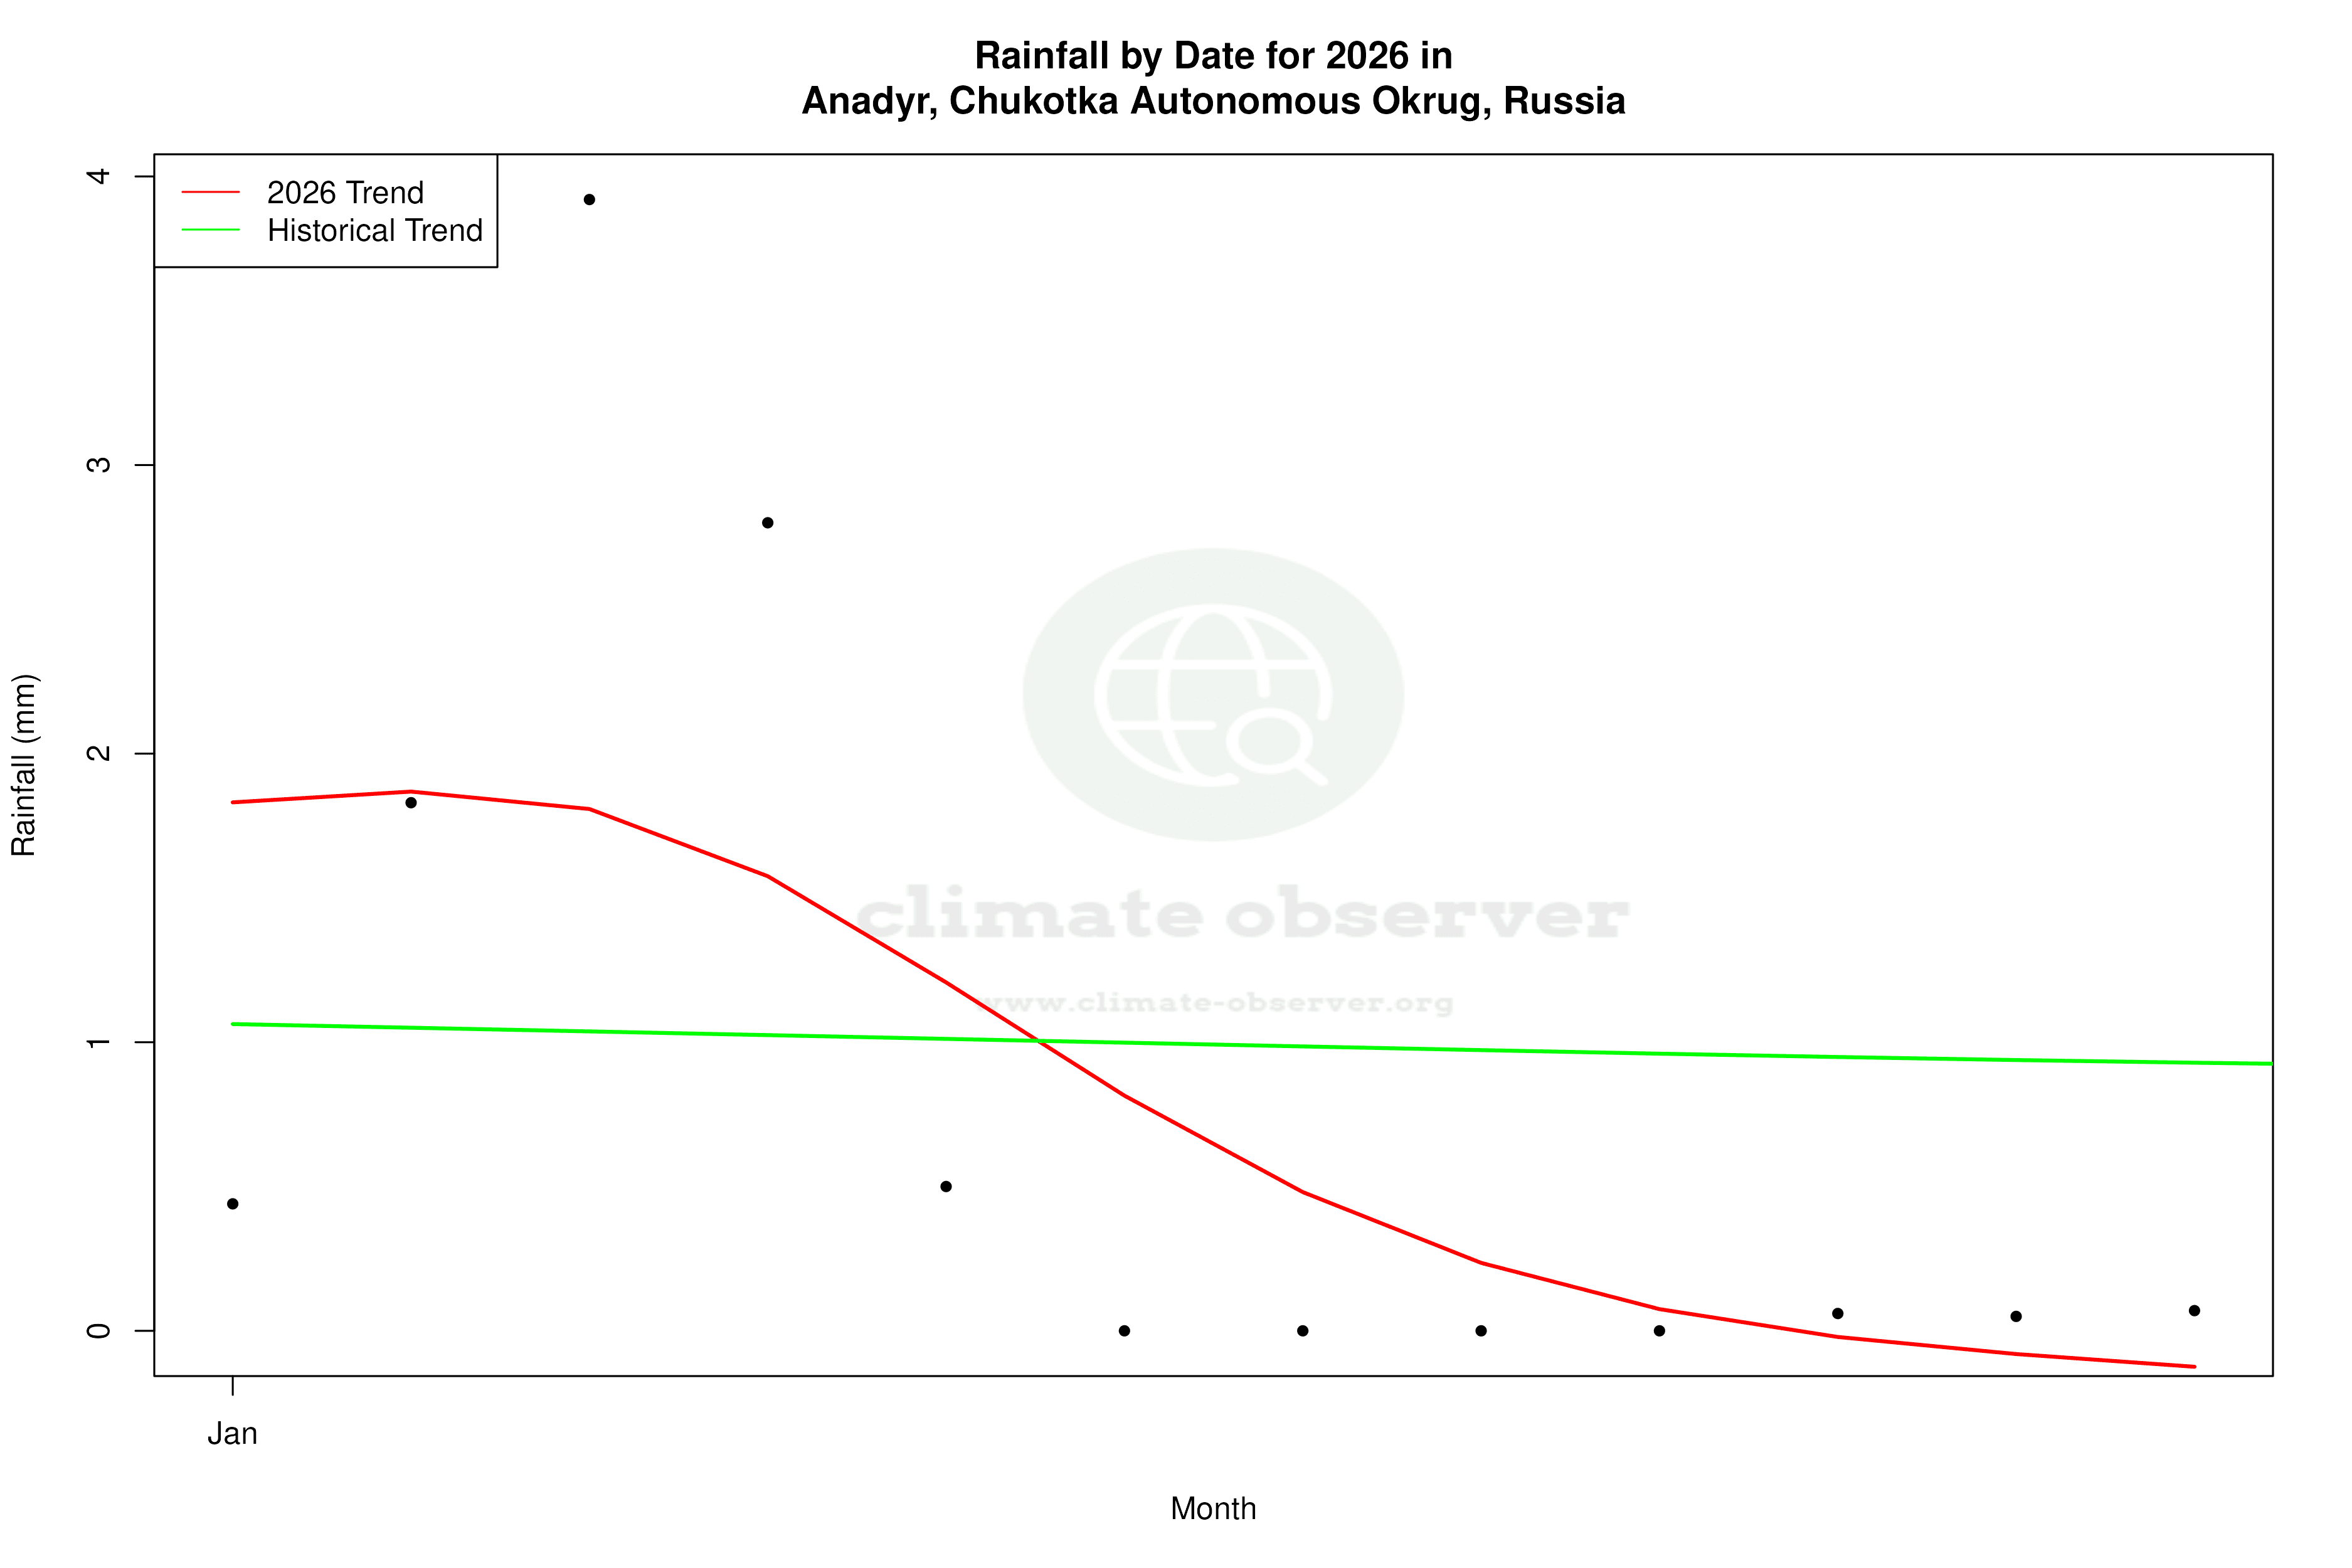
Precipitation Patterns: Increasing Concentration
The Precipitation Concentration Index (PCI) for Anadyr has increased from a baseline of 11.88 to a current value of 13.53. This indicates that precipitation events have become more concentrated, occurring in fewer, but potentially more intense, episodes. While the change is not drastic, it suggests a shift towards less frequent but heavier rainfall or snowfall events. This pattern can have significant implications for local ecosystems and water management strategies.
Extreme Temperature Records
Anadyr's climate extremes offer insight into its variability. The recorded maximum temperature is 30.0°C (86.0°F), while the minimum plummets to -46.8°C (-52.2°F). These extremes underscore the region's capacity for significant temperature fluctuations, a common characteristic of tundra climates. Such variability can pose challenges for infrastructure and habitation, requiring adaptive measures to cope with potential temperature swings.
Implications for Regional Climate Goals
Russia's climate goals include managing the impacts of climate change, particularly in sensitive regions like Chukotka. The observed trends in Anadyr, with its recent cooling and increased precipitation concentration, highlight the need for adaptive strategies that address both warming and cooling scenarios. These insights are vital for informing policy decisions and ensuring the resilience of local communities in the face of evolving climate dynamics.
Station Statistics
10-Year Trend
High: -4.07 °F/decade
Low: -5.24 °F/decade
Rain: -0.002 in/decade
25-Year Trend
High: +1.00 °F/decade
Low: +0.39 °F/decade
Rain: -0.002 in/decade
50-Year Trend
High: +0.95 °F/decade
Low: +0.77 °F/decade
Rain: +0.000 in/decade
All-Time Trend
High: +0.45 °F/decade
Low: +0.41 °F/decade
Rain: +0.002 in/decade
Percentage Above-Average Days
Last 12 Months: 58.4%
This Year: 47.6%
Precipitation Concentration Index (PCI) ℹ️
Last 12 Months: 10.2
Historical Average: 12.5
Percentile Rank of Last 12 Months ℹ️
High: 79th percentile
Low: 73rd percentile
Rain: 59th percentile
Change in Variance ℹ️
High: -4.8%
Low: -7.6%
Intraday: +22.8%
Data Coverage
85.4%
First Year of Data
1930
Station Location
Historical Weather Records
| Max High | Avg High | Min High | Max Avg | Avg Avg | Min Avg | Max Low | Avg Low | Min Low | Max Precipitation | Avg Precipitation | Max Snow | Avg Snow | |
|---|---|---|---|---|---|---|---|---|---|---|---|---|---|
| Record | 86.00 °F | — | -45.58 °F | 75.74 °F | — | -48.28 °F | 66.74 °F | — | -52.24 °F | 1.81 in | — | — | — |
| January | 42.44 °F | 1.39 °F | -45.58 °F | 35.24 °F | -6.26 °F | -48.28 °F | 32.18 °F | -13.28 °F | -52.24 °F | 1.14 in | 0.04 in | — | — |
| February | 36.86 °F | -0.45 °F | -43.96 °F | 33.08 °F | -7.28 °F | -45.94 °F | 30.99 °F | -14.31 °F | -48.46 °F | 1.07 in | 0.03 in | — | — |
| March | 39.20 °F | 3.81 °F | -35.14 °F | 35.42 °F | -3.21 °F | -39.64 °F | 30.74 °F | -10.35 °F | -43.78 °F | 1.78 in | 0.03 in | — | — |
| April | 49.10 °F | 16.00 °F | -16.96 °F | 35.42 °F | 8.99 °F | -24.88 °F | 32.90 °F | 1.68 °F | -39.28 °F | 1.02 in | 0.02 in | — | — |
| May | 66.74 °F | 33.61 °F | -1.48 °F | 54.86 °F | 27.81 °F | -9.58 °F | 39.74 °F | 21.87 °F | -18.76 °F | 0.41 in | 0.01 in | — | — |
| June | 80.60 °F | 50.39 °F | 30.74 °F | 69.26 °F | 42.80 °F | 25.70 °F | 59.36 °F | 36.62 °F | 18.32 °F | 1.04 in | 0.02 in | — | — |
| July | 86.00 °F | 59.01 °F | 42.80 °F | 75.74 °F | 52.14 °F | 38.66 °F | 65.66 °F | 46.44 °F | 29.84 °F | 1.81 in | 0.05 in | — | — |
| August | 79.88 °F | 56.01 °F | 34.16 °F | 70.88 °F | 49.83 °F | 32.18 °F | 66.74 °F | 44.40 °F | 24.26 °F | 1.57 in | 0.06 in | — | — |
| September | 67.64 °F | 45.06 °F | 22.82 °F | 62.78 °F | 39.74 °F | 14.72 °F | 54.32 °F | 34.80 °F | 10.76 °F | 1.14 in | 0.04 in | — | — |
| October | 60.08 °F | 27.48 °F | -13.00 °F | 47.48 °F | 22.87 °F | -16.60 °F | 45.14 °F | 18.11 °F | -18.76 °F | 1.01 in | 0.03 in | — | — |
| November | 40.28 °F | 13.27 °F | -26.50 °F | 38.30 °F | 7.27 °F | -33.16 °F | 36.32 °F | 1.11 °F | -37.84 °F | 1.65 in | 0.03 in | — | — |
| December | 39.74 °F | 2.70 °F | -40.00 °F | 36.14 °F | -4.14 °F | -43.24 °F | 32.54 °F | -10.83 °F | -49.36 °F | 1.13 in | 0.03 in | — | — |
Data Visualisations
Remove WatermarksCurrent Year Climate Trends vs Historical
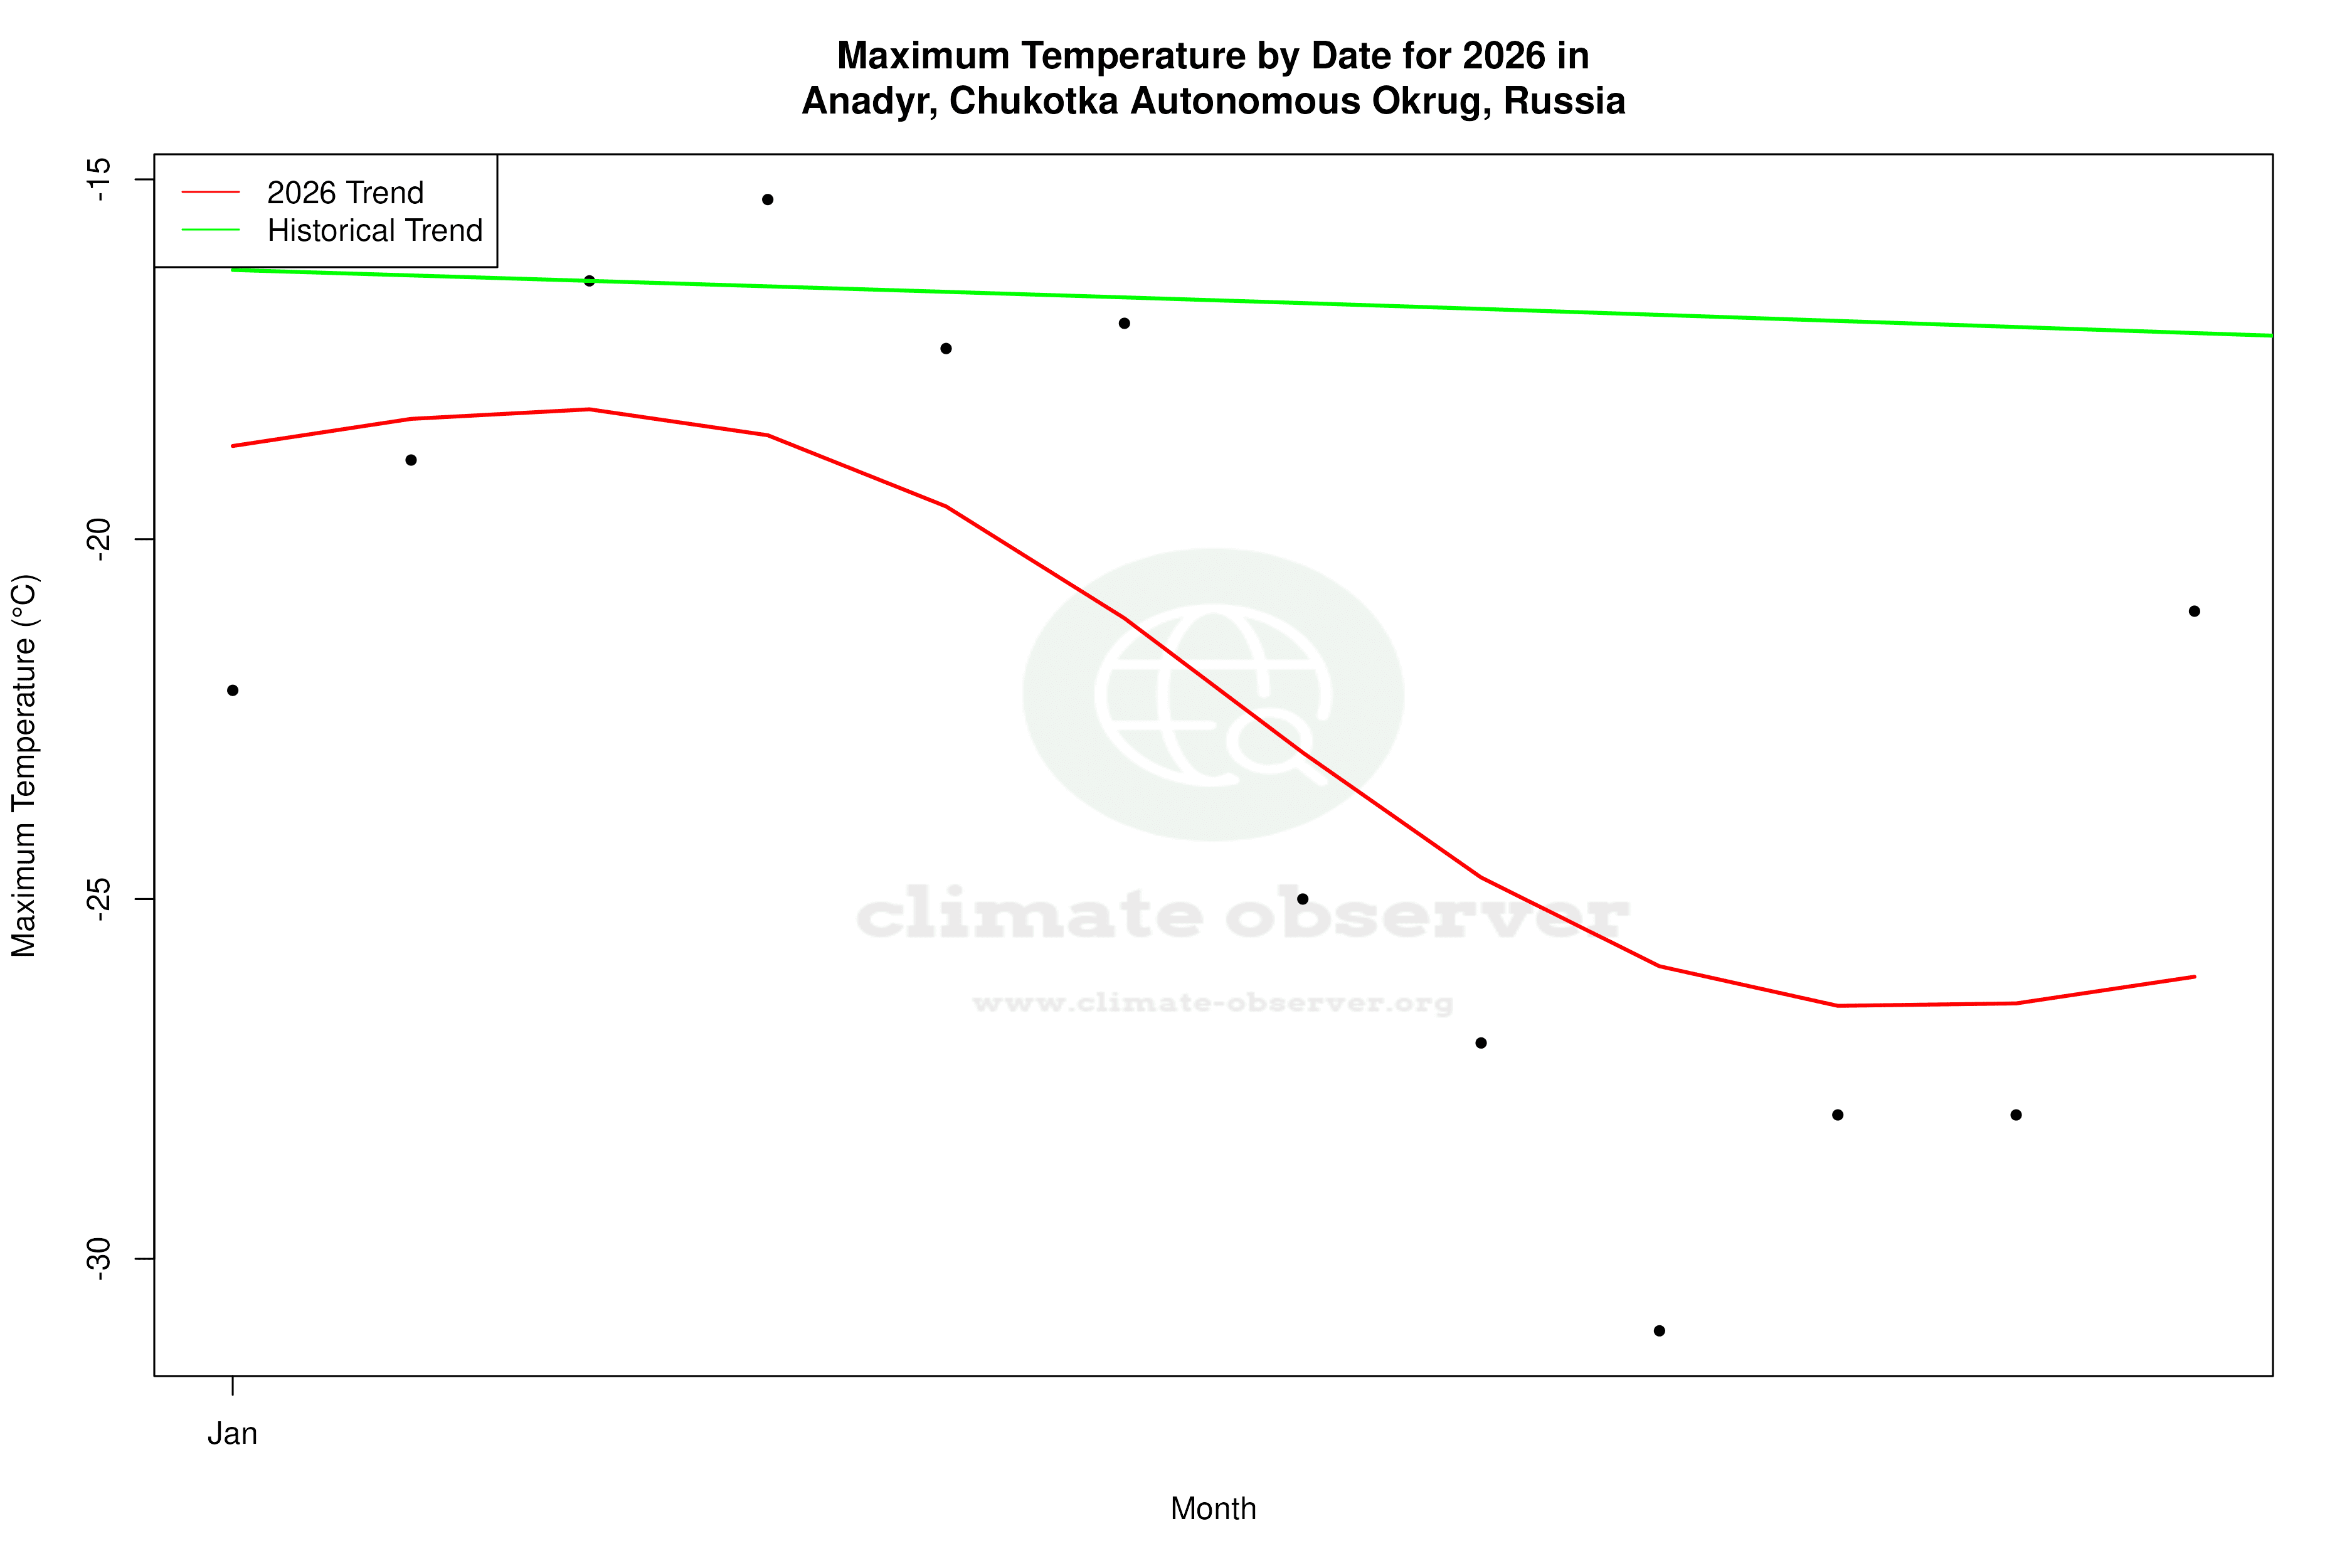


Max Temperature this Year | 1 of 6
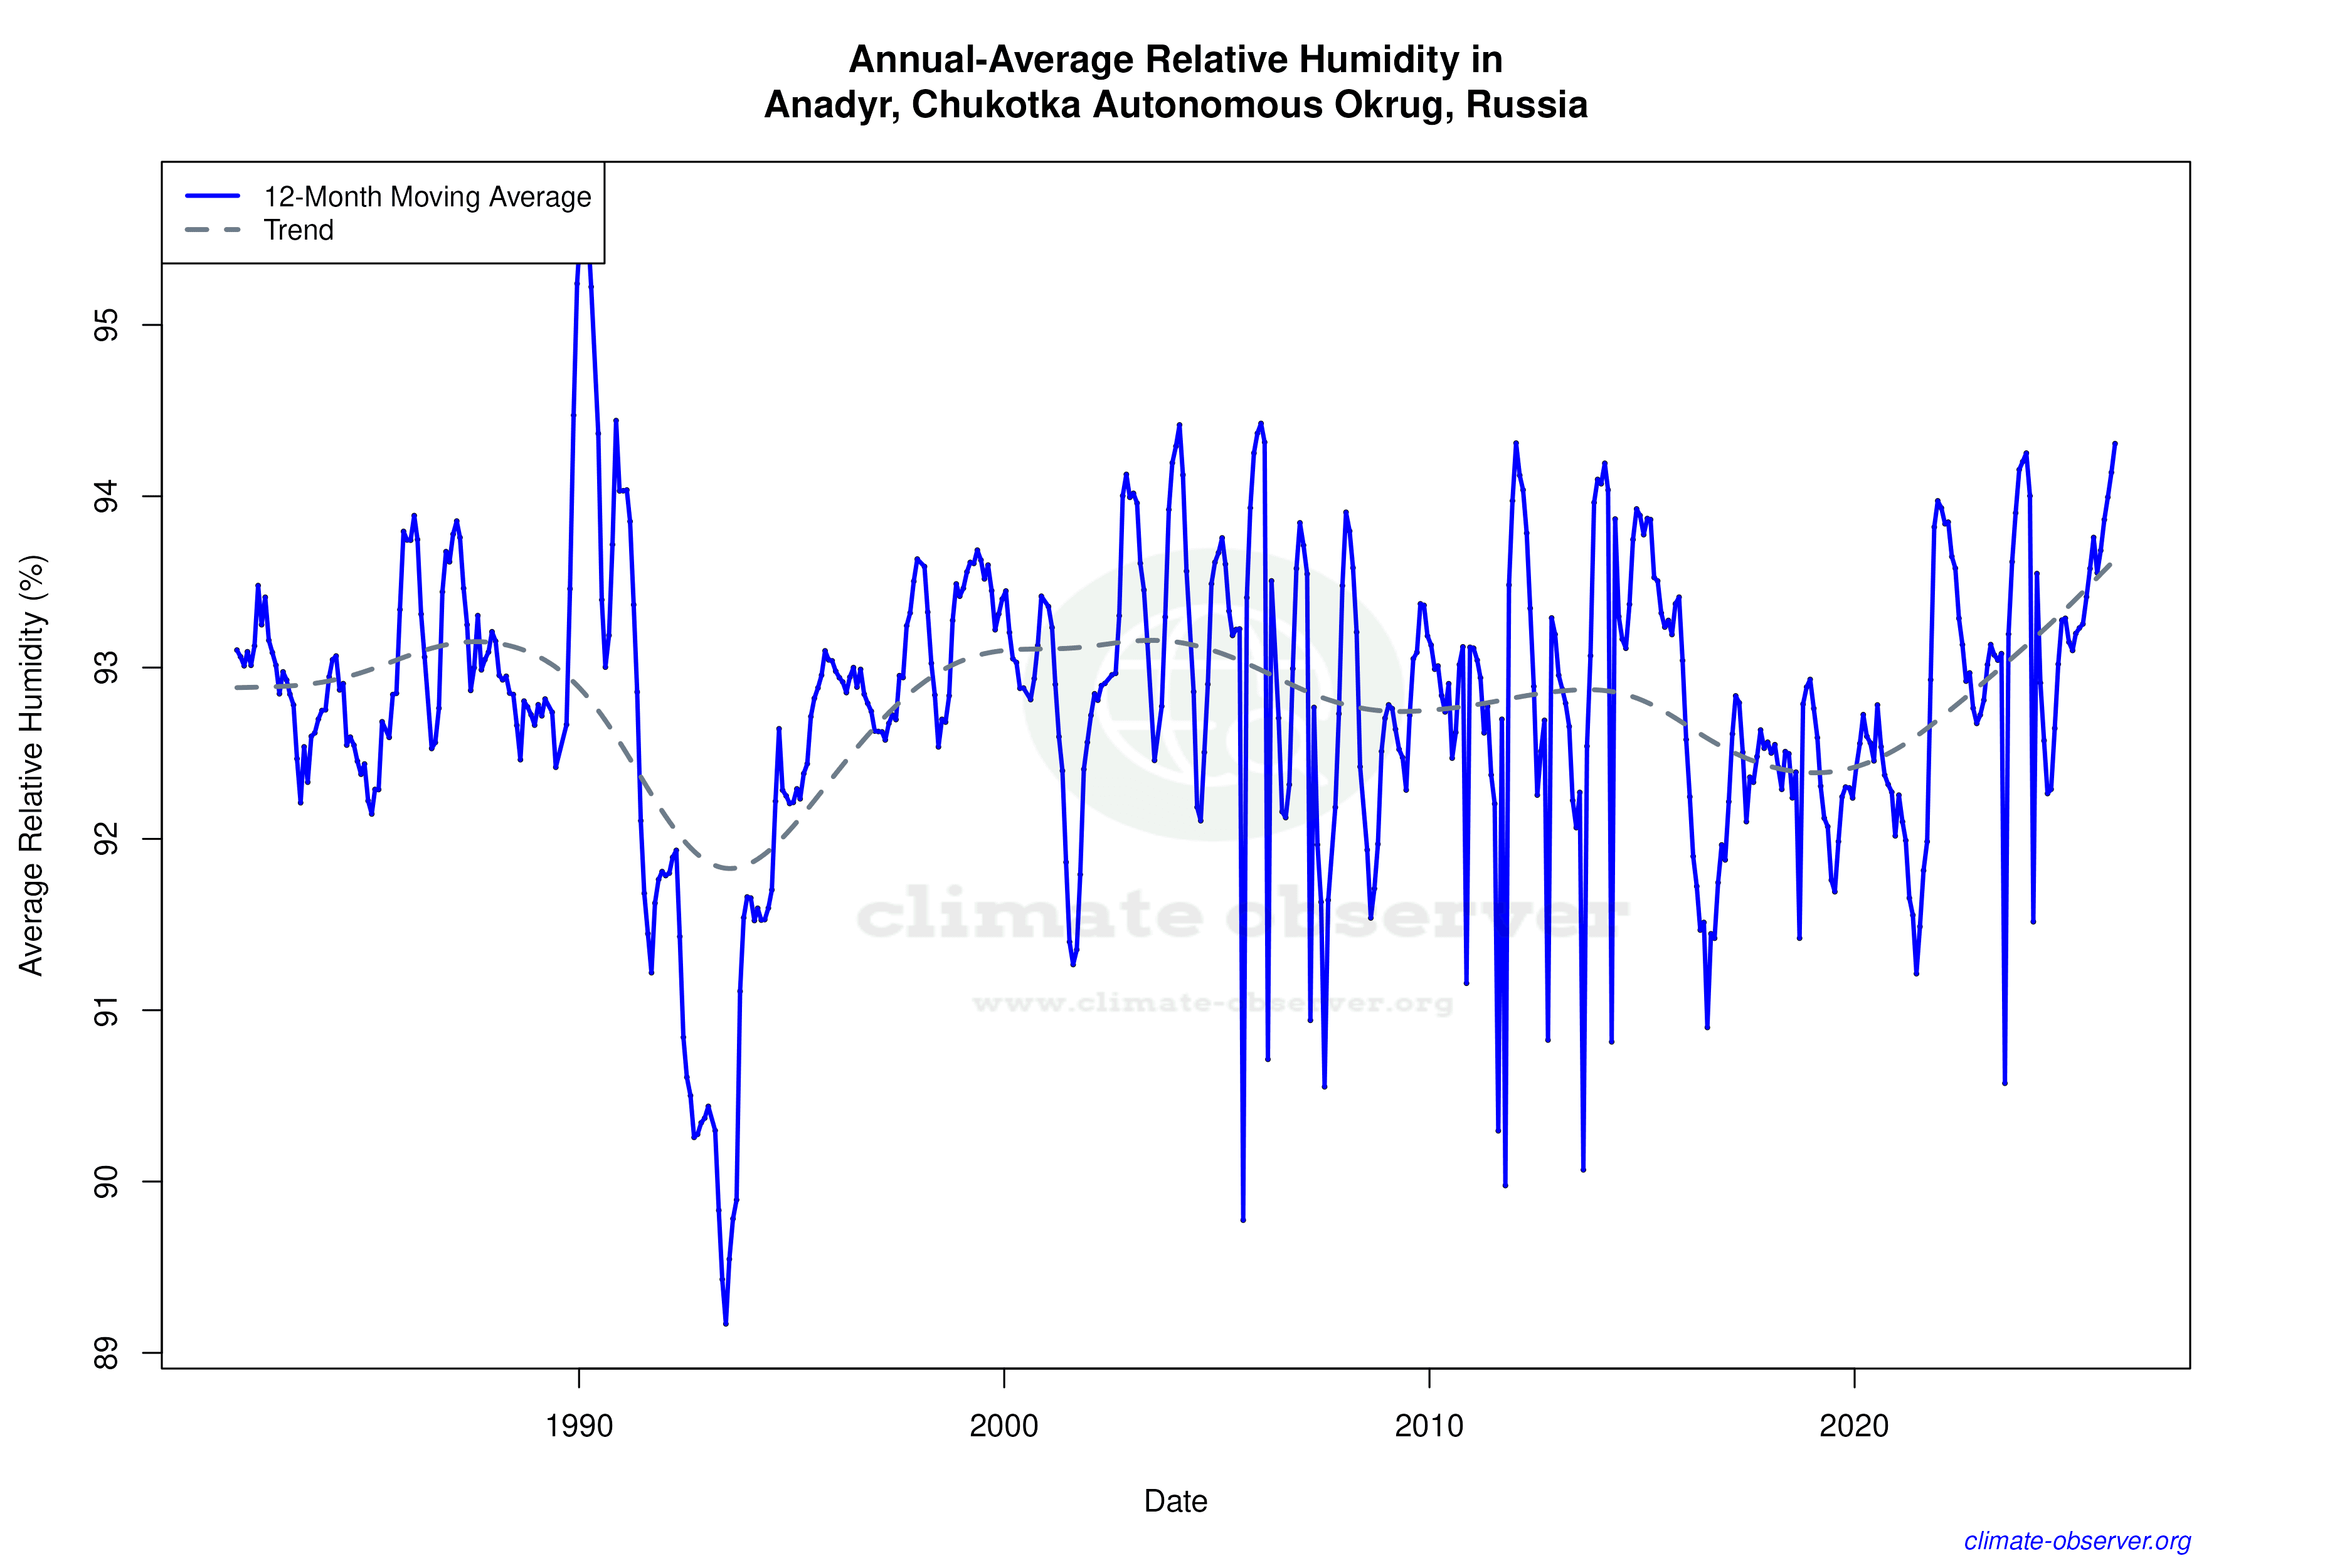
Climate 12-Month Moving Averages


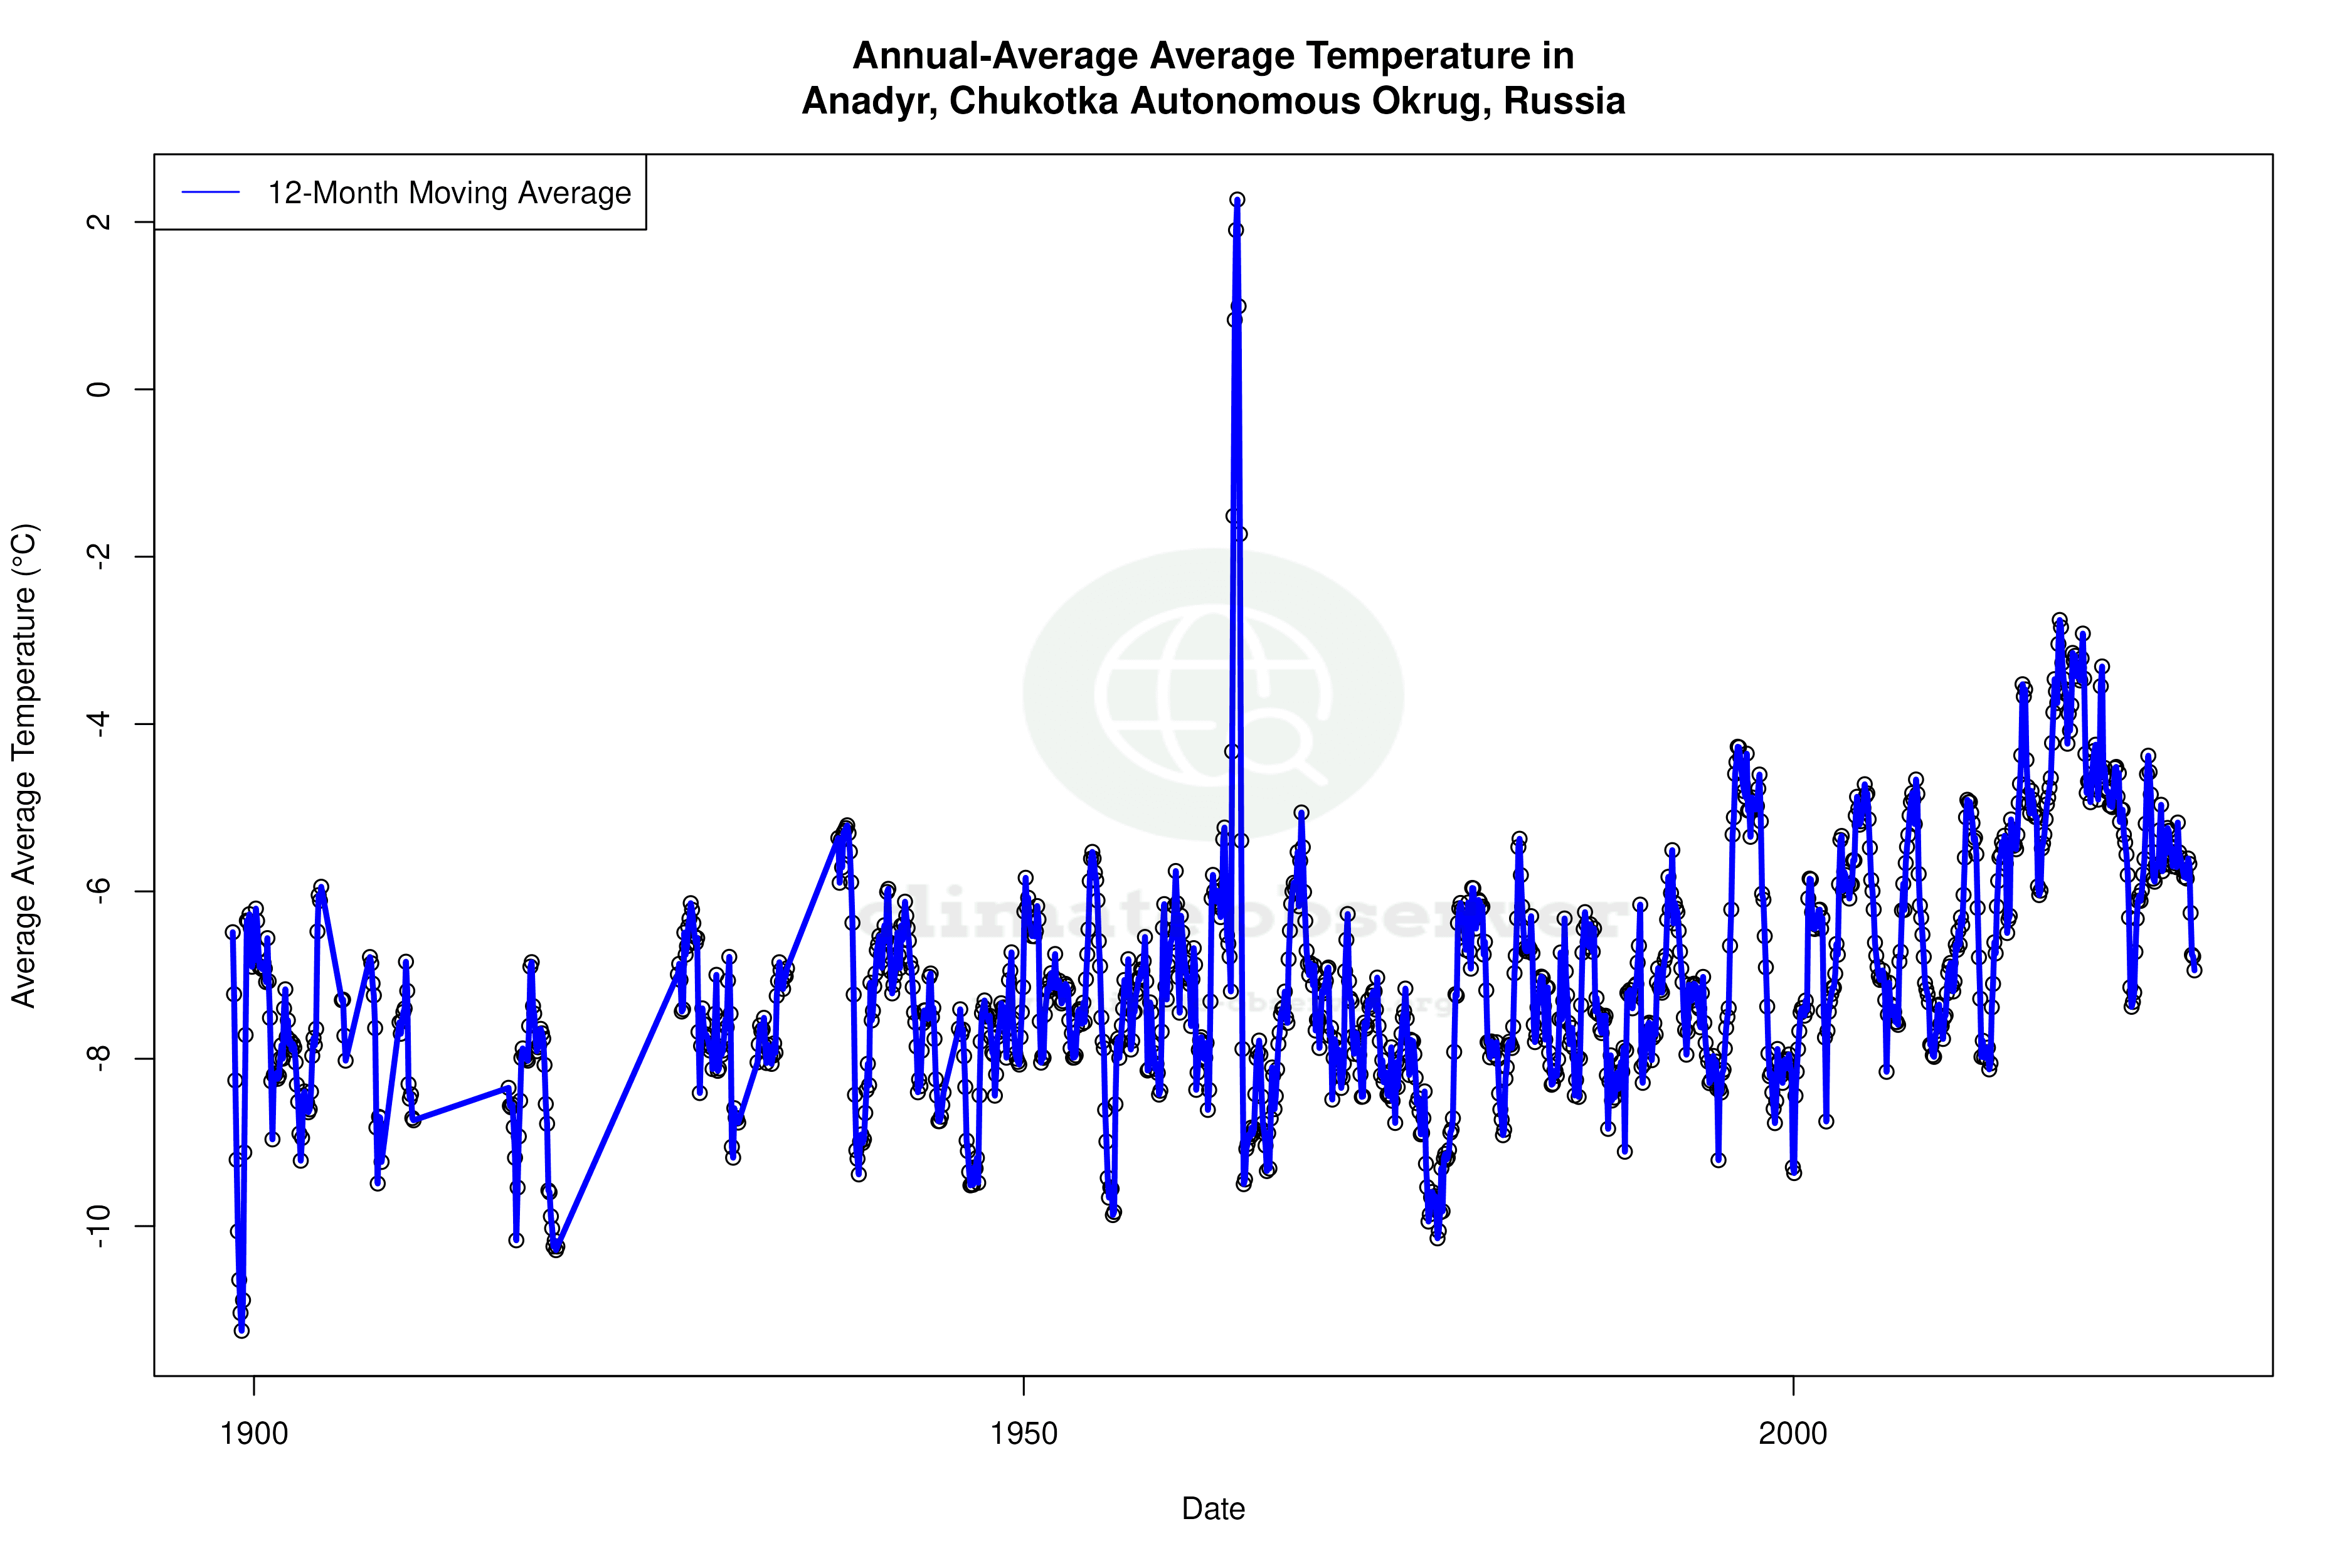


Max Temperature 12-Month MA | 1 of 6
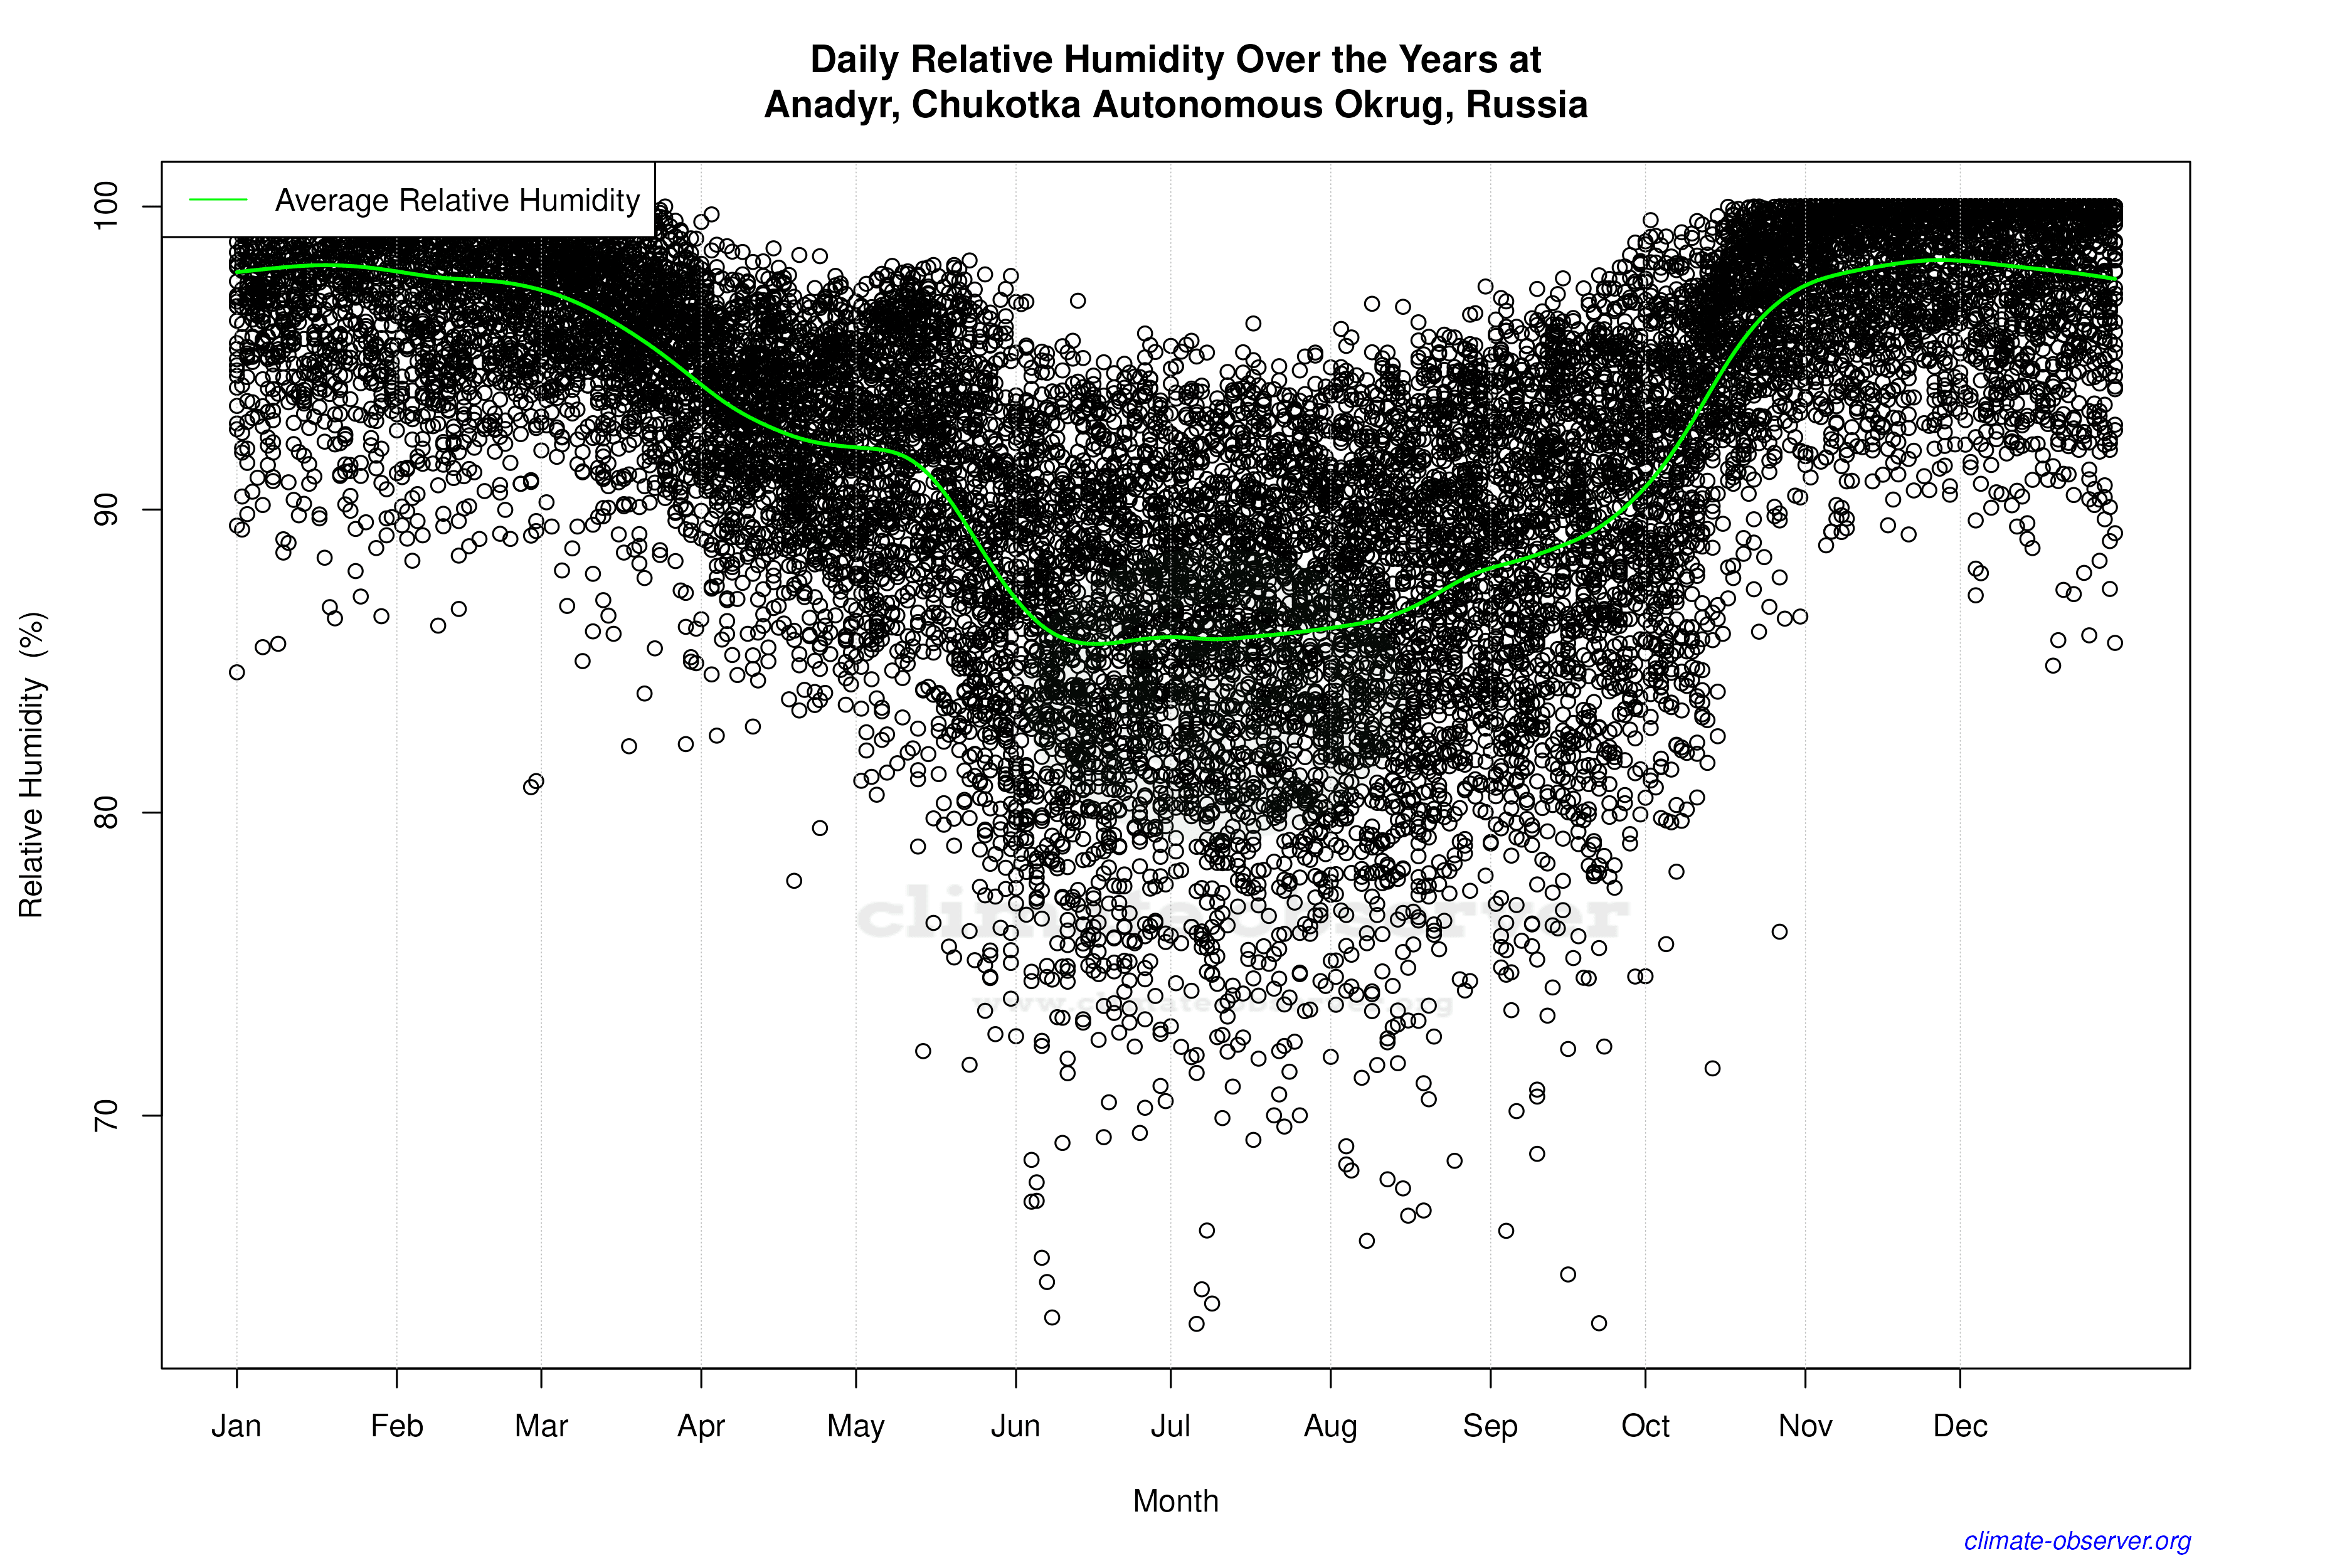
Daily Data Points and Averages Throughout the Year


Average Max Temperature Throughout Year | 1 of 5
