Climate for Station: St. Petersburg, Saint Petersburg, Russia
Loading live weather...
Climate Analysis & Overview
St. Petersburg's climate is experiencing a complex interplay of warming and cooling trends, with a notable rise in high temperatures over the past decade. Precipitation patterns are slightly more concentrated, indicating shifts in weather dynamics. These changes occur against the backdrop of Russia's climate goals, which aim to mitigate such variabilities.
Climatic Context and Geography
St. Petersburg, located at 59.97°N, 30.30°E, is classified under the Köppen climate classification as Dfb, indicating a humid continental climate with warm summers and cold winters. The city's proximity to the Baltic Sea influences its weather patterns, moderating temperatures but also contributing to high humidity levels. The Neva River and surrounding lakes further impact local microclimates, often leading to fog and increased precipitation.
Temperature Trends: A Dual Narrative
Over the last decade, St. Petersburg has experienced a warming trend in high temperatures, with an increase of 1.42°C (2.56°F). This contrasts with a cooling trend in low temperatures, which have decreased by 0.92°C (1.66°F). When considering all-time trends, both high and low temperatures show a slight warming, with highs rising by 0.20°C (0.36°F) and lows by 0.21°C (0.38°F). These trends suggest a complex thermal dynamic where daytime warming is more pronounced than nighttime cooling.
Precipitation Patterns: Concentration Shifts
The Precipitation Concentration Index (PCI) for St. Petersburg has seen a marginal increase from a baseline of 11.75 to a current value of 11.81. This suggests that precipitation events are becoming slightly more concentrated, occurring in fewer, more intense episodes. While these values do not indicate extreme concentration, they do point to a subtle shift in how precipitation is distributed throughout the year.
Record Extremes: The Temperature Spectrum
St. Petersburg's recorded temperature extremes highlight the city's climatic variability. The highest recorded temperature is 37.1°C (98.8°F), while the lowest plummets to -35.9°C (-32.6°F). These extremes underscore the broad thermal range experienced in the region, influenced by both natural and anthropogenic factors.
Regional Climate Goals and Implications
Russia's regional climate objectives aim to address such climatic shifts by promoting sustainable practices and reducing greenhouse gas emissions. St. Petersburg's climate data provides essential insights into the effectiveness of these policies and their impact on local weather patterns. Recent weather events, such as unexpected heatwaves or intense rainfall, serve as reminders of the need for adaptive strategies in urban planning and infrastructure development.
Station Statistics
10-Year Trend
High: +1.96 °F/decade
Low: -1.83 °F/decade
Rain: -0.019 in/decade
25-Year Trend
High: +0.64 °F/decade
Low: -0.08 °F/decade
Rain: -0.002 in/decade
50-Year Trend
High: +0.92 °F/decade
Low: +0.72 °F/decade
Rain: +0.001 in/decade
All-Time Trend
High: +0.34 °F/decade
Low: +0.37 °F/decade
Rain: +0.001 in/decade
Percentage Above-Average Days
Last 12 Months: 52.8%
This Year: 64.4%
Precipitation Concentration Index (PCI) ℹ️
Last 12 Months: 11.5
Historical Average: 11.0
Percentile Rank of Last 12 Months ℹ️
High: 86th percentile
Low: 78th percentile
Rain: 72nd percentile
Change in Variance ℹ️
High: -5.4%
Low: -18.6%
Intraday: +22.8%
Data Coverage
99.6%
First Year of Data
1881
Station Location
Historical Weather Records
| Max High | Avg High | Min High | Max Avg | Avg Avg | Min Avg | Max Low | Avg Low | Min Low | Max Precipitation | Avg Precipitation | Max Snow | Avg Snow | |
|---|---|---|---|---|---|---|---|---|---|---|---|---|---|
| Record | 98.78 °F | — | -25.60 °F | 86.18 °F | — | -28.48 °F | 77.00 °F | — | -32.62 °F | 2.98 in | — | — | — |
| January | 48.20 °F | 24.16 °F | -25.60 °F | 43.34 °F | 19.40 °F | -28.48 °F | 39.56 °F | 14.30 °F | -32.62 °F | 0.91 in | 0.05 in | — | — |
| February | 50.36 °F | 24.54 °F | -14.62 °F | 43.34 °F | 19.35 °F | -22.90 °F | 39.74 °F | 13.87 °F | -31.36 °F | 0.90 in | 0.04 in | — | — |
| March | 60.98 °F | 33.03 °F | -1.66 °F | 50.18 °F | 26.70 °F | -10.12 °F | 45.50 °F | 20.64 °F | -21.82 °F | 1.01 in | 0.04 in | — | — |
| April | 77.54 °F | 46.13 °F | 20.12 °F | 68.90 °F | 38.84 °F | 12.02 °F | 59.36 °F | 32.31 °F | 1.94 °F | 1.15 in | 0.04 in | — | — |
| May | 91.40 °F | 59.09 °F | 31.10 °F | 77.90 °F | 50.84 °F | 26.24 °F | 65.12 °F | 42.72 °F | 20.12 °F | 2.21 in | 0.06 in | — | — |
| June | 96.62 °F | 67.56 °F | 43.52 °F | 84.38 °F | 59.86 °F | 34.88 °F | 73.40 °F | 51.97 °F | 32.18 °F | 1.74 in | 0.08 in | — | — |
| July | 95.54 °F | 72.29 °F | 49.10 °F | 84.92 °F | 64.92 °F | 46.58 °F | 77.00 °F | 57.51 °F | 40.82 °F | 2.30 in | 0.09 in | — | — |
| August | 98.78 °F | 68.77 °F | 47.66 °F | 86.18 °F | 61.59 °F | 42.44 °F | 73.94 °F | 55.09 °F | 34.34 °F | 2.98 in | 0.10 in | — | — |
| September | 86.72 °F | 58.74 °F | 37.40 °F | 71.96 °F | 52.28 °F | 34.16 °F | 64.40 °F | 46.78 °F | 26.42 °F | 1.33 in | 0.08 in | — | — |
| October | 69.80 °F | 46.30 °F | 19.94 °F | 61.16 °F | 41.63 °F | 13.64 °F | 57.02 °F | 37.45 °F | 8.78 °F | 1.46 in | 0.07 in | — | — |
| November | 55.40 °F | 35.42 °F | 2.84 °F | 53.06 °F | 31.92 °F | -5.80 °F | 51.80 °F | 28.34 °F | -7.96 °F | 1.22 in | 0.06 in | — | — |
| December | 51.62 °F | 28.17 °F | -18.94 °F | 48.20 °F | 24.10 °F | -24.34 °F | 45.86 °F | 19.73 °F | -29.92 °F | 1.10 in | 0.05 in | — | — |
Data Visualisations
Remove WatermarksCurrent Year Climate Trends vs Historical


Max Temperature this Year | 1 of 6
Climate 12-Month Moving Averages


Max Temperature 12-Month MA | 1 of 6
Daily Data Points and Averages Throughout the Year


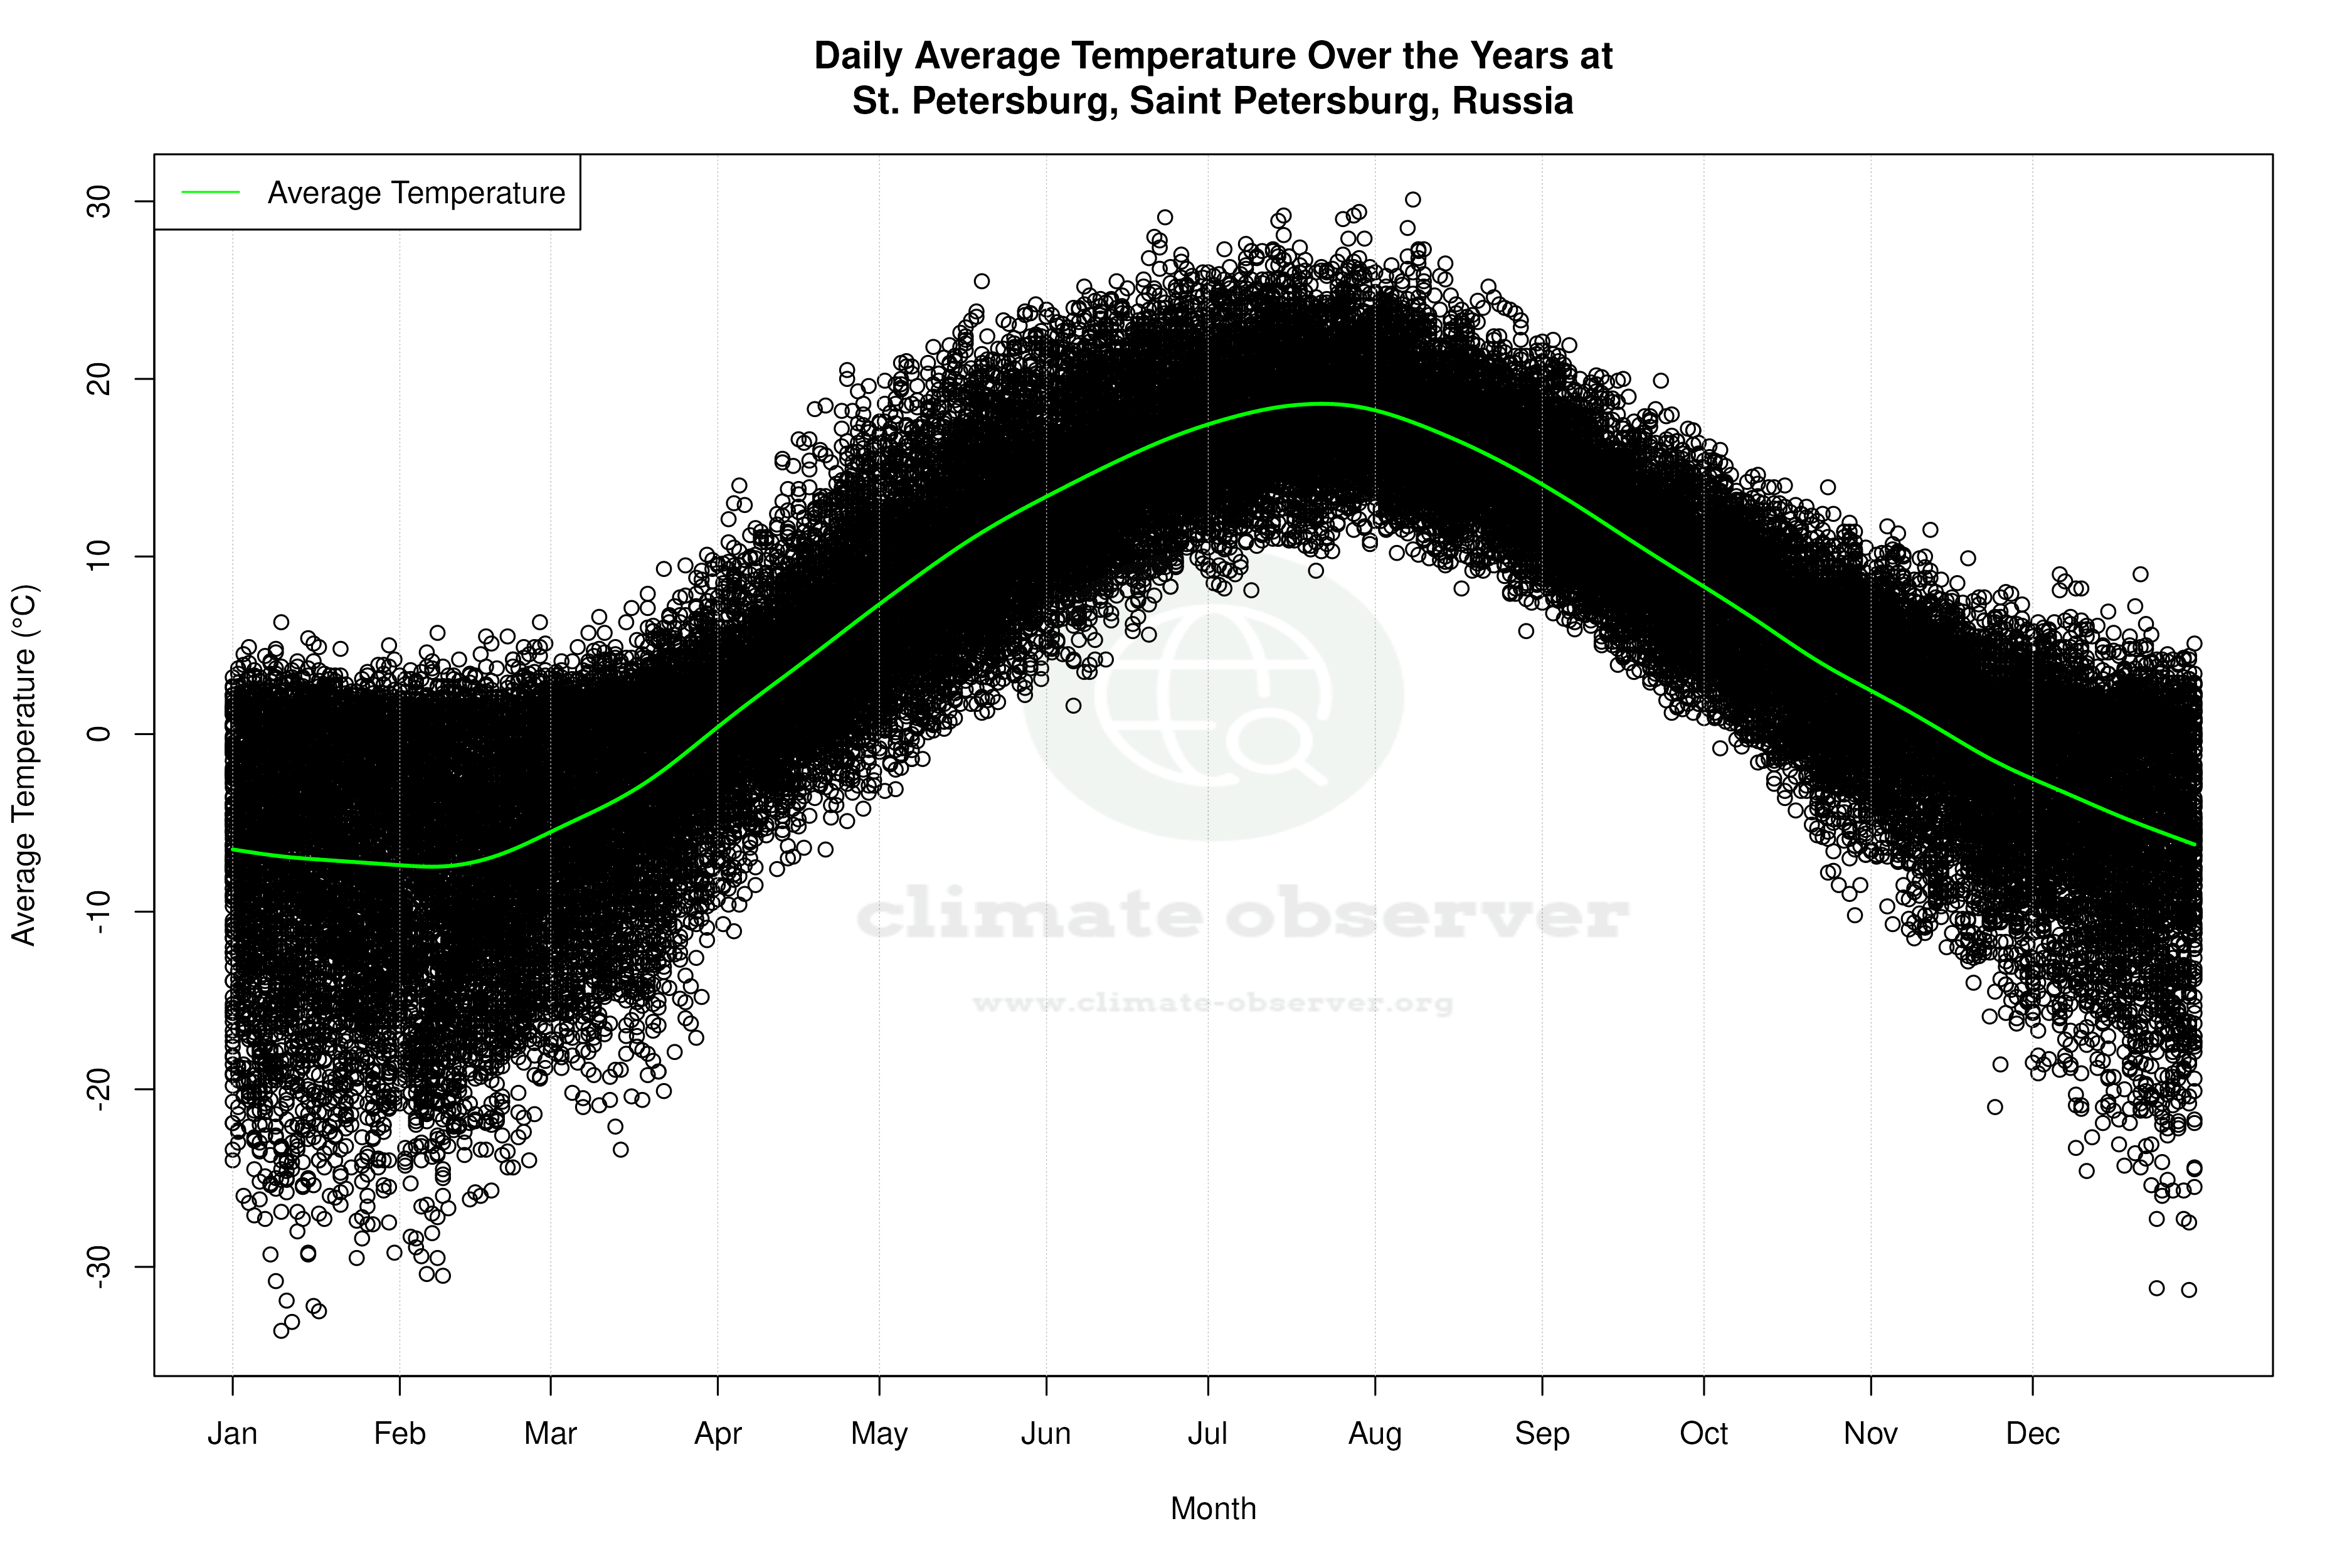


Average Max Temperature Throughout Year | 1 of 5
