Climate for Station: Kazan, Tatarstan, Russia
Loading live weather...
Climate Analysis & Overview
Kazan is experiencing a notable warming trend, with both high and low temperatures rising over the past decade. The city's precipitation is becoming more evenly distributed, suggesting a shift towards a more balanced climate pattern. These changes occur within the context of Russia's broader climate goals and recent weather events.
Kazan's Climatic Warming
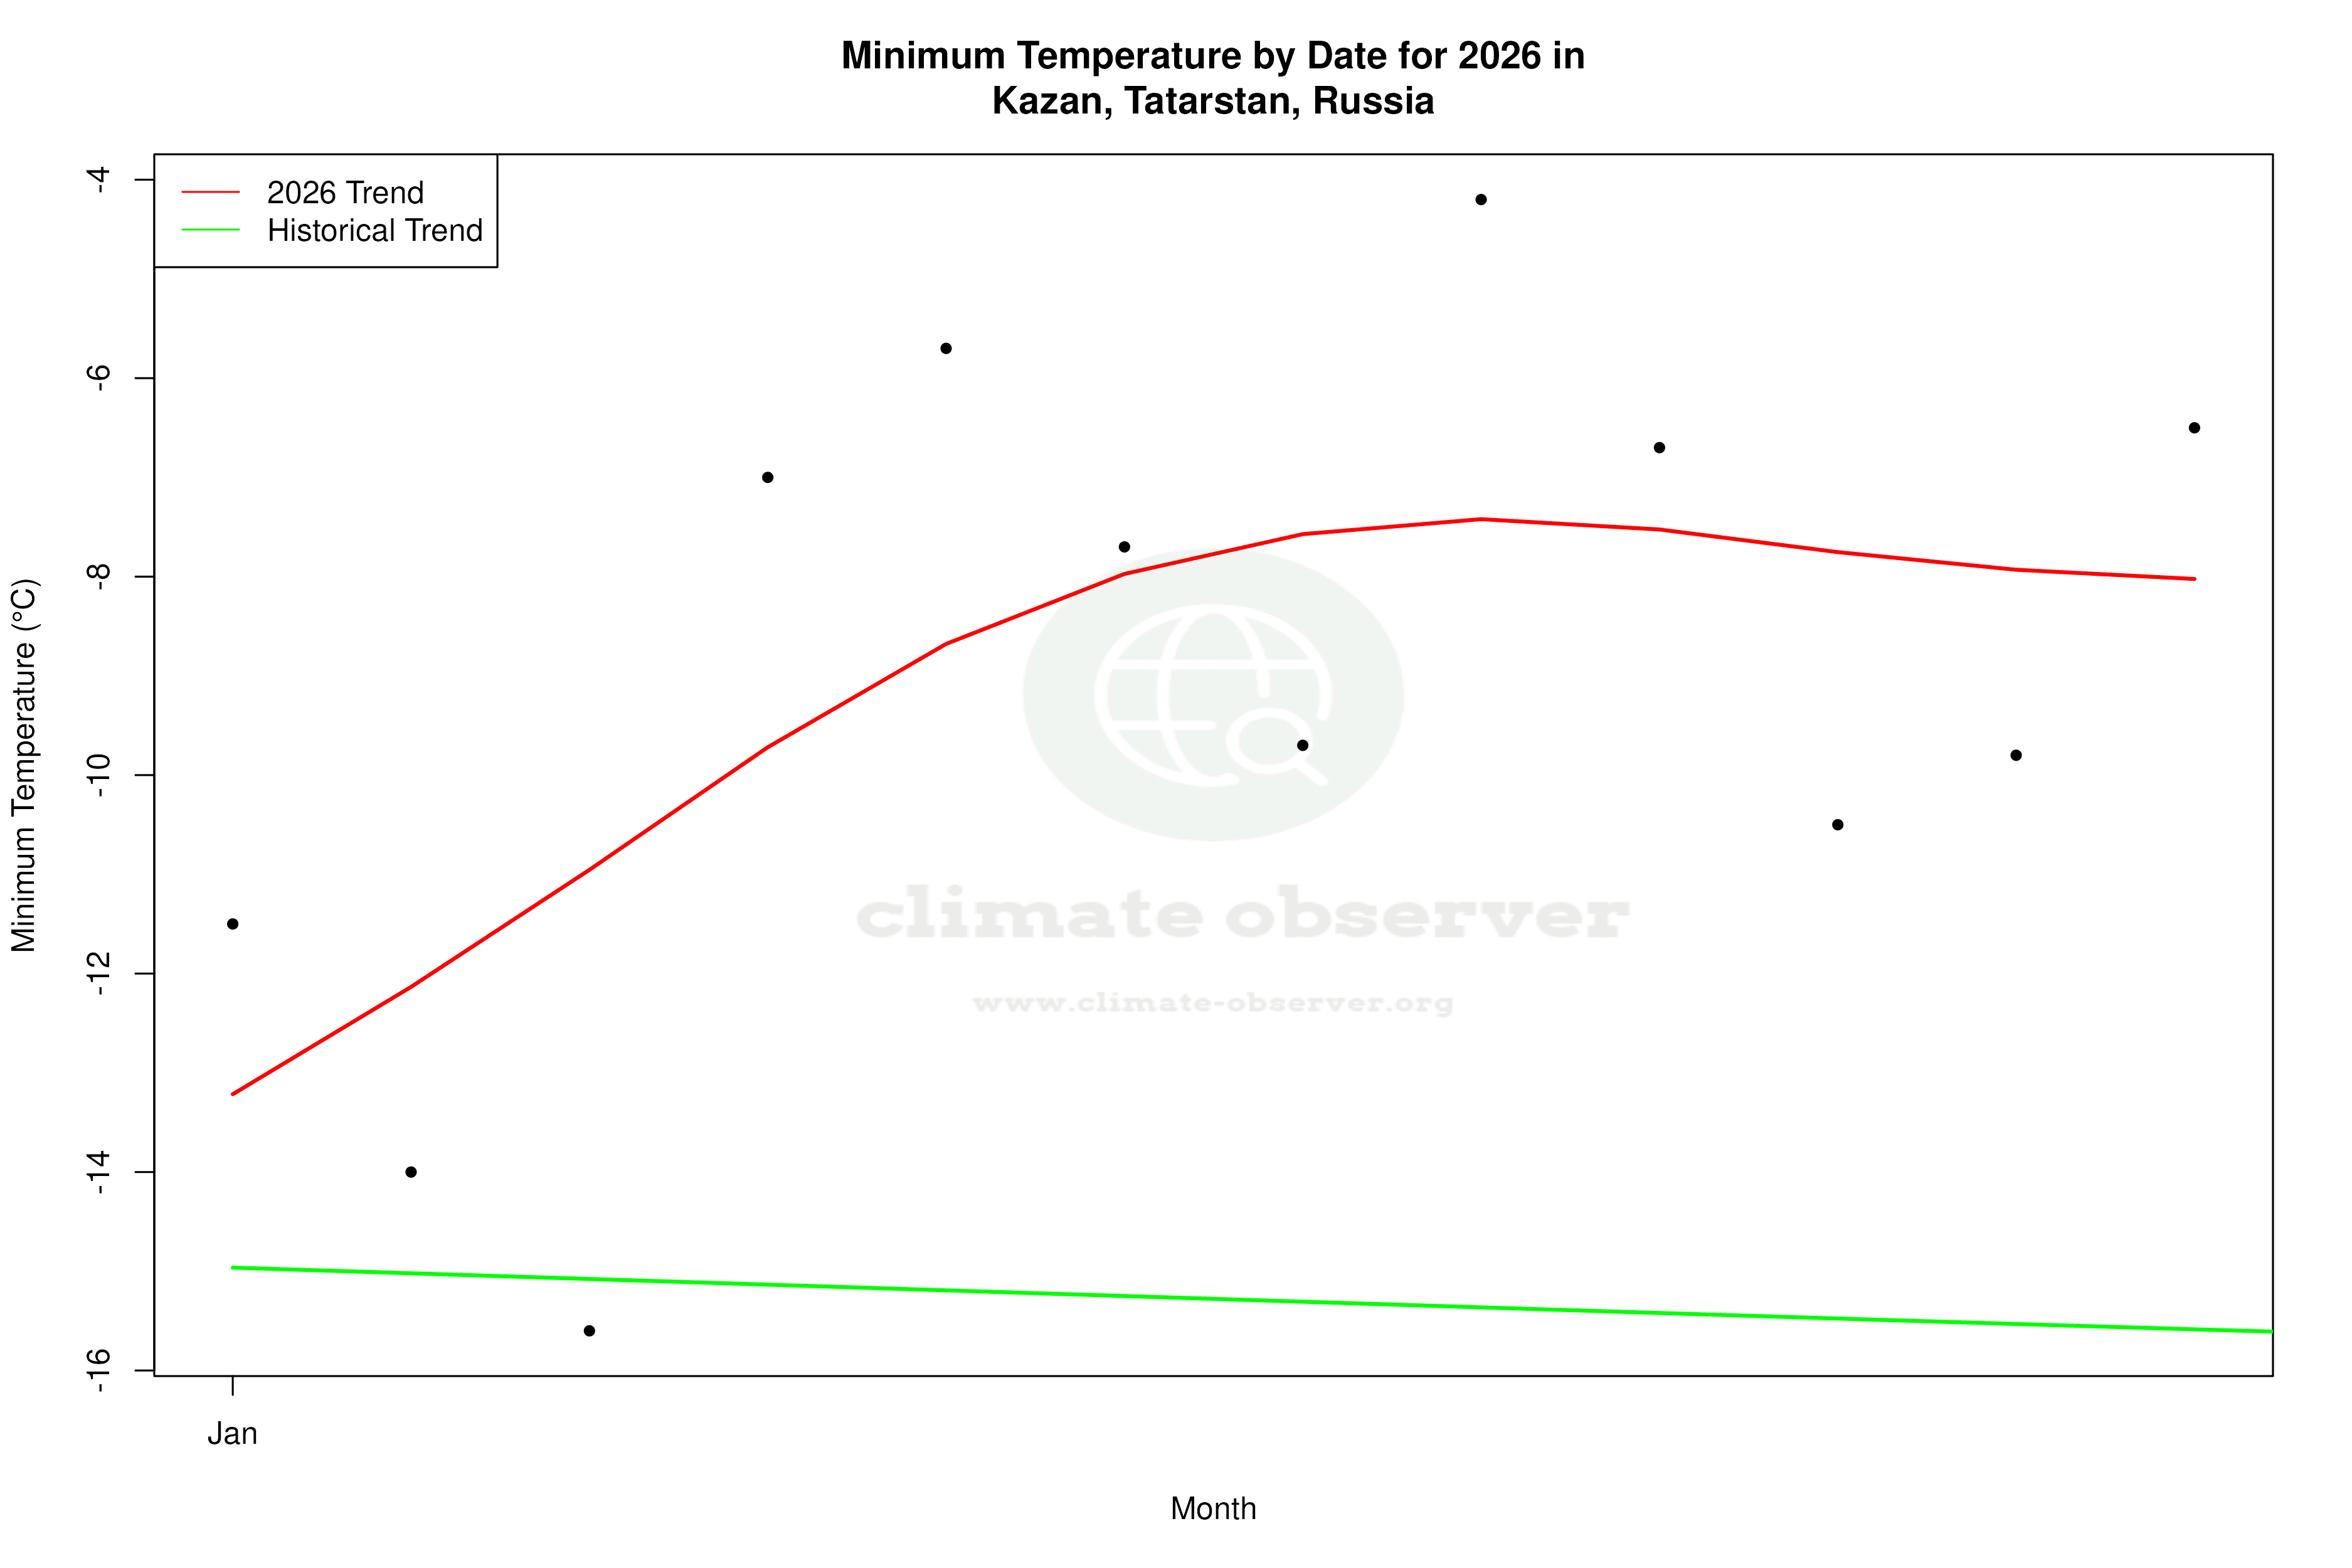
Kazan, situated at 55.7331°N, 49.2°E, experiences a humid continental climate, characterised by cold winters and warm summers. This climate classification is typical for the region, influenced by its distance from large bodies of water and the absence of significant mountain ranges. Over the past decade, Kazan has seen a warming trend, with average high temperatures increasing by 1.12°C (2.02°F) and lows by 1.32°C (2.37°F). This recent trend is more pronounced than the all-time warming, which shows a rise of 0.16°C (0.29°F) for highs and 0.27°C (0.48°F) for lows. These figures suggest a more rapid warming in recent years, aligning with global climate patterns.
Temperature Extremes and Records
The city's temperature records reveal the extremes that Kazan can experience. The highest recorded temperature is 39.0°C (102.2°F), while the lowest plummets to -46.8°C (-52.2°F). These extremes highlight the vast thermal range typical of continental climates. Despite the warming trends, such extremes remain a testament to the region's climatic variability.
Precipitation Patterns: A Shift Towards Balance
The Precipitation Concentration Index (PCI) for Kazan has decreased from a baseline of 11.24 to a current value of 9.83. The PCI measures how precipitation is distributed throughout the year, with lower values indicating more even distribution. This marginal decrease suggests that Kazan's precipitation is becoming more evenly spread across the seasons, which could lead to more predictable agricultural and water management conditions.
Regional Climate Context
Kazan's climatic changes are set against the backdrop of Russia's national climate objectives, which aim to mitigate the impacts of global warming. Recent weather events, such as unseasonably warm winters and intense summer heatwaves, underscore the importance of these goals. The city's warming trends and evolving precipitation patterns reflect broader shifts observed across the Russian Federation, as the nation adapts to a changing climate landscape.
Implications for the Future
The data from Kazan indicates a city in transition, with warming temperatures and more evenly distributed precipitation. These changes could have significant implications for local agriculture, infrastructure, and public health. As Kazan continues to adapt, understanding these climatic trends will be crucial for planning and resilience efforts.
Station Statistics
10-Year Trend
High: +0.83 °F/decade
Low: +1.61 °F/decade
Rain: -0.007 in/decade
25-Year Trend
High: +0.71 °F/decade
Low: +0.90 °F/decade
Rain: -0.000 in/decade
50-Year Trend
High: +1.12 °F/decade
Low: +1.38 °F/decade
Rain: +0.000 in/decade
All-Time Trend
High: +0.31 °F/decade
Low: +0.48 °F/decade
Rain: +0.002 in/decade
Percentage Above-Average Days
Last 12 Months: 52.5%
This Year: 44.3%
Precipitation Concentration Index (PCI) ℹ️
Last 12 Months: 10.7
Historical Average: 11.2
Percentile Rank of Last 12 Months ℹ️
High: 88th percentile
Low: 95th percentile
Rain: 81st percentile
Change in Variance ℹ️
High: -11.4%
Low: -14.0%
Intraday: -20.2%
Data Coverage
94.6%
First Year of Data
1881
Station Location
Historical Weather Records
| Max High | Avg High | Min High | Max Avg | Avg Avg | Min Avg | Max Low | Avg Low | Min Low | Max Precipitation | Avg Precipitation | Max Snow | Avg Snow | |
|---|---|---|---|---|---|---|---|---|---|---|---|---|---|
| Record | 102.20 °F | — | -37.48 °F | 89.78 °F | — | -43.60 °F | 78.62 °F | — | -52.24 °F | 4.75 in | — | — | — |
| January | 58.46 °F | 15.98 °F | -36.76 °F | 37.58 °F | 9.66 °F | -42.70 °F | 35.06 °F | 3.73 °F | -52.24 °F | 0.81 in | 0.04 in | — | — |
| February | 47.66 °F | 17.37 °F | -26.32 °F | 37.04 °F | 10.91 °F | -33.34 °F | 35.06 °F | 4.51 °F | -39.82 °F | 0.71 in | 0.03 in | — | — |
| March | 59.54 °F | 29.27 °F | -9.58 °F | 48.74 °F | 22.05 °F | -17.32 °F | 44.78 °F | 15.63 °F | -25.06 °F | 1.14 in | 0.03 in | — | — |
| April | 85.10 °F | 48.32 °F | 13.10 °F | 70.16 °F | 40.01 °F | -0.40 °F | 59.90 °F | 33.00 °F | -5.62 °F | 3.12 in | 0.04 in | — | — |
| May | 92.30 °F | 65.50 °F | 29.66 °F | 79.88 °F | 55.59 °F | 24.80 °F | 69.62 °F | 45.97 °F | 20.30 °F | 1.28 in | 0.05 in | — | — |
| June | 99.50 °F | 73.99 °F | 41.54 °F | 87.26 °F | 64.04 °F | 34.70 °F | 75.38 °F | 54.31 °F | 29.48 °F | 2.94 in | 0.08 in | — | — |
| July | 102.02 °F | 77.39 °F | 53.42 °F | 89.78 °F | 67.88 °F | 47.66 °F | 77.00 °F | 58.38 °F | 36.68 °F | 4.75 in | 0.08 in | — | — |
| August | 102.20 °F | 73.86 °F | 44.42 °F | 89.24 °F | 63.92 °F | 42.44 °F | 78.62 °F | 55.25 °F | 34.88 °F | 2.41 in | 0.07 in | — | — |
| September | 90.14 °F | 61.37 °F | 34.16 °F | 80.96 °F | 52.63 °F | 28.04 °F | 69.26 °F | 45.70 °F | 22.28 °F | 3.97 in | 0.06 in | — | — |
| October | 74.12 °F | 45.24 °F | 10.76 °F | 61.52 °F | 39.11 °F | -1.12 °F | 54.68 °F | 34.18 °F | -6.16 °F | 1.78 in | 0.06 in | — | — |
| November | 59.00 °F | 30.19 °F | -10.30 °F | 53.42 °F | 25.59 °F | -17.32 °F | 48.92 °F | 21.30 °F | -33.88 °F | 0.89 in | 0.05 in | — | — |
| December | 42.98 °F | 19.86 °F | -37.48 °F | 40.82 °F | 14.71 °F | -43.60 °F | 38.66 °F | 9.15 °F | -47.02 °F | 1.30 in | 0.04 in | — | — |
Data Visualisations
Remove WatermarksCurrent Year Climate Trends vs Historical


Max Temperature this Year | 1 of 6
Climate 12-Month Moving Averages


Max Temperature 12-Month MA | 1 of 6
Daily Data Points and Averages Throughout the Year


Average Max Temperature Throughout Year | 1 of 5
