Climate for Station: Moscow, Russia
Loading live weather...
Climate Analysis & Overview
Moscow is experiencing a warming trend, particularly in its nighttime temperatures, with a more even distribution of precipitation over the past decade. This aligns with Russia's broader climate goals of adapting to and mitigating climate change impacts.
Transitioning Thermal Landscape
Moscow, located at 55.8331°N, 37.6167°E, is classified under the humid continental climate (Dfb) in the Köppen system. This classification indicates cold winters and warm summers, influenced by its inland position far from moderating oceanic effects. Over the past decade, Moscow has seen a notable warming trend, with average high temperatures increasing by 0.89°C (1.60°F) and lows rising by a more pronounced 1.38°C (2.48°F). This recent warming is more substantial than the all-time trend, where highs have increased by 0.34°C (0.61°F) and lows by 0.43°C (0.77°F). The disparity between the 10-year and all-time trends suggests an acceleration in warming, particularly affecting nocturnal temperatures.
Precipitation Patterns: A Shift Towards Evenness
The Precipitation Concentration Index (PCI) is a measure of how rainfall is distributed throughout the year. Moscow's PCI has decreased from a baseline of 11.44 to a current value of 10.22, indicating a more even distribution of precipitation events. This slight decrease suggests that rainfall is less concentrated in intense downpours and more evenly spread across the year, which can be beneficial in reducing flood risks and improving water management.
Record Extremes and Regional Impacts
Moscow's climate extremes are marked by a record high of 38.2°C (100.8°F) and a record low of -38.1°C (-36.6°F). These records highlight the city's capacity for both severe heat and cold, typical of continental climates. Recent weather events, such as unusually warm winters, underscore the ongoing impact of climate change on the region. Russia's climate policy aims to address these changes by enhancing resilience and reducing greenhouse gas emissions, aligning with broader global efforts.
Geographical Influences on Climate
The geography of Moscow, situated away from the sea and surrounded by flat plains, contributes to its temperature extremes and precipitation patterns. This lack of geographical barriers allows cold Arctic air to penetrate in winter and warm air masses in summer, resulting in significant seasonal temperature variations. The city's position also means that precipitation is primarily influenced by cyclonic activity rather than orographic lift, contributing to the more evenly distributed rainfall observed in recent years.
Aligning with Climate Goals
Russia's commitment to addressing climate change is reflected in its national strategies, which include adapting infrastructure and improving energy efficiency. The observed trends in Moscow's climate data, such as the warming of nighttime temperatures and more evenly distributed precipitation, align with these goals by highlighting areas where adaptation measures can be most effectively targeted.
Station Statistics
10-Year Trend
High: +0.49 °F/decade
Low: +1.47 °F/decade
Rain: -0.013 in/decade
25-Year Trend
High: +0.90 °F/decade
Low: +1.53 °F/decade
Rain: +0.001 in/decade
50-Year Trend
High: +0.87 °F/decade
Low: +0.99 °F/decade
Rain: -0.000 in/decade
All-Time Trend
High: +0.53 °F/decade
Low: +0.72 °F/decade
Rain: +0.002 in/decade
Percentage Above-Average Days
Last 12 Months: 50.3%
This Year: 57.7%
Precipitation Concentration Index (PCI) ℹ️
Last 12 Months: 10.2
Historical Average: 11.0
Percentile Rank of Last 12 Months ℹ️
High: 88th percentile
Low: 96th percentile
Rain: 61st percentile
Change in Variance ℹ️
High: -8.4%
Low: -18.5%
Intraday: -5.9%
Data Coverage
87.7%
First Year of Data
1936
Station Location
Historical Weather Records
| Max High | Avg High | Min High | Max Avg | Avg Avg | Min Avg | Max Low | Avg Low | Min Low | Max Precipitation | Avg Precipitation | Max Snow | Avg Snow | |
|---|---|---|---|---|---|---|---|---|---|---|---|---|---|
| Record | 100.76 °F | — | -26.14 °F | 87.44 °F | — | -31.00 °F | 78.80 °F | — | -36.58 °F | 2.55 in | — | — | — |
| January | 47.48 °F | 22.72 °F | -26.14 °F | 44.78 °F | 17.95 °F | -31.00 °F | 40.28 °F | 13.02 °F | -36.58 °F | 0.83 in | 0.06 in | — | — |
| February | 57.02 °F | 24.93 °F | -18.40 °F | 41.72 °F | 19.23 °F | -24.52 °F | 38.84 °F | 13.55 °F | -31.36 °F | 1.40 in | 0.05 in | — | — |
| March | 67.46 °F | 35.75 °F | 5.18 °F | 53.96 °F | 29.00 °F | -2.92 °F | 45.32 °F | 22.60 °F | -18.22 °F | 1.01 in | 0.05 in | — | — |
| April | 84.02 °F | 51.77 °F | 21.02 °F | 70.88 °F | 43.36 °F | 13.64 °F | 59.90 °F | 35.53 °F | -1.84 °F | 1.20 in | 0.05 in | — | — |
| May | 91.76 °F | 65.04 °F | 36.68 °F | 80.60 °F | 55.46 °F | 33.08 °F | 68.72 °F | 45.81 °F | 23.00 °F | 2.34 in | 0.07 in | — | — |
| June | 95.00 °F | 71.93 °F | 43.34 °F | 83.84 °F | 62.89 °F | 40.46 °F | 71.96 °F | 53.53 °F | 33.44 °F | 2.55 in | 0.10 in | — | — |
| July | 100.76 °F | 75.08 °F | 50.72 °F | 87.44 °F | 66.05 °F | 46.94 °F | 78.80 °F | 57.47 °F | 41.18 °F | 2.42 in | 0.11 in | — | — |
| August | 99.14 °F | 71.86 °F | 46.04 °F | 86.36 °F | 62.81 °F | 43.16 °F | 75.92 °F | 54.65 °F | 35.78 °F | 2.30 in | 0.10 in | — | — |
| September | 84.92 °F | 60.75 °F | 36.14 °F | 74.12 °F | 52.60 °F | 31.46 °F | 66.20 °F | 45.69 °F | 22.64 °F | 1.92 in | 0.08 in | — | — |
| October | 74.66 °F | 47.33 °F | 17.06 °F | 64.94 °F | 41.68 °F | 14.72 °F | 58.46 °F | 36.72 °F | 3.02 °F | 1.59 in | 0.08 in | — | — |
| November | 61.16 °F | 34.27 °F | 3.02 °F | 56.84 °F | 30.37 °F | -2.92 °F | 50.00 °F | 26.60 °F | -9.94 °F | 1.16 in | 0.07 in | — | — |
| December | 49.28 °F | 26.68 °F | -22.54 °F | 47.12 °F | 22.68 °F | -30.64 °F | 45.86 °F | 18.43 °F | -36.40 °F | 0.91 in | 0.07 in | — | — |
Data Visualisations
Remove WatermarksCurrent Year Climate Trends vs Historical


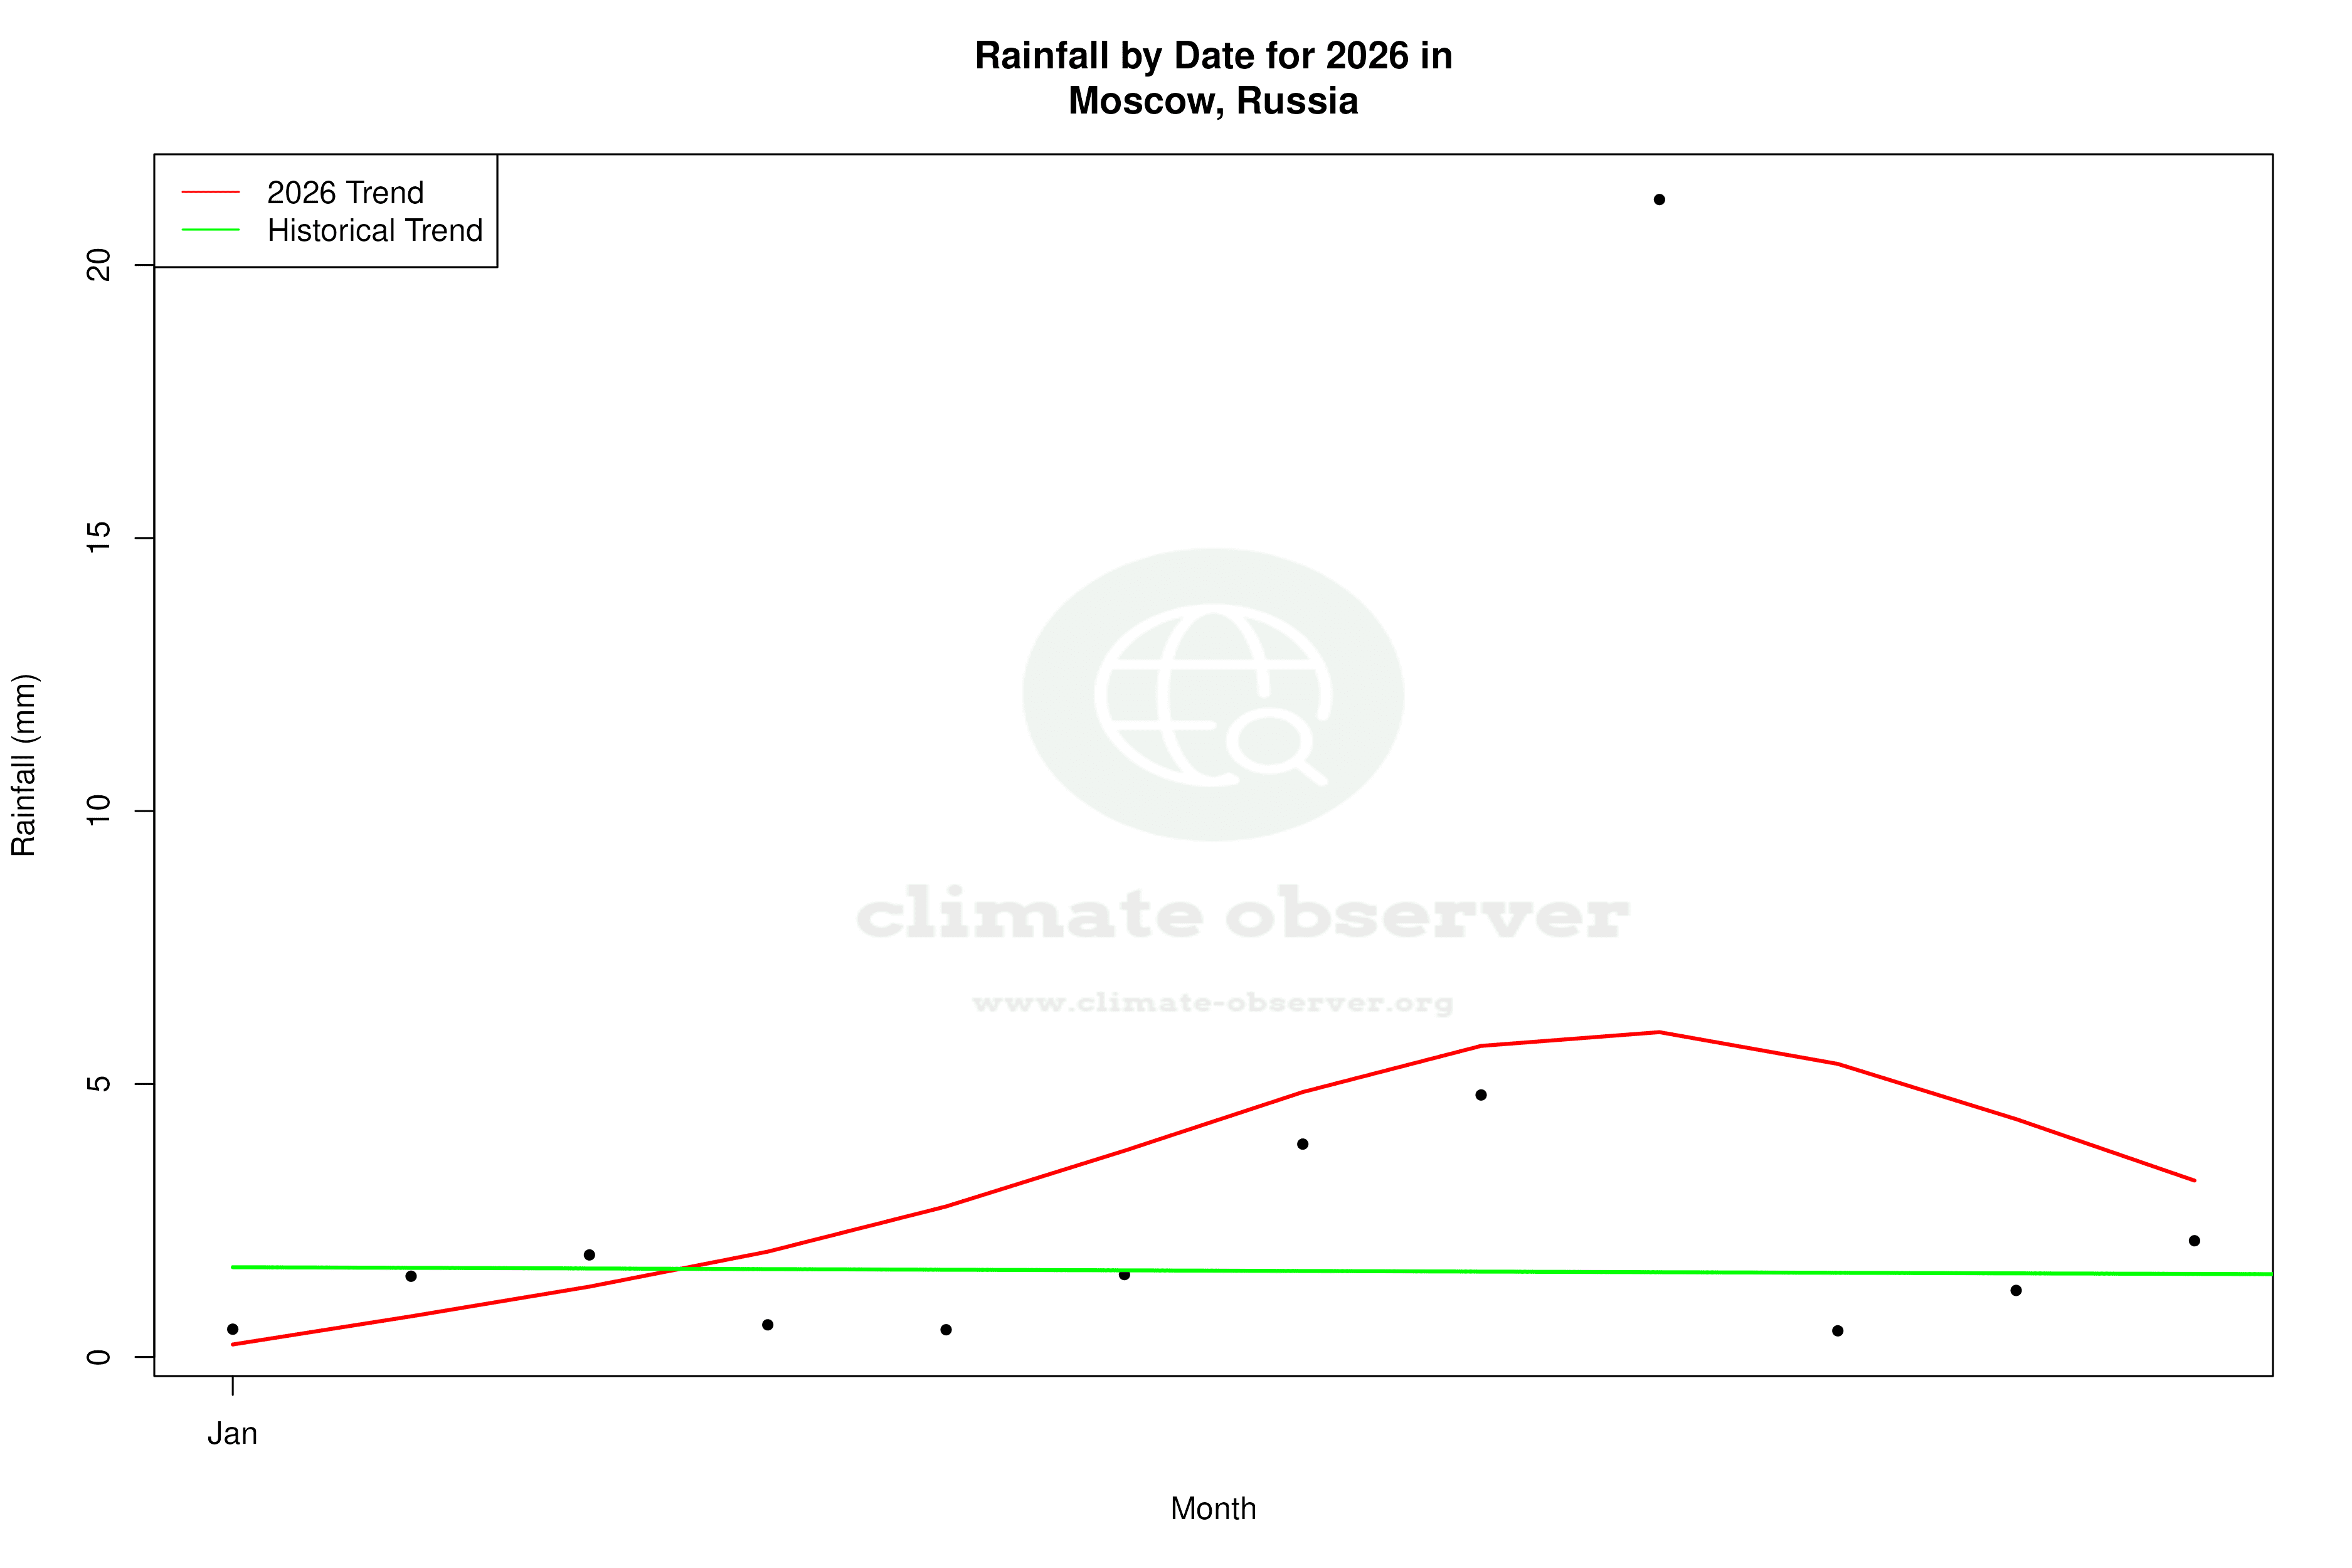


Max Temperature this Year | 1 of 6
Climate 12-Month Moving Averages


Max Temperature 12-Month MA | 1 of 6
Daily Data Points and Averages Throughout the Year


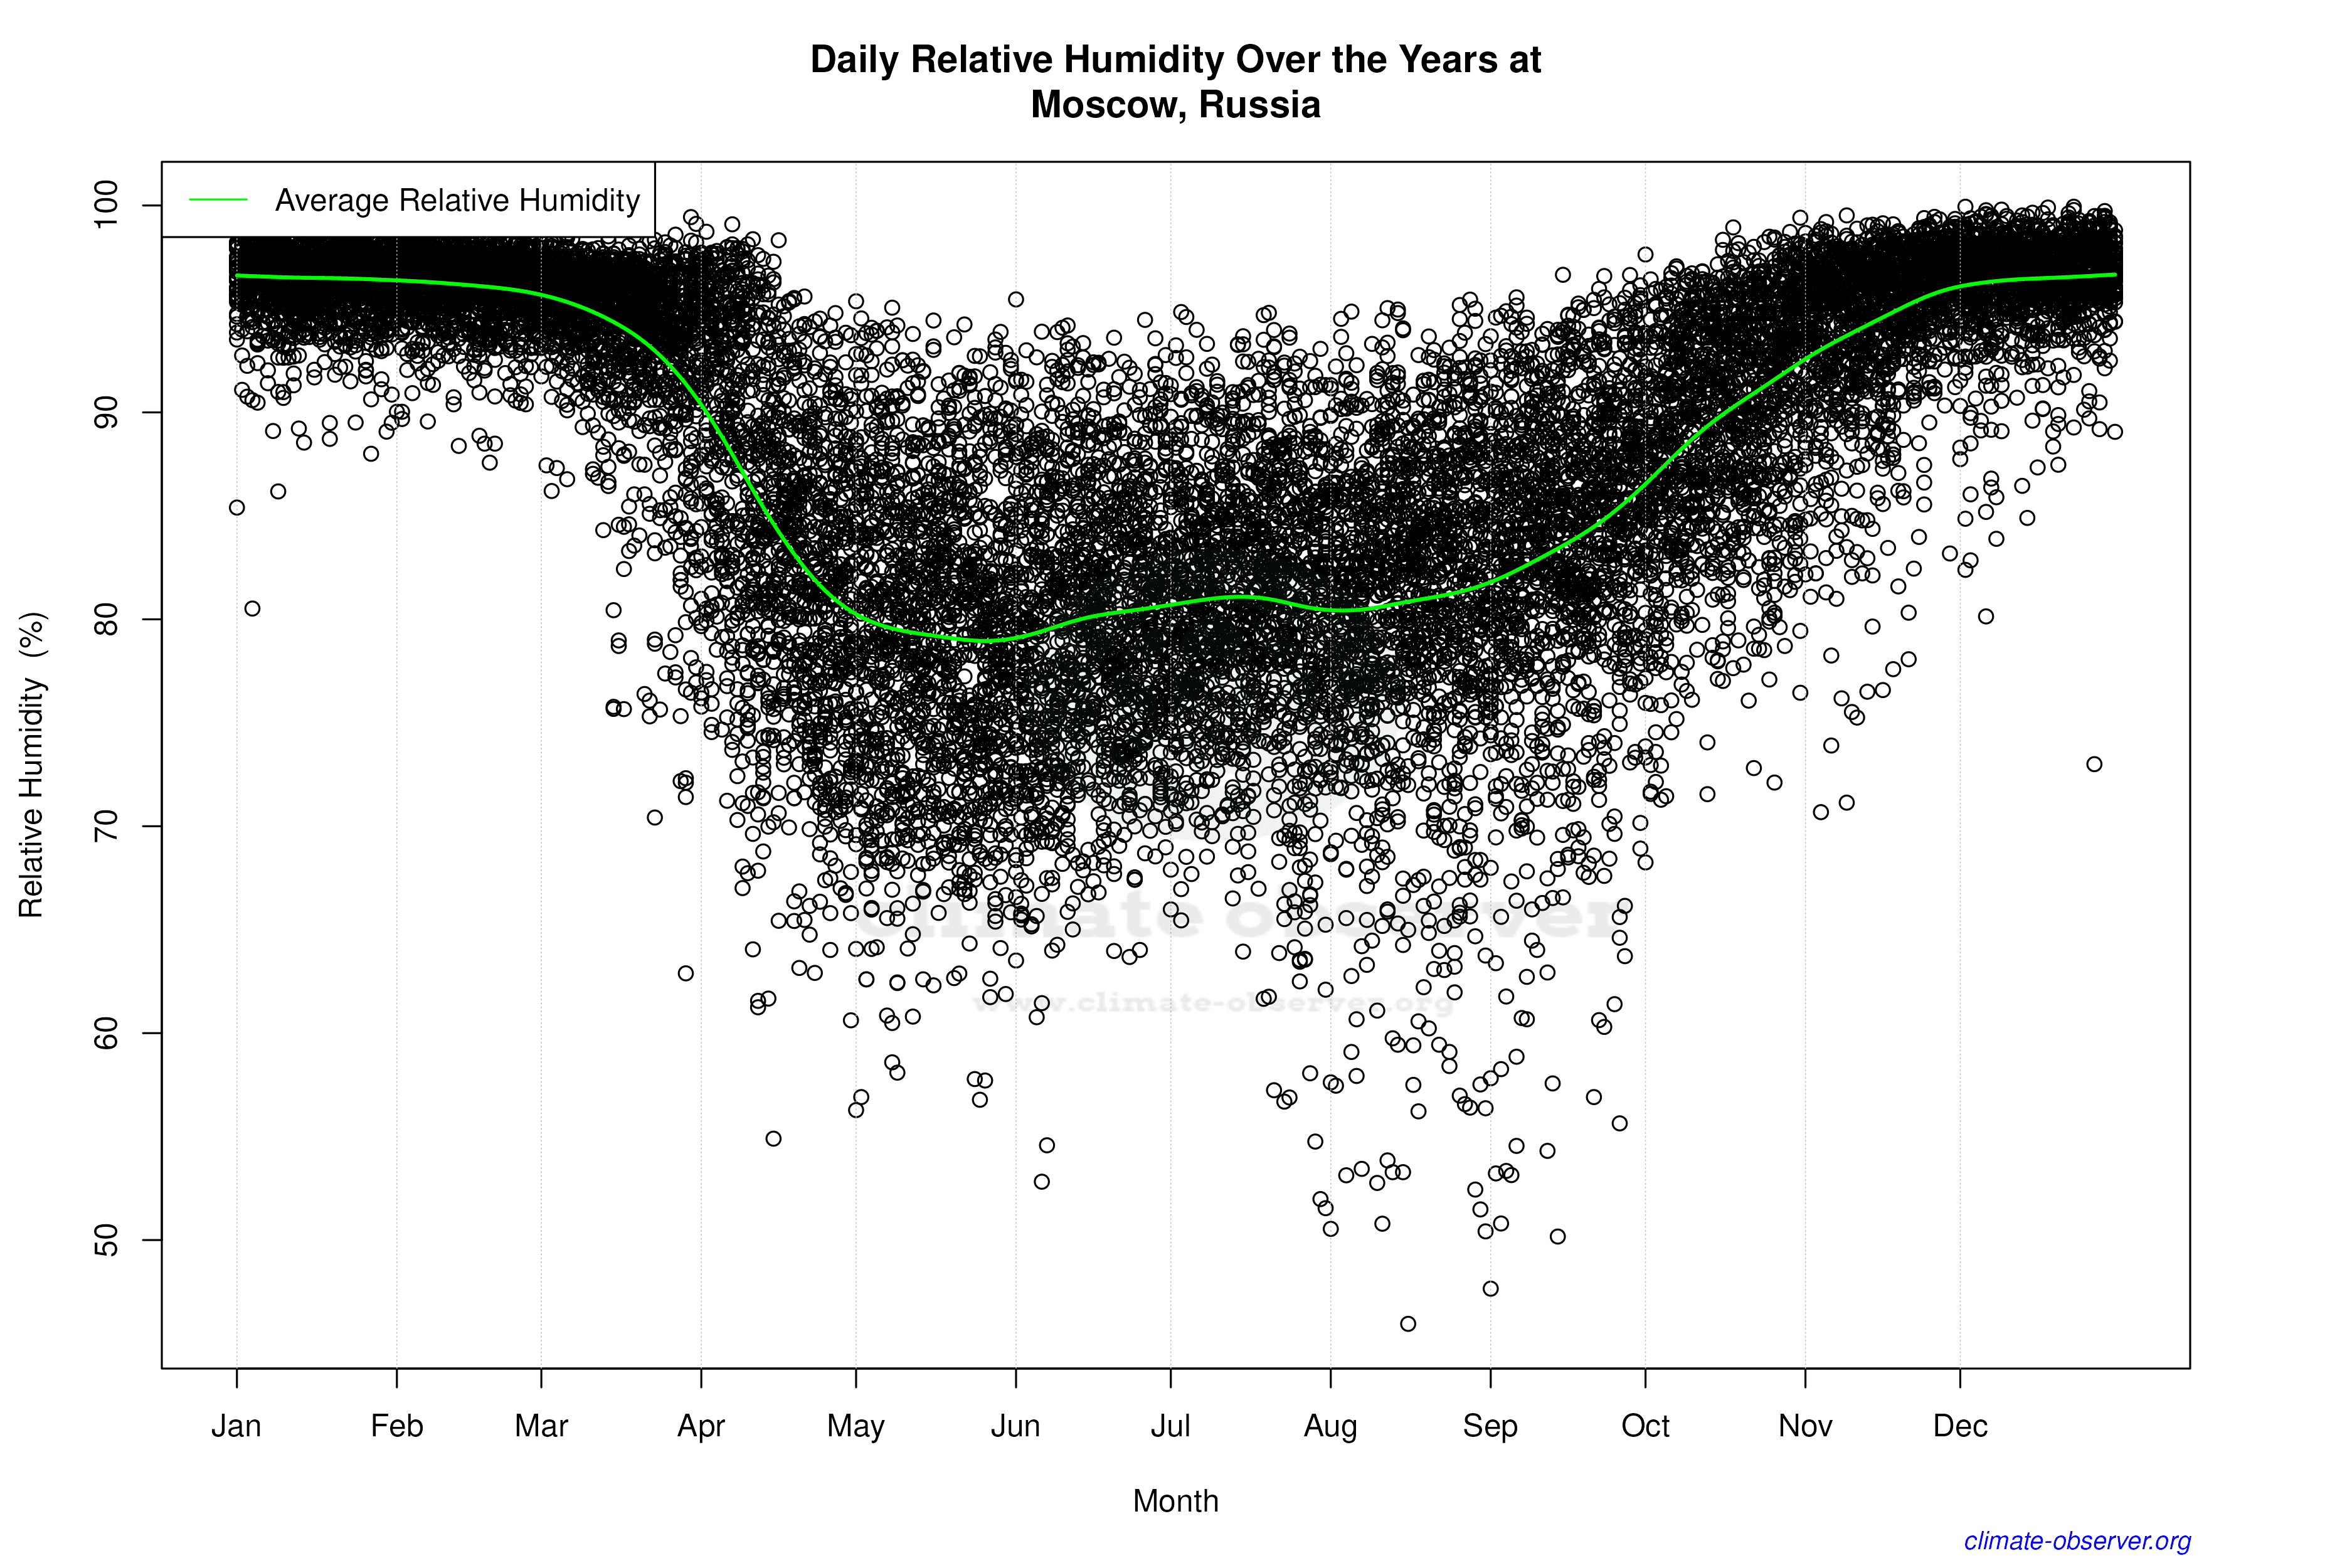

Average Max Temperature Throughout Year | 1 of 5
