Climate for Station: Kirensk, Irkutsk Oblast, Russia
Loading live weather...
Climate Analysis & Overview
Kirensk is experiencing a notable warming trend, with significant increases in low temperatures over the past decade. The region's precipitation is becoming more evenly distributed, reflecting a shift in climate patterns that align with broader regional climate goals.
Siberian Thermal Dynamics
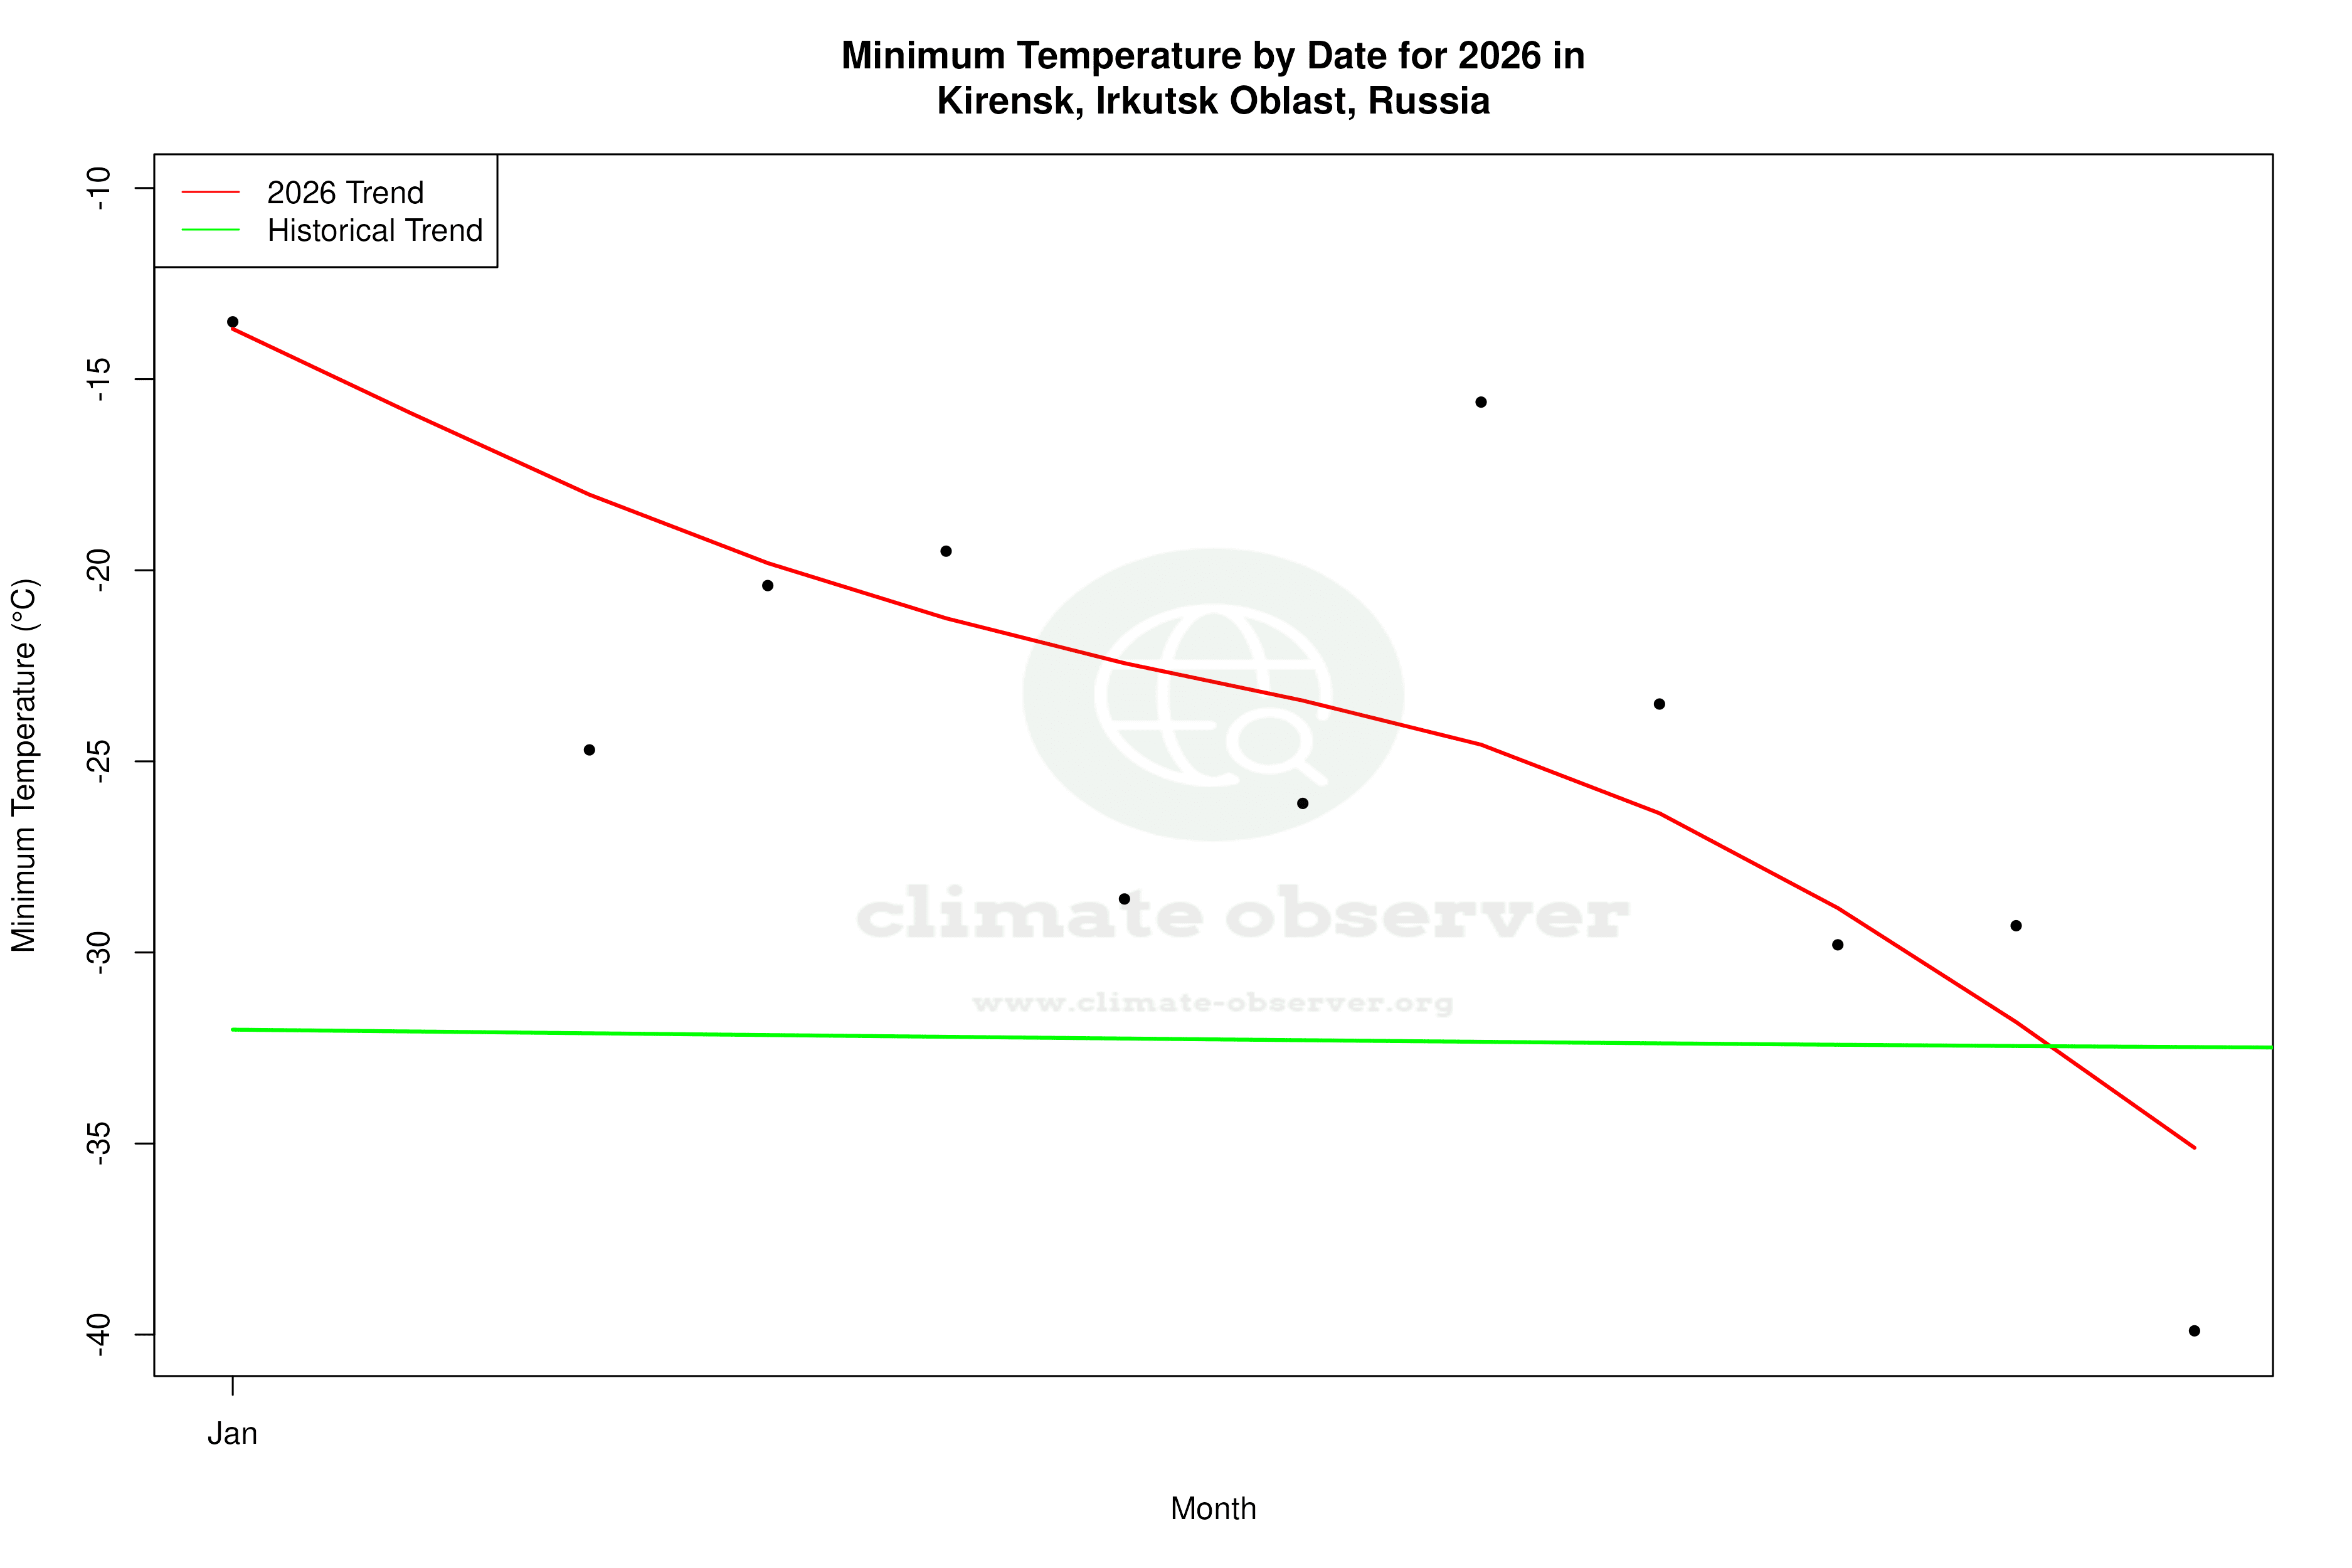
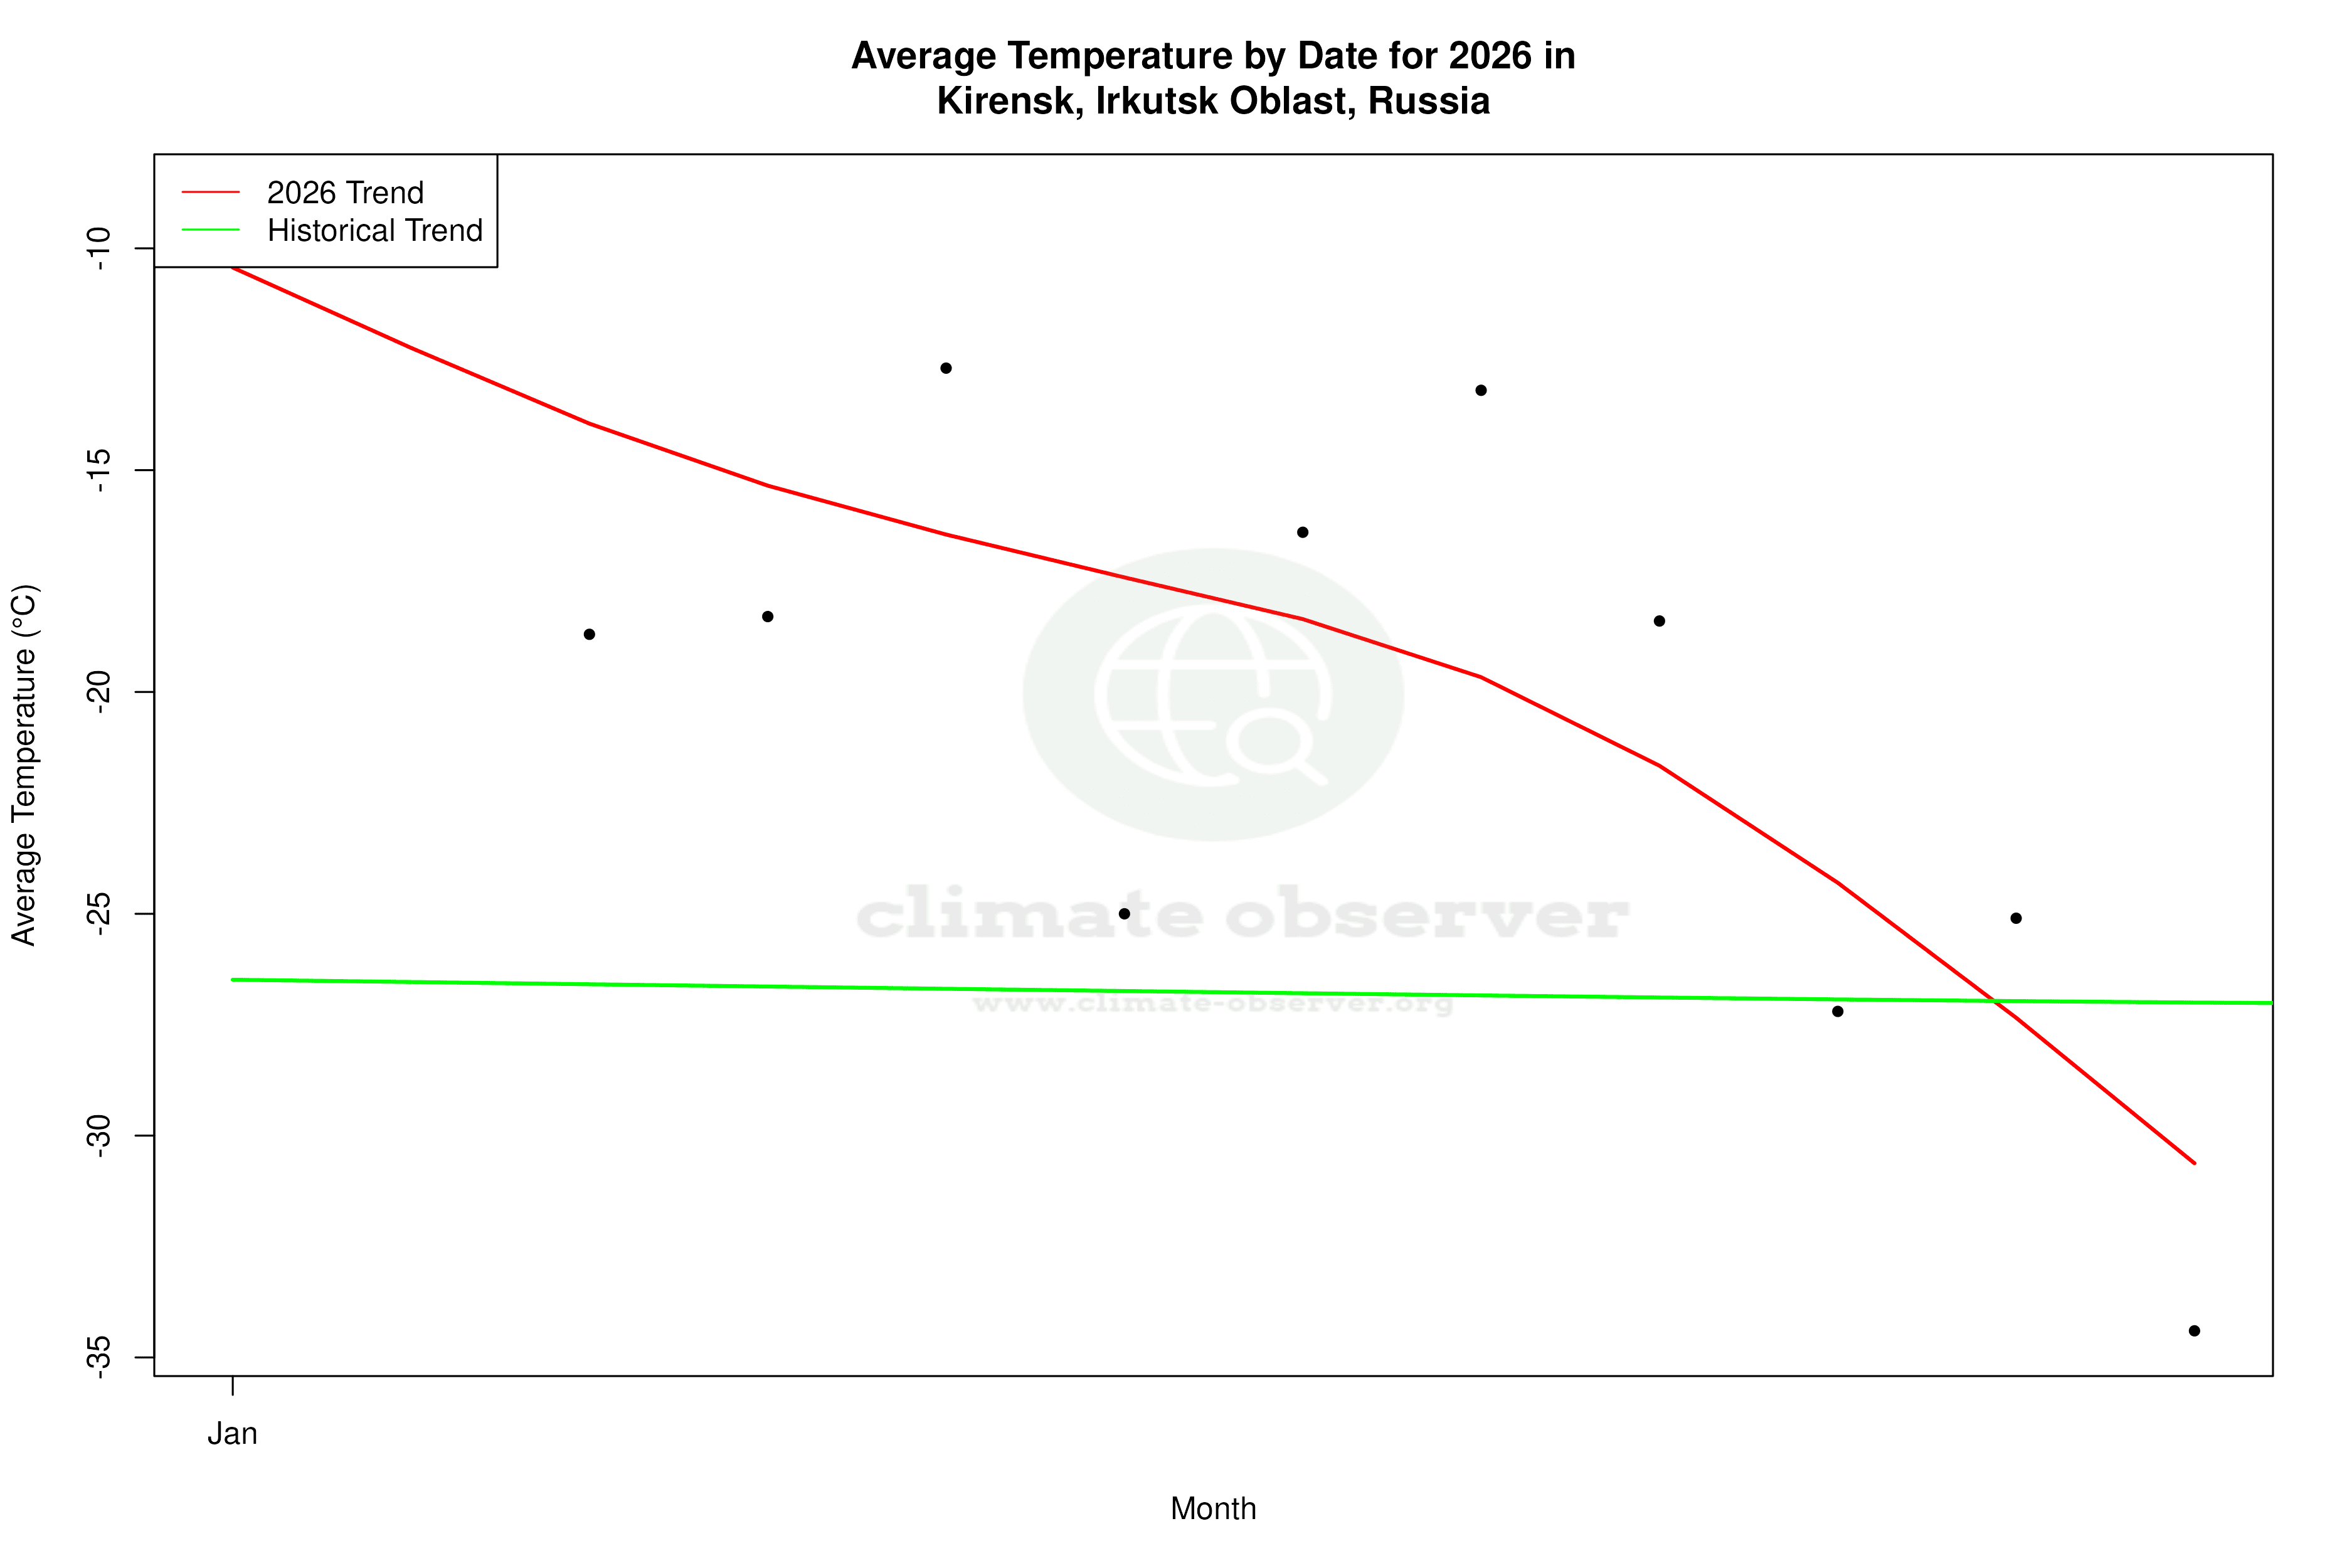
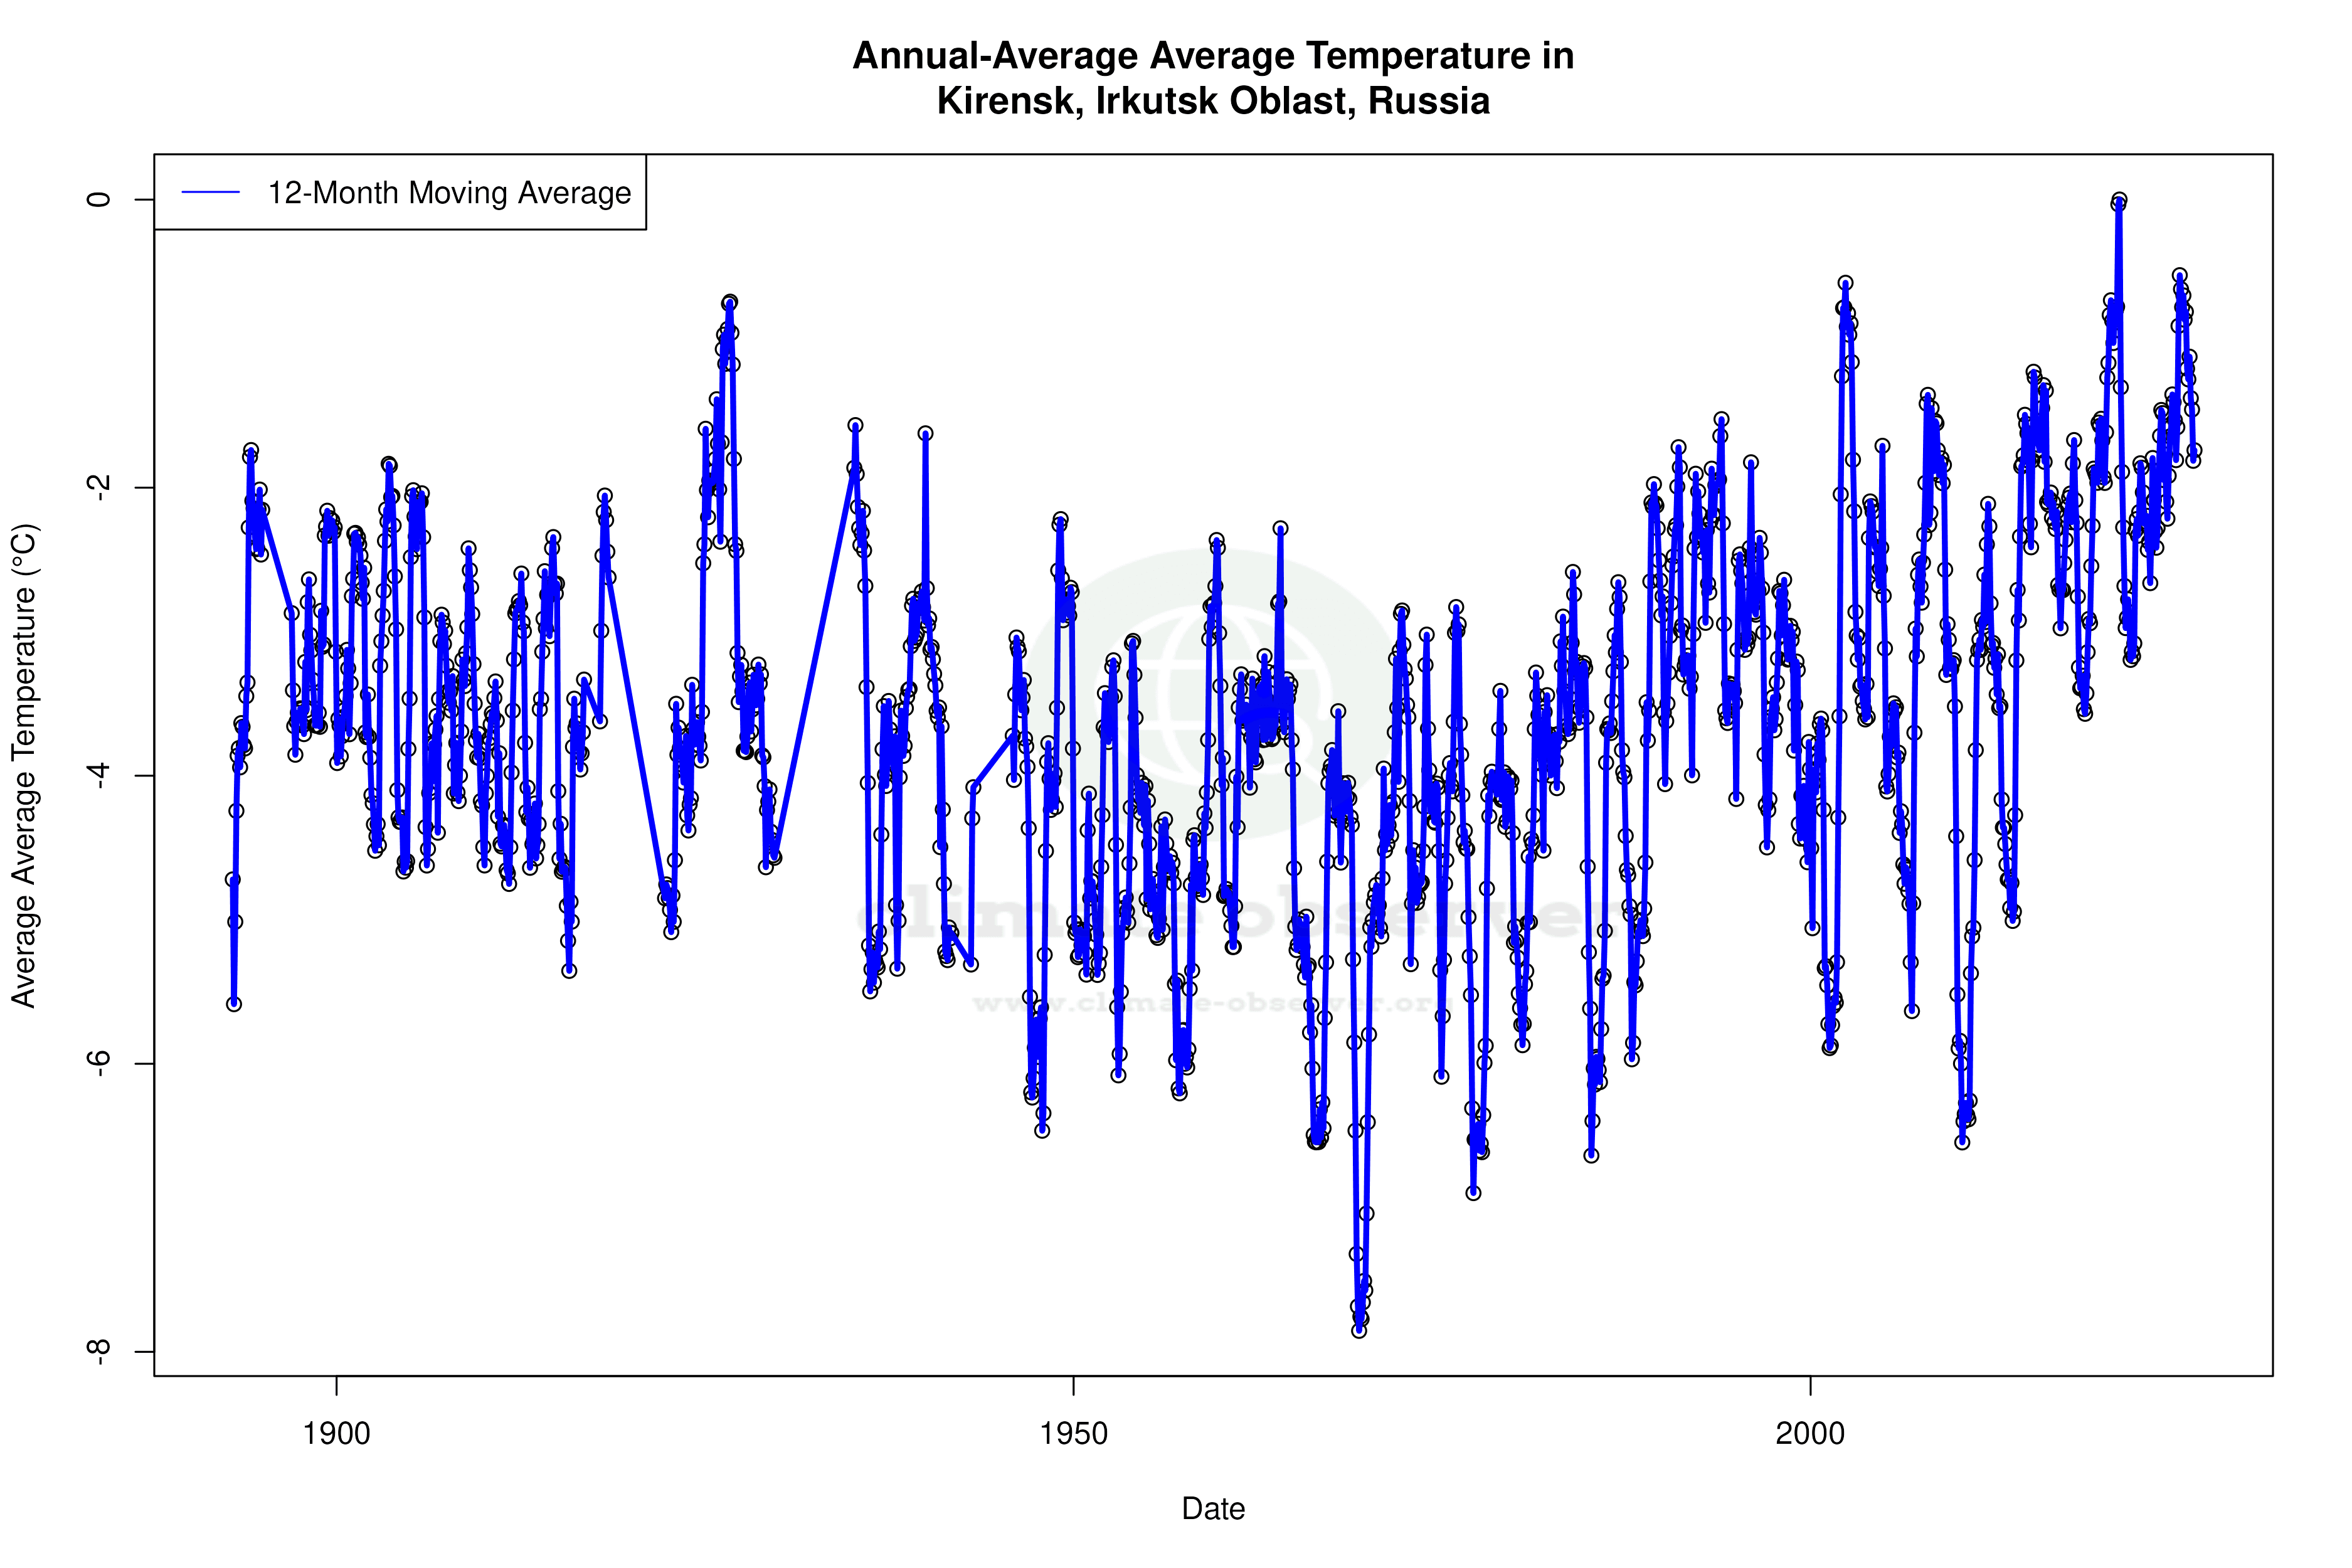
Kirensk, located in the Siberian Federal District, is characterised by a subarctic climate (Köppen Dfc), with long, harsh winters and short, mild summers. The all-time temperature trends reveal a warming pattern, with high temperatures rising by 0.22°C (0.40°F) and low temperatures increasing by 0.09°C (0.16°F). This warming trend is more pronounced over the past decade, particularly in low temperatures, which have increased by 1.49°C (2.68°F). Such changes suggest a shift towards milder winters, a critical factor for a region historically dominated by extreme cold.
Precipitation Patterns and Distribution
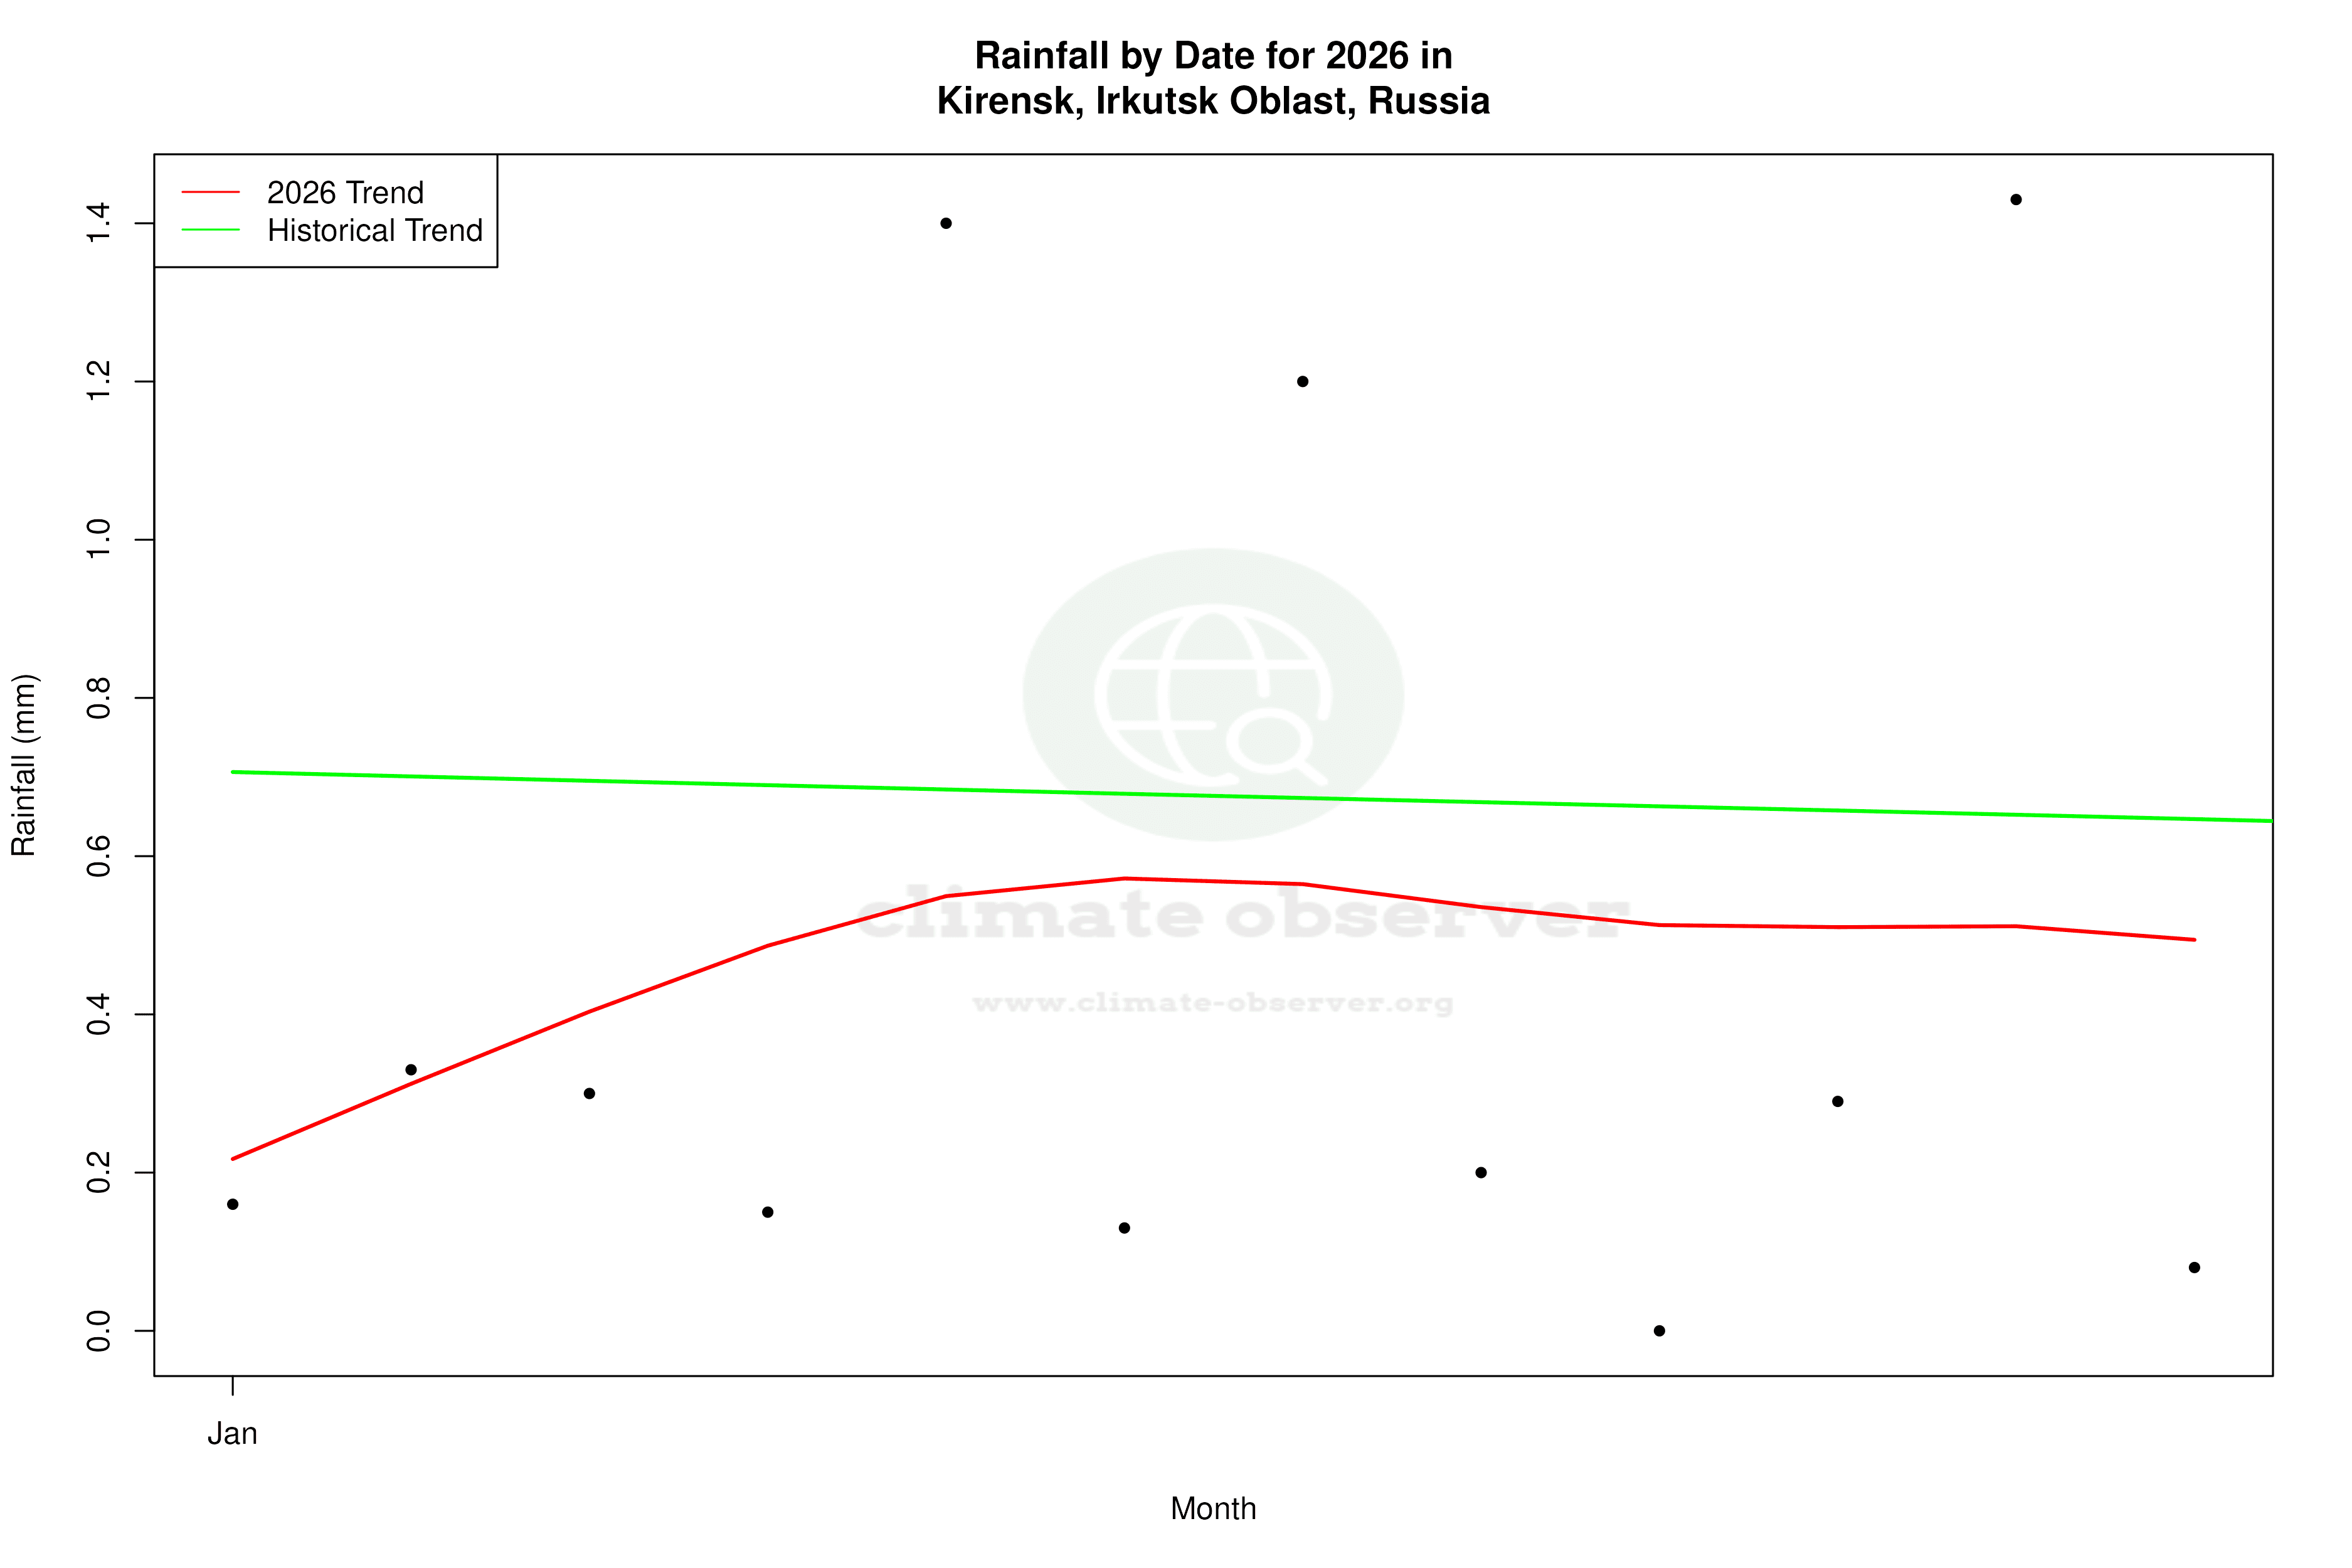
The Precipitation Concentration Index (PCI) for Kirensk has decreased from a baseline of 11.67 to a current value of 10.23. This indicates a more even distribution of precipitation throughout the year, as opposed to being concentrated in fewer events. Such a shift can influence local agriculture and water management, aligning with Russia's regional climate goals to adapt to changing precipitation patterns.
Temperature Extremes and Records
Kirensk's temperature records highlight the region's climatic extremes, with a maximum recorded temperature of 36.8°C (98.2°F) and a minimum of -57.8°C (-72.0°F). These extremes underscore the region's capacity for both intense summer heat and severe winter cold, although the recent warming trends may lead to a reduction in the frequency and intensity of such cold extremes.
Decadal Shifts in Climate
Over the past ten years, Kirensk has experienced a marked increase in low temperatures, rising by 1.49°C (2.68°F). This rate of change is significantly higher than the all-time trend, suggesting an acceleration in warming that may impact local ecosystems and human activities. The high temperatures have also risen by 0.04°C (0.07°F) over the same period, albeit at a slower rate. These shifts are consistent with broader observations of climate change in Siberia, where warming is occurring at a faster pace than the global average.
Regional Implications and Future Outlook
The climatic changes observed in Kirensk are part of a larger pattern affecting the Siberian region. The more evenly distributed precipitation and rising temperatures could have profound implications for local biodiversity, agriculture, and infrastructure. As Russia continues to focus on its climate goals, monitoring these trends will be crucial for developing adaptive strategies that mitigate the impacts of climate change on both the environment and the economy.
Station Statistics
10-Year Trend
High: -0.66 °F/decade
Low: +2.61 °F/decade
Rain: +0.030 in/decade
25-Year Trend
High: +0.62 °F/decade
Low: +0.80 °F/decade
Rain: +0.005 in/decade
50-Year Trend
High: +0.61 °F/decade
Low: +0.79 °F/decade
Rain: +0.001 in/decade
All-Time Trend
High: +0.37 °F/decade
Low: +0.16 °F/decade
Rain: +0.000 in/decade
Percentage Above-Average Days
Last 12 Months: 42.0%
This Year: 36.2%
Precipitation Concentration Index (PCI) ℹ️
Last 12 Months: 10.0
Historical Average: 12.5
Percentile Rank of Last 12 Months ℹ️
High: 70th percentile
Low: 95th percentile
Rain: 89th percentile
Change in Variance ℹ️
High: -3.3%
Low: -10.5%
Intraday: -11.7%
Data Coverage
87.5%
First Year of Data
1892
Station Location
Historical Weather Records
| Max High | Avg High | Min High | Max Avg | Avg Avg | Min Avg | Max Low | Avg Low | Min Low | Max Precipitation | Avg Precipitation | Max Snow | Avg Snow | |
|---|---|---|---|---|---|---|---|---|---|---|---|---|---|
| Record | 98.24 °F | — | -62.32 °F | 80.96 °F | — | -66.28 °F | 70.16 °F | — | -72.04 °F | 2.58 in | — | — | — |
| January | 34.52 °F | -5.49 °F | -61.96 °F | 31.64 °F | -16.20 °F | -66.28 °F | 27.32 °F | -26.21 °F | -72.04 °F | 0.35 in | 0.02 in | — | — |
| February | 44.60 °F | 3.35 °F | -49.36 °F | 40.10 °F | -9.45 °F | -58.18 °F | 35.96 °F | -21.68 °F | -69.16 °F | 0.36 in | 0.02 in | — | — |
| March | 60.98 °F | 25.06 °F | -16.42 °F | 46.40 °F | 8.65 °F | -38.02 °F | 38.66 °F | -6.96 °F | -53.86 °F | 0.38 in | 0.01 in | — | — |
| April | 76.10 °F | 41.62 °F | 5.54 °F | 60.26 °F | 29.11 °F | -10.30 °F | 48.20 °F | 16.12 °F | -34.24 °F | 0.59 in | 0.02 in | — | — |
| May | 92.48 °F | 58.15 °F | 31.10 °F | 75.20 °F | 45.27 °F | 20.84 °F | 65.30 °F | 32.63 °F | 4.28 °F | 0.90 in | 0.04 in | — | — |
| June | 98.24 °F | 73.16 °F | 37.98 °F | 80.06 °F | 59.80 °F | 32.54 °F | 67.28 °F | 46.31 °F | 24.26 °F | 2.58 in | 0.07 in | — | — |
| July | 97.88 °F | 77.36 °F | 50.72 °F | 80.96 °F | 65.35 °F | 43.16 °F | 70.16 °F | 53.27 °F | 32.72 °F | 2.50 in | 0.08 in | — | — |
| August | 97.70 °F | 71.23 °F | 44.24 °F | 80.06 °F | 59.26 °F | 38.84 °F | 66.56 °F | 48.74 °F | 22.46 °F | 2.48 in | 0.08 in | — | — |
| September | 84.74 °F | 55.68 °F | 28.58 °F | 68.54 °F | 44.63 °F | 22.46 °F | 59.90 °F | 36.14 °F | 11.66 °F | 1.15 in | 0.05 in | — | — |
| October | 75.20 °F | 36.60 °F | -3.10 °F | 55.94 °F | 28.04 °F | -16.06 °F | 48.02 °F | 20.89 °F | -32.44 °F | 0.78 in | 0.04 in | — | — |
| November | 51.08 °F | 12.77 °F | -44.32 °F | 40.10 °F | 3.94 °F | -52.42 °F | 37.94 °F | -5.44 °F | -57.28 °F | 0.54 in | 0.03 in | — | — |
| December | 39.38 °F | -3.38 °F | -62.32 °F | 34.34 °F | -13.11 °F | -66.28 °F | 32.90 °F | -22.67 °F | -70.60 °F | 0.34 in | 0.03 in | — | — |
Data Visualisations
Remove WatermarksCurrent Year Climate Trends vs Historical
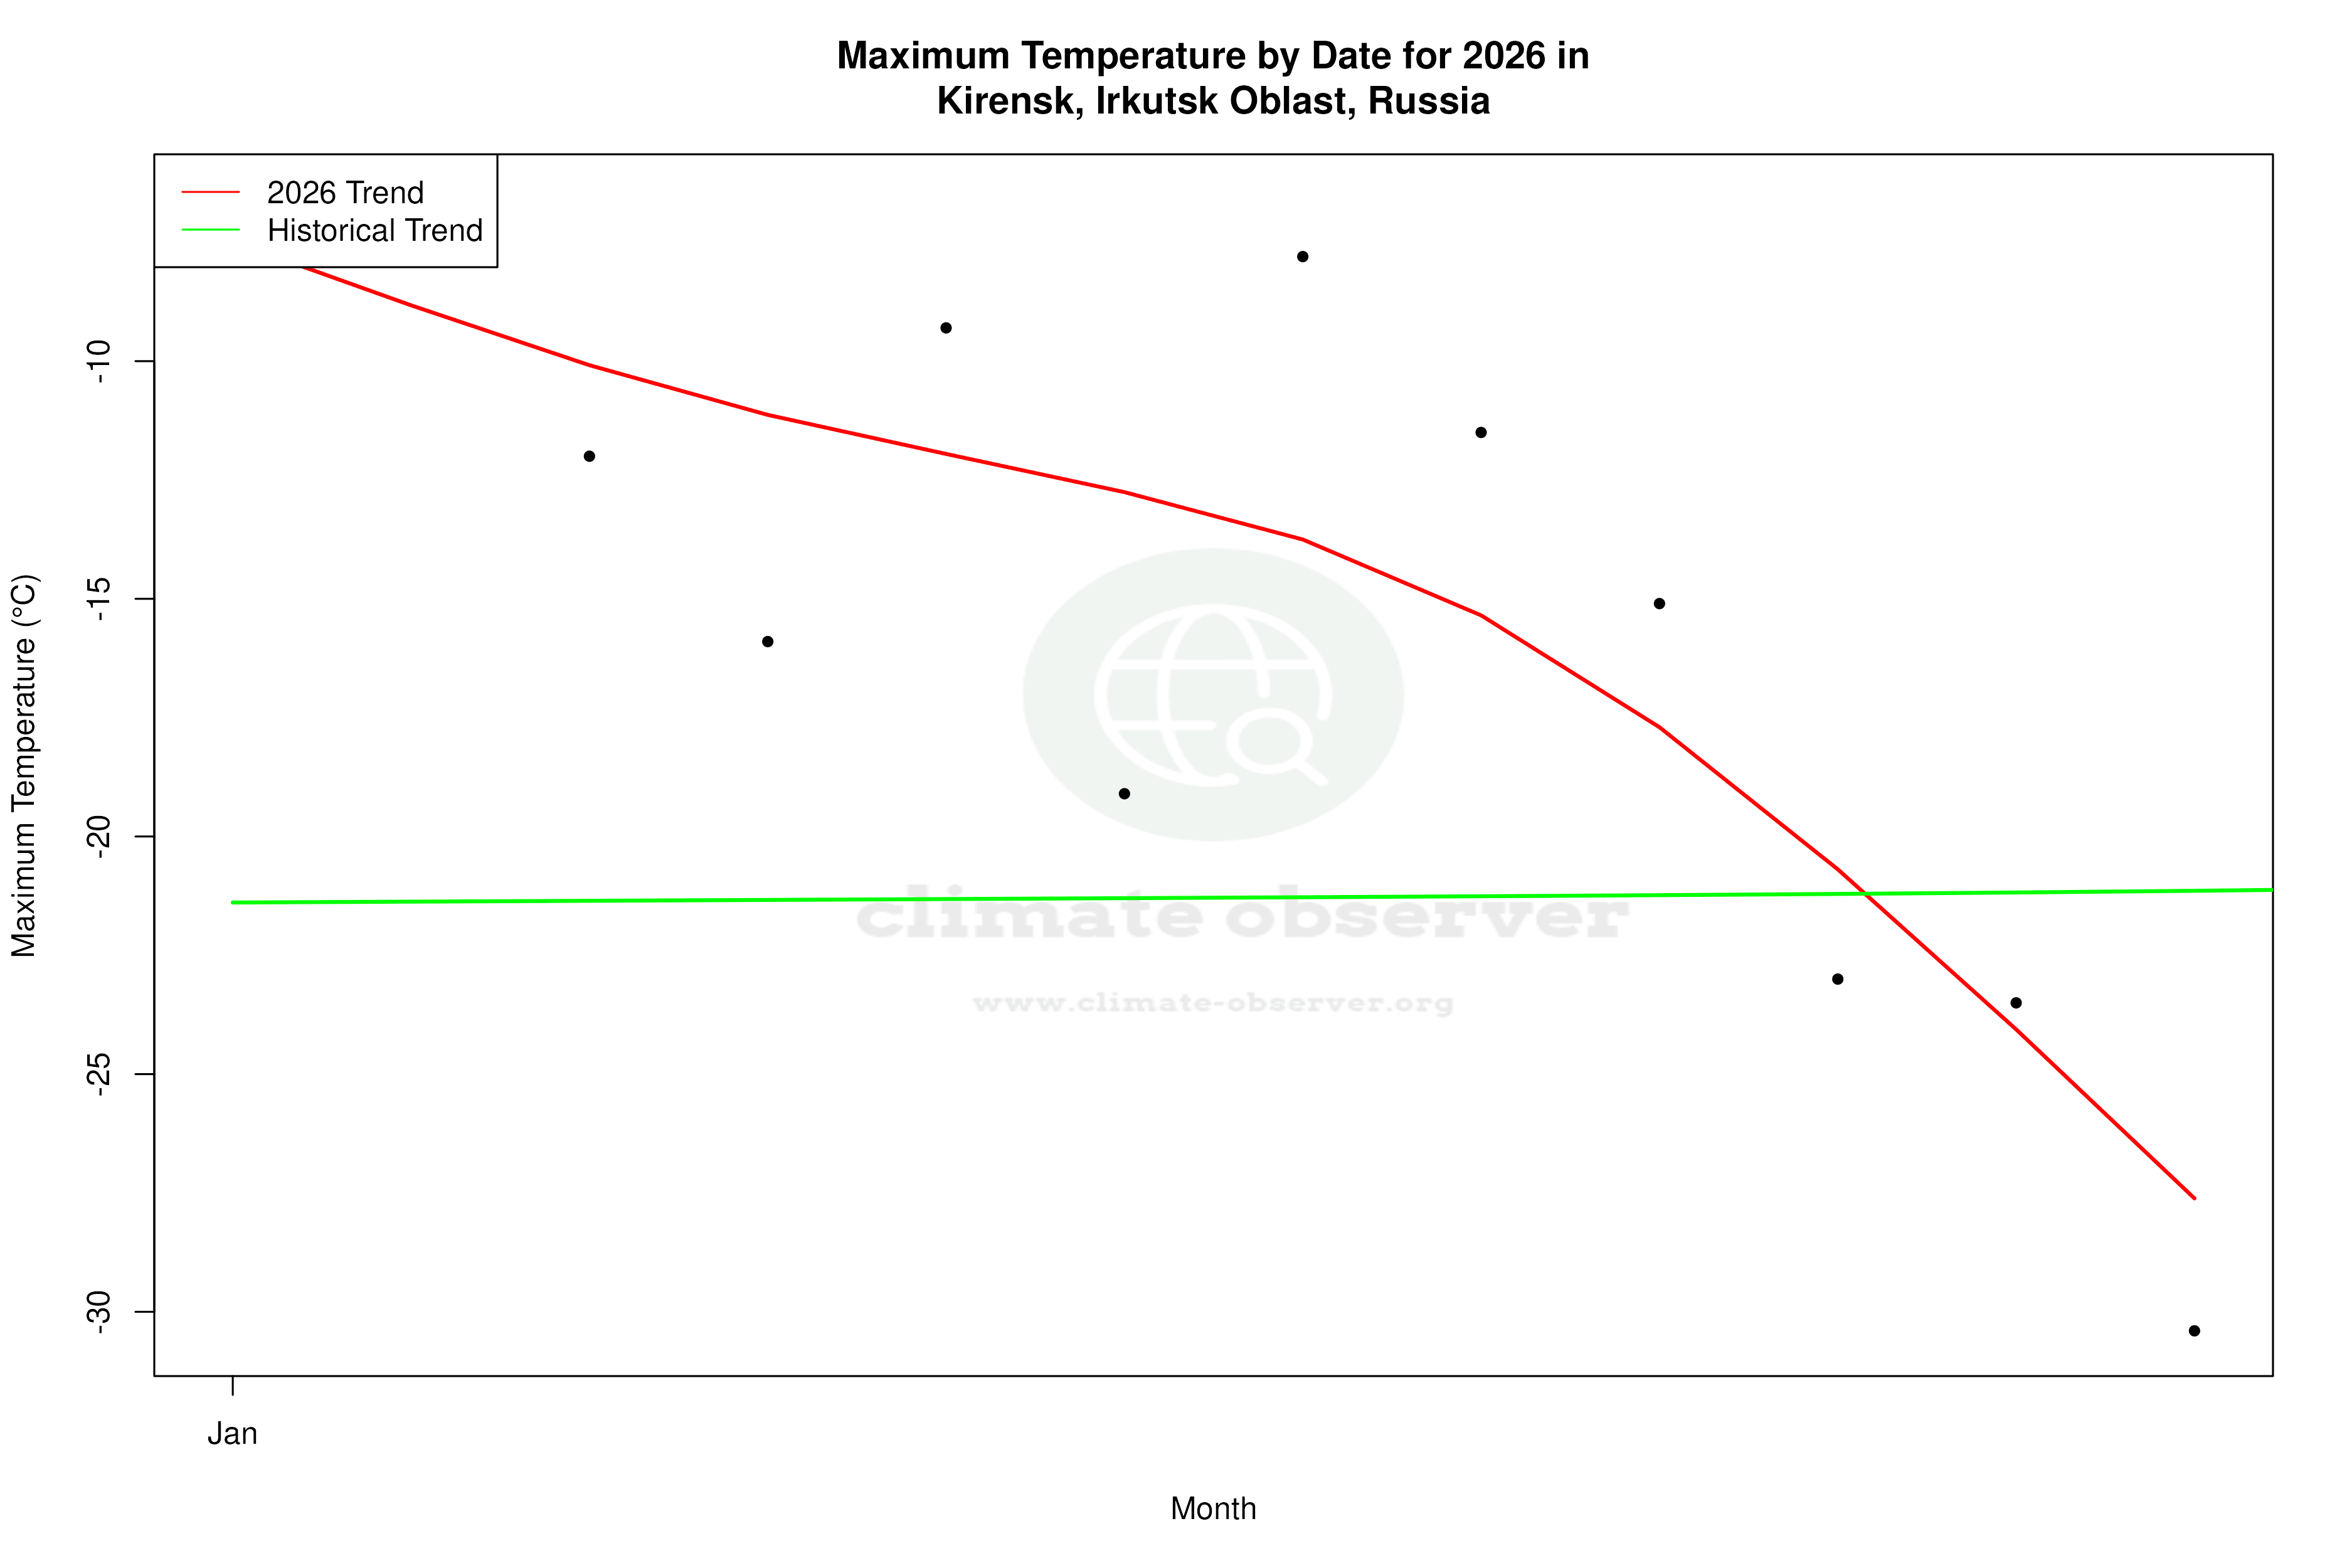


Max Temperature this Year | 1 of 6
Climate 12-Month Moving Averages

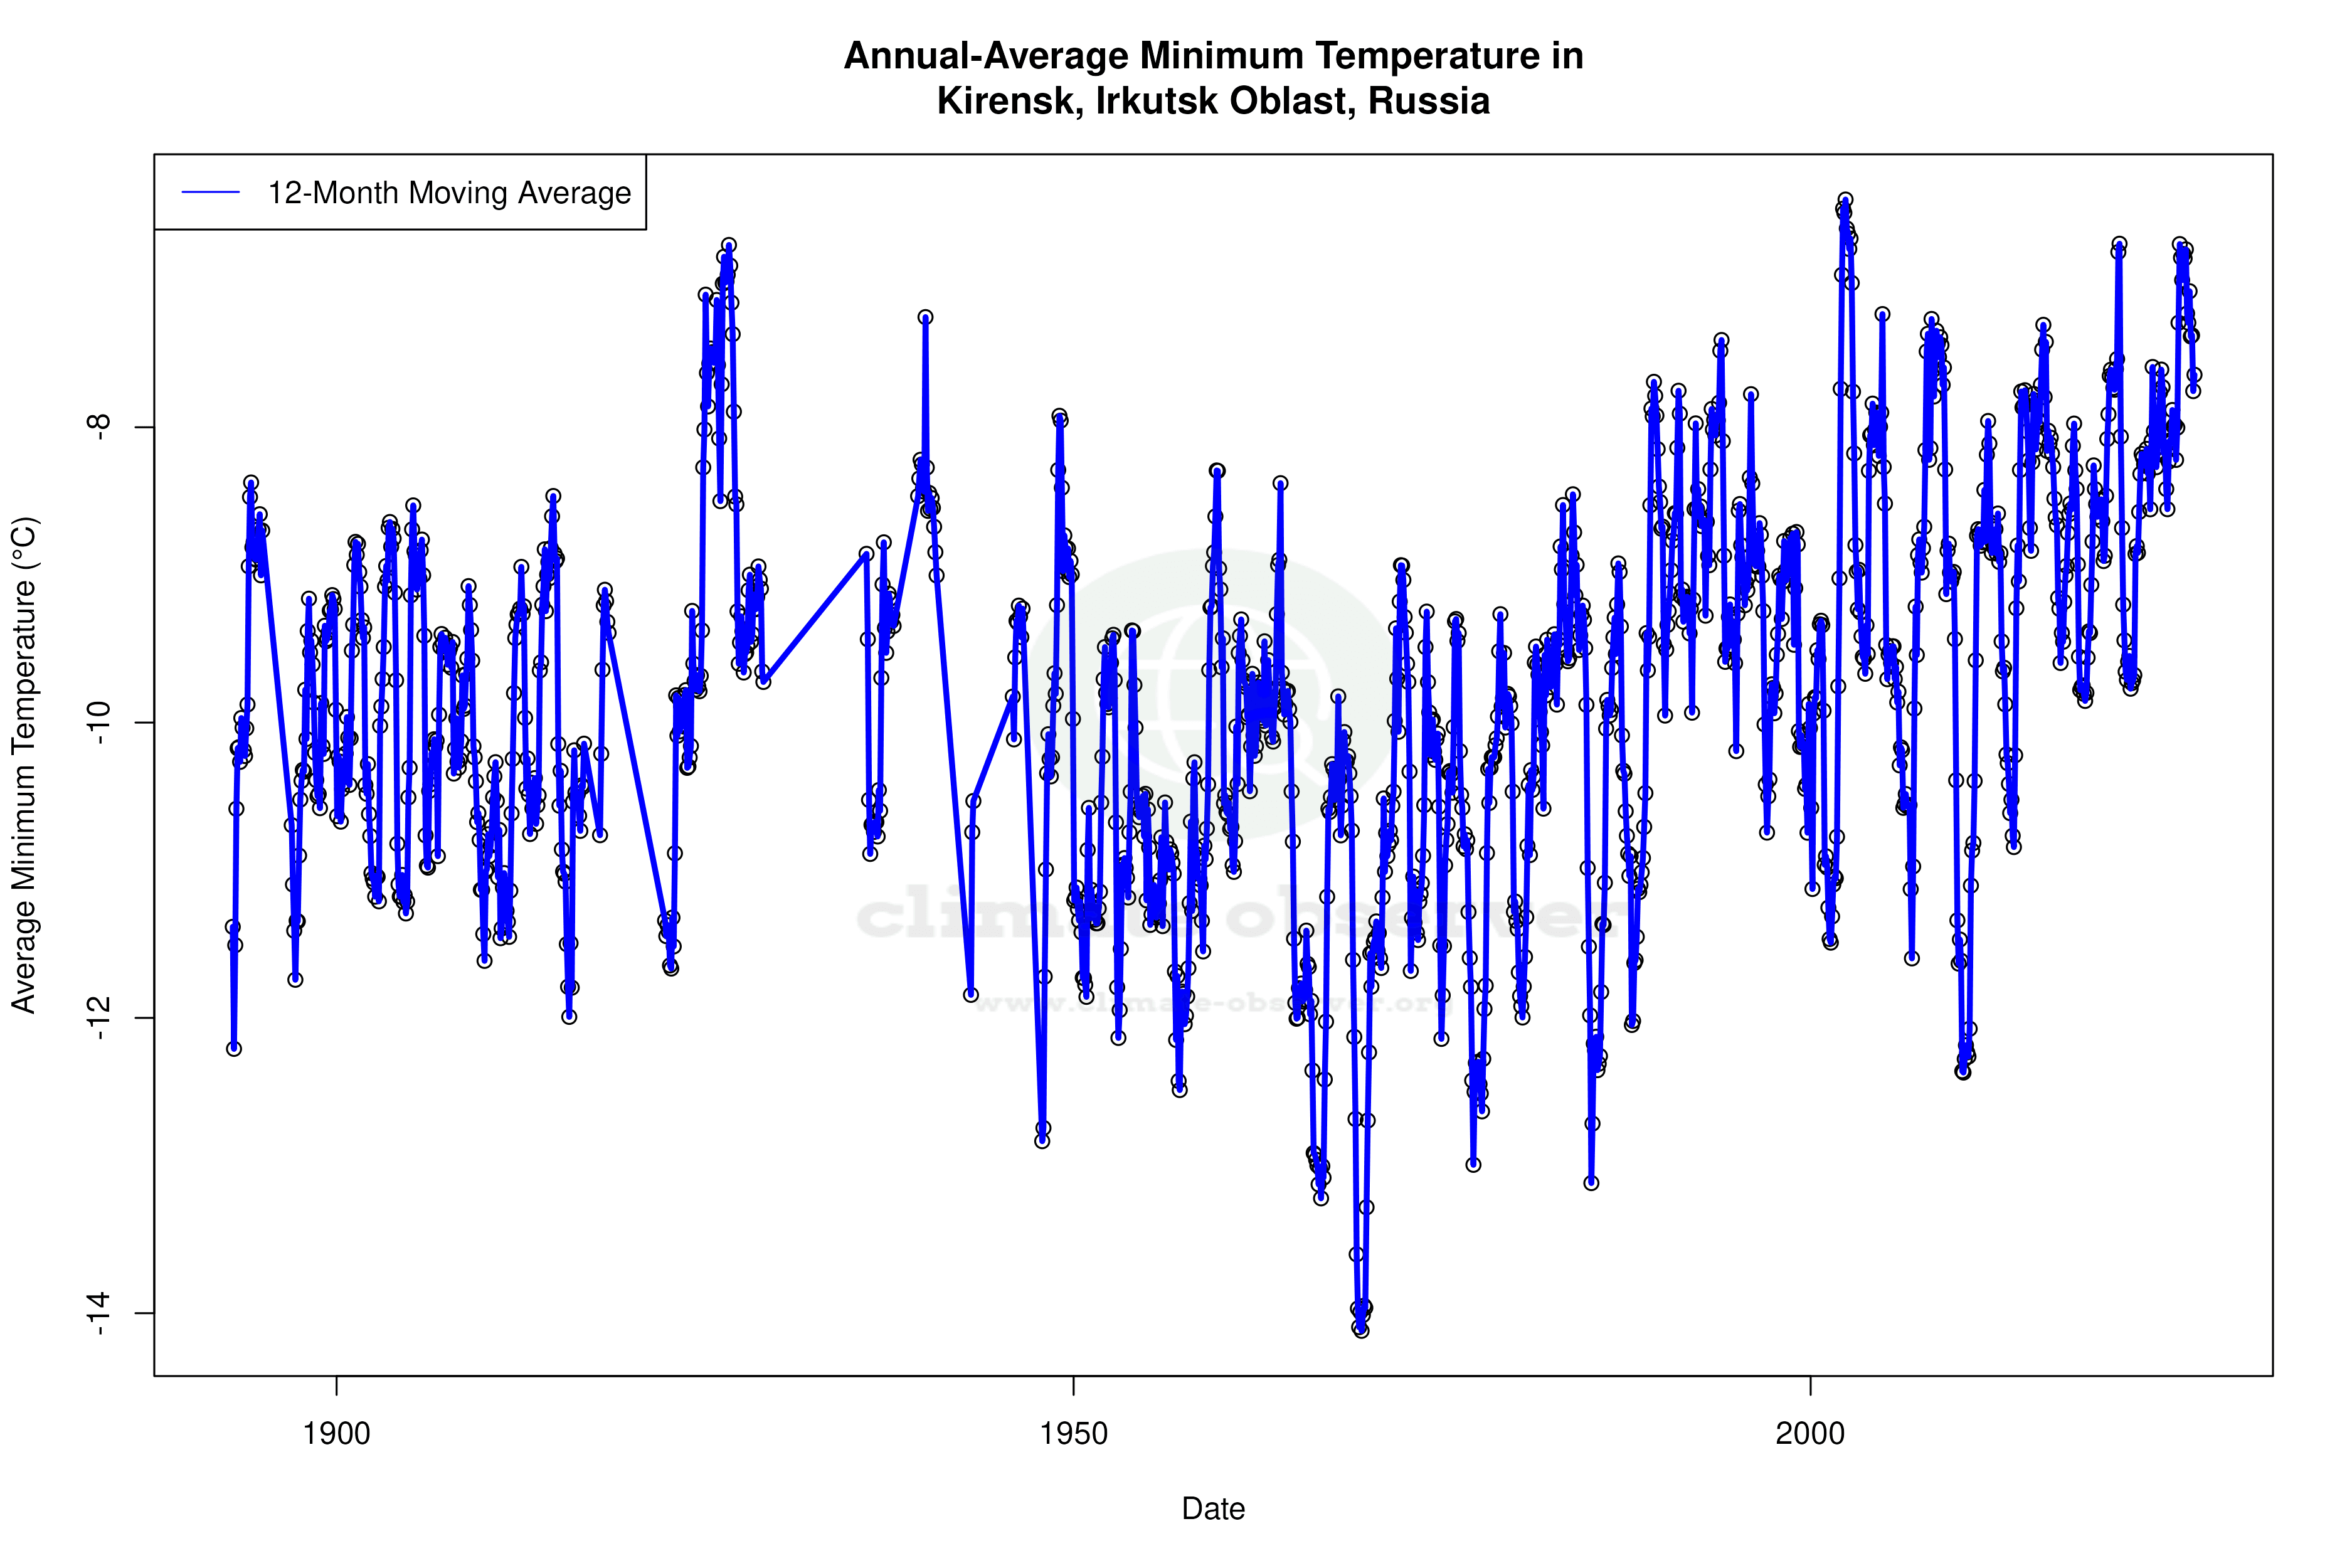


Max Temperature 12-Month MA | 1 of 6
Daily Data Points and Averages Throughout the Year
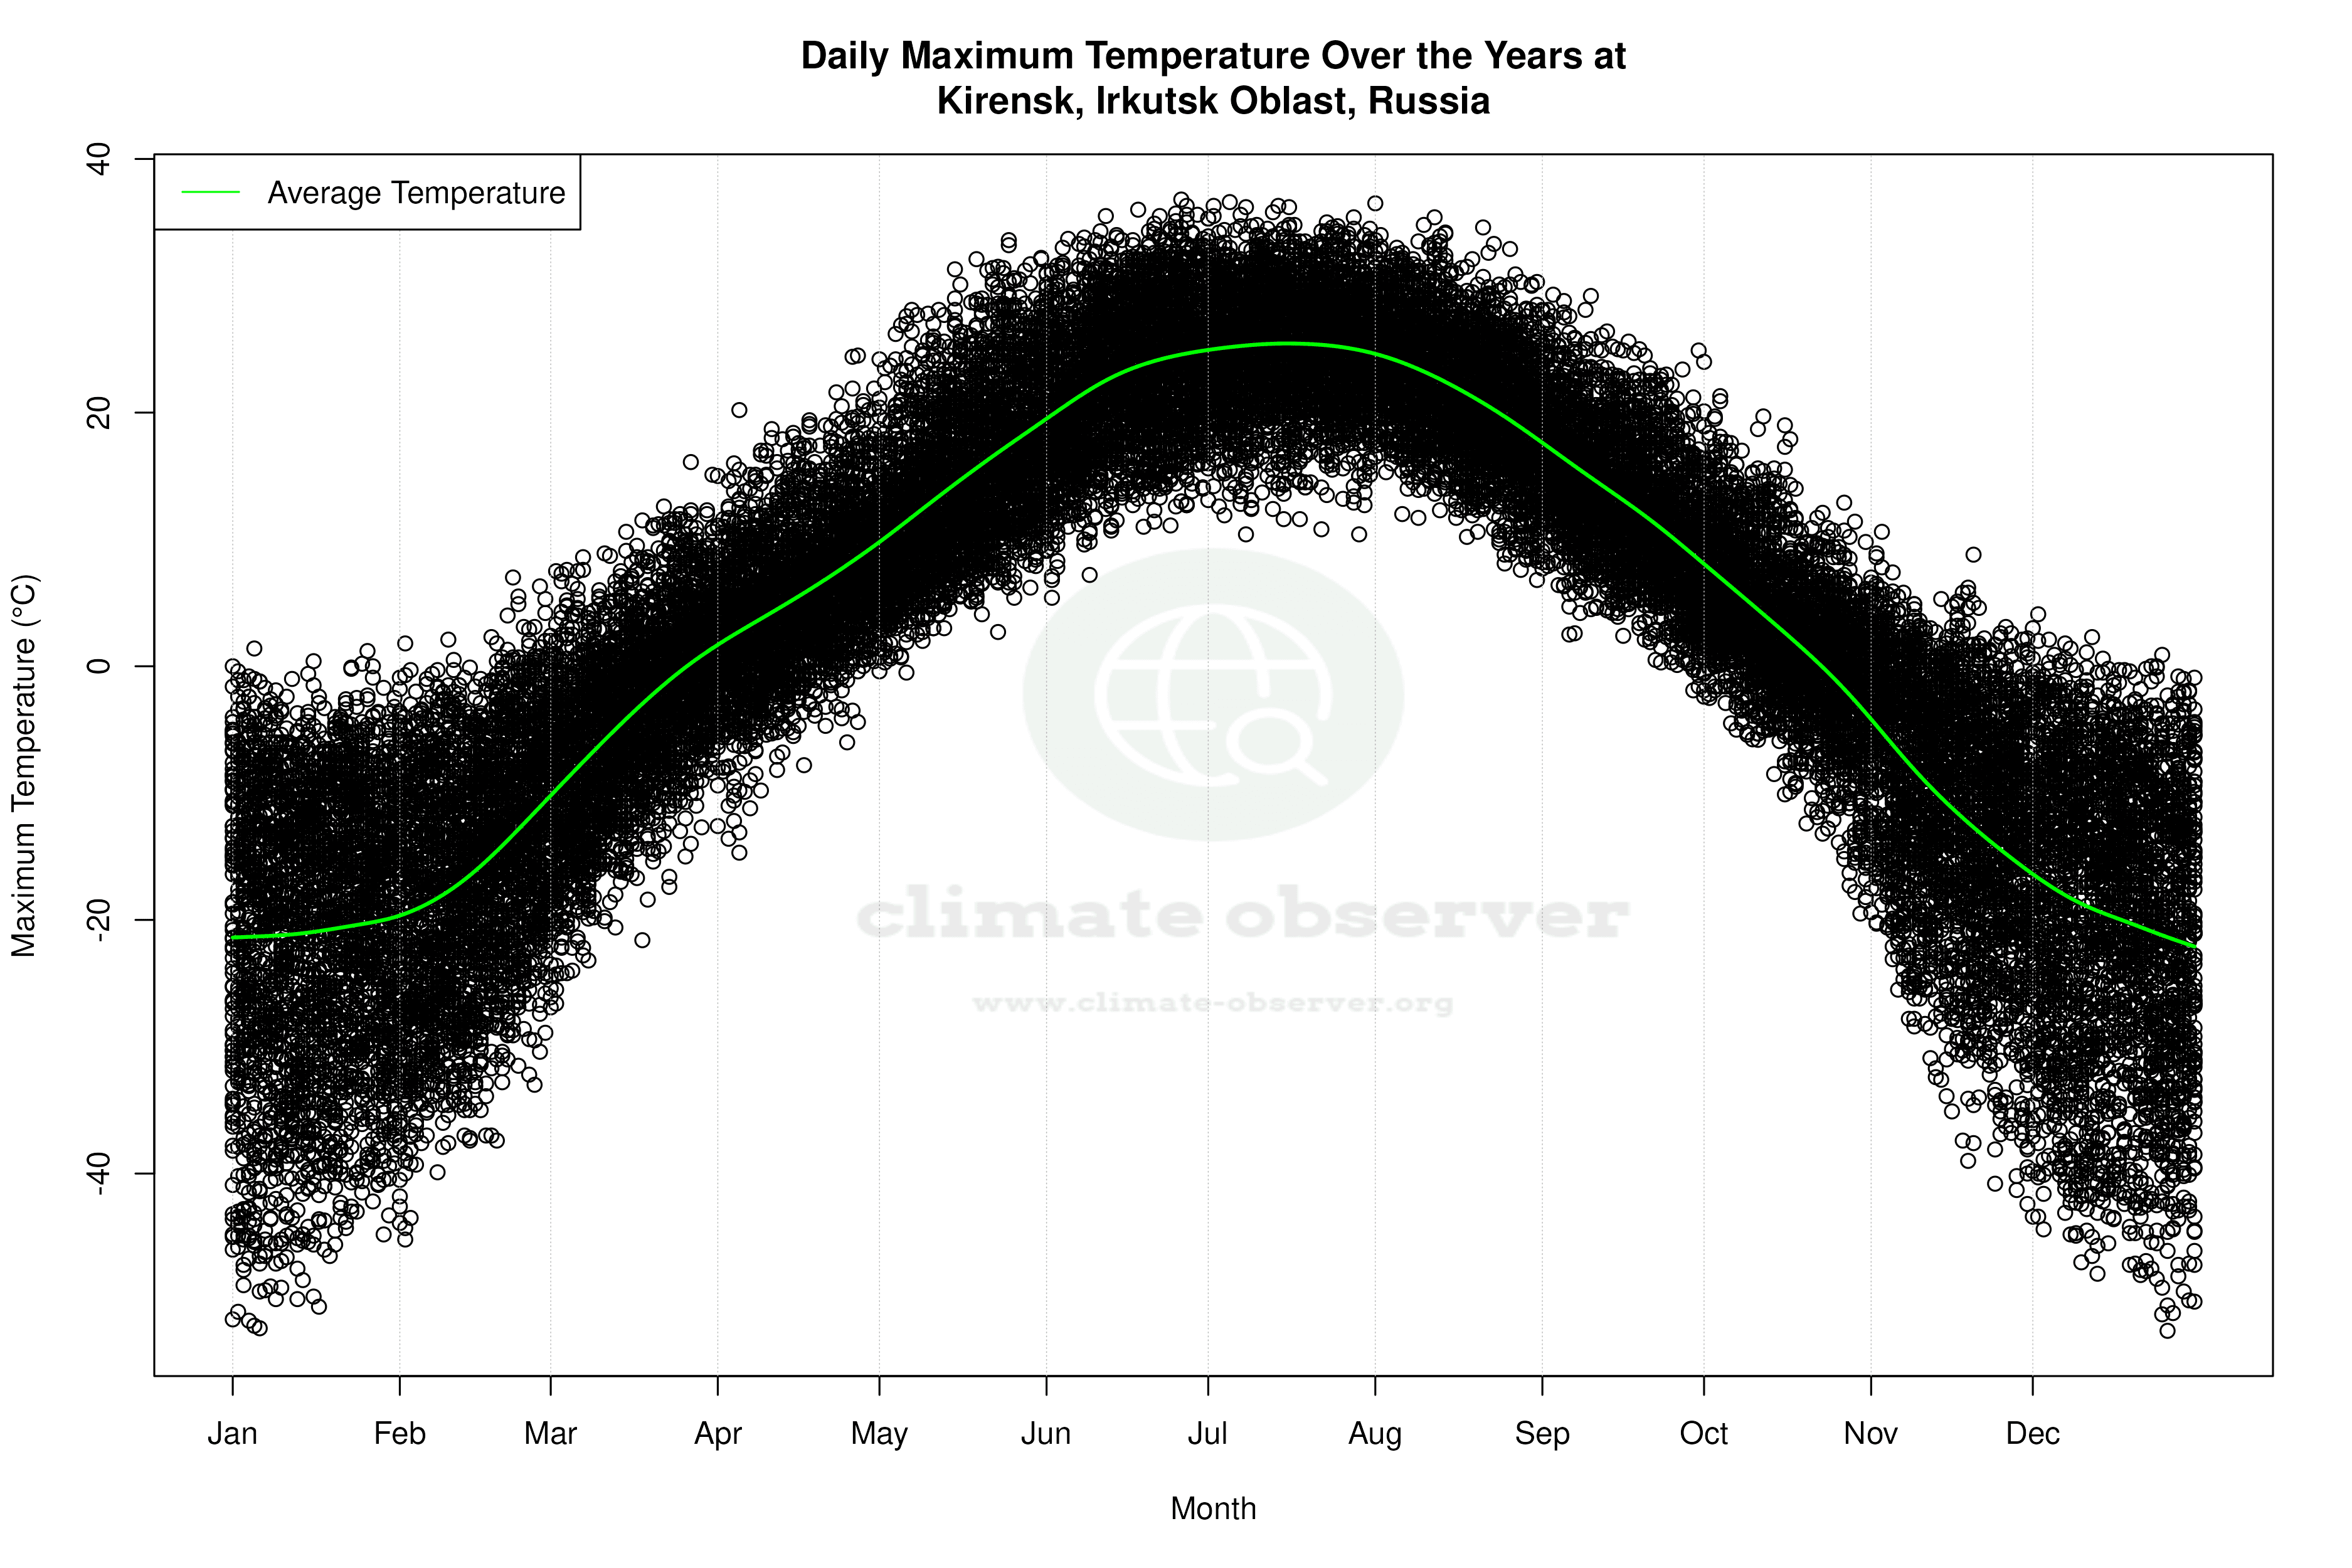
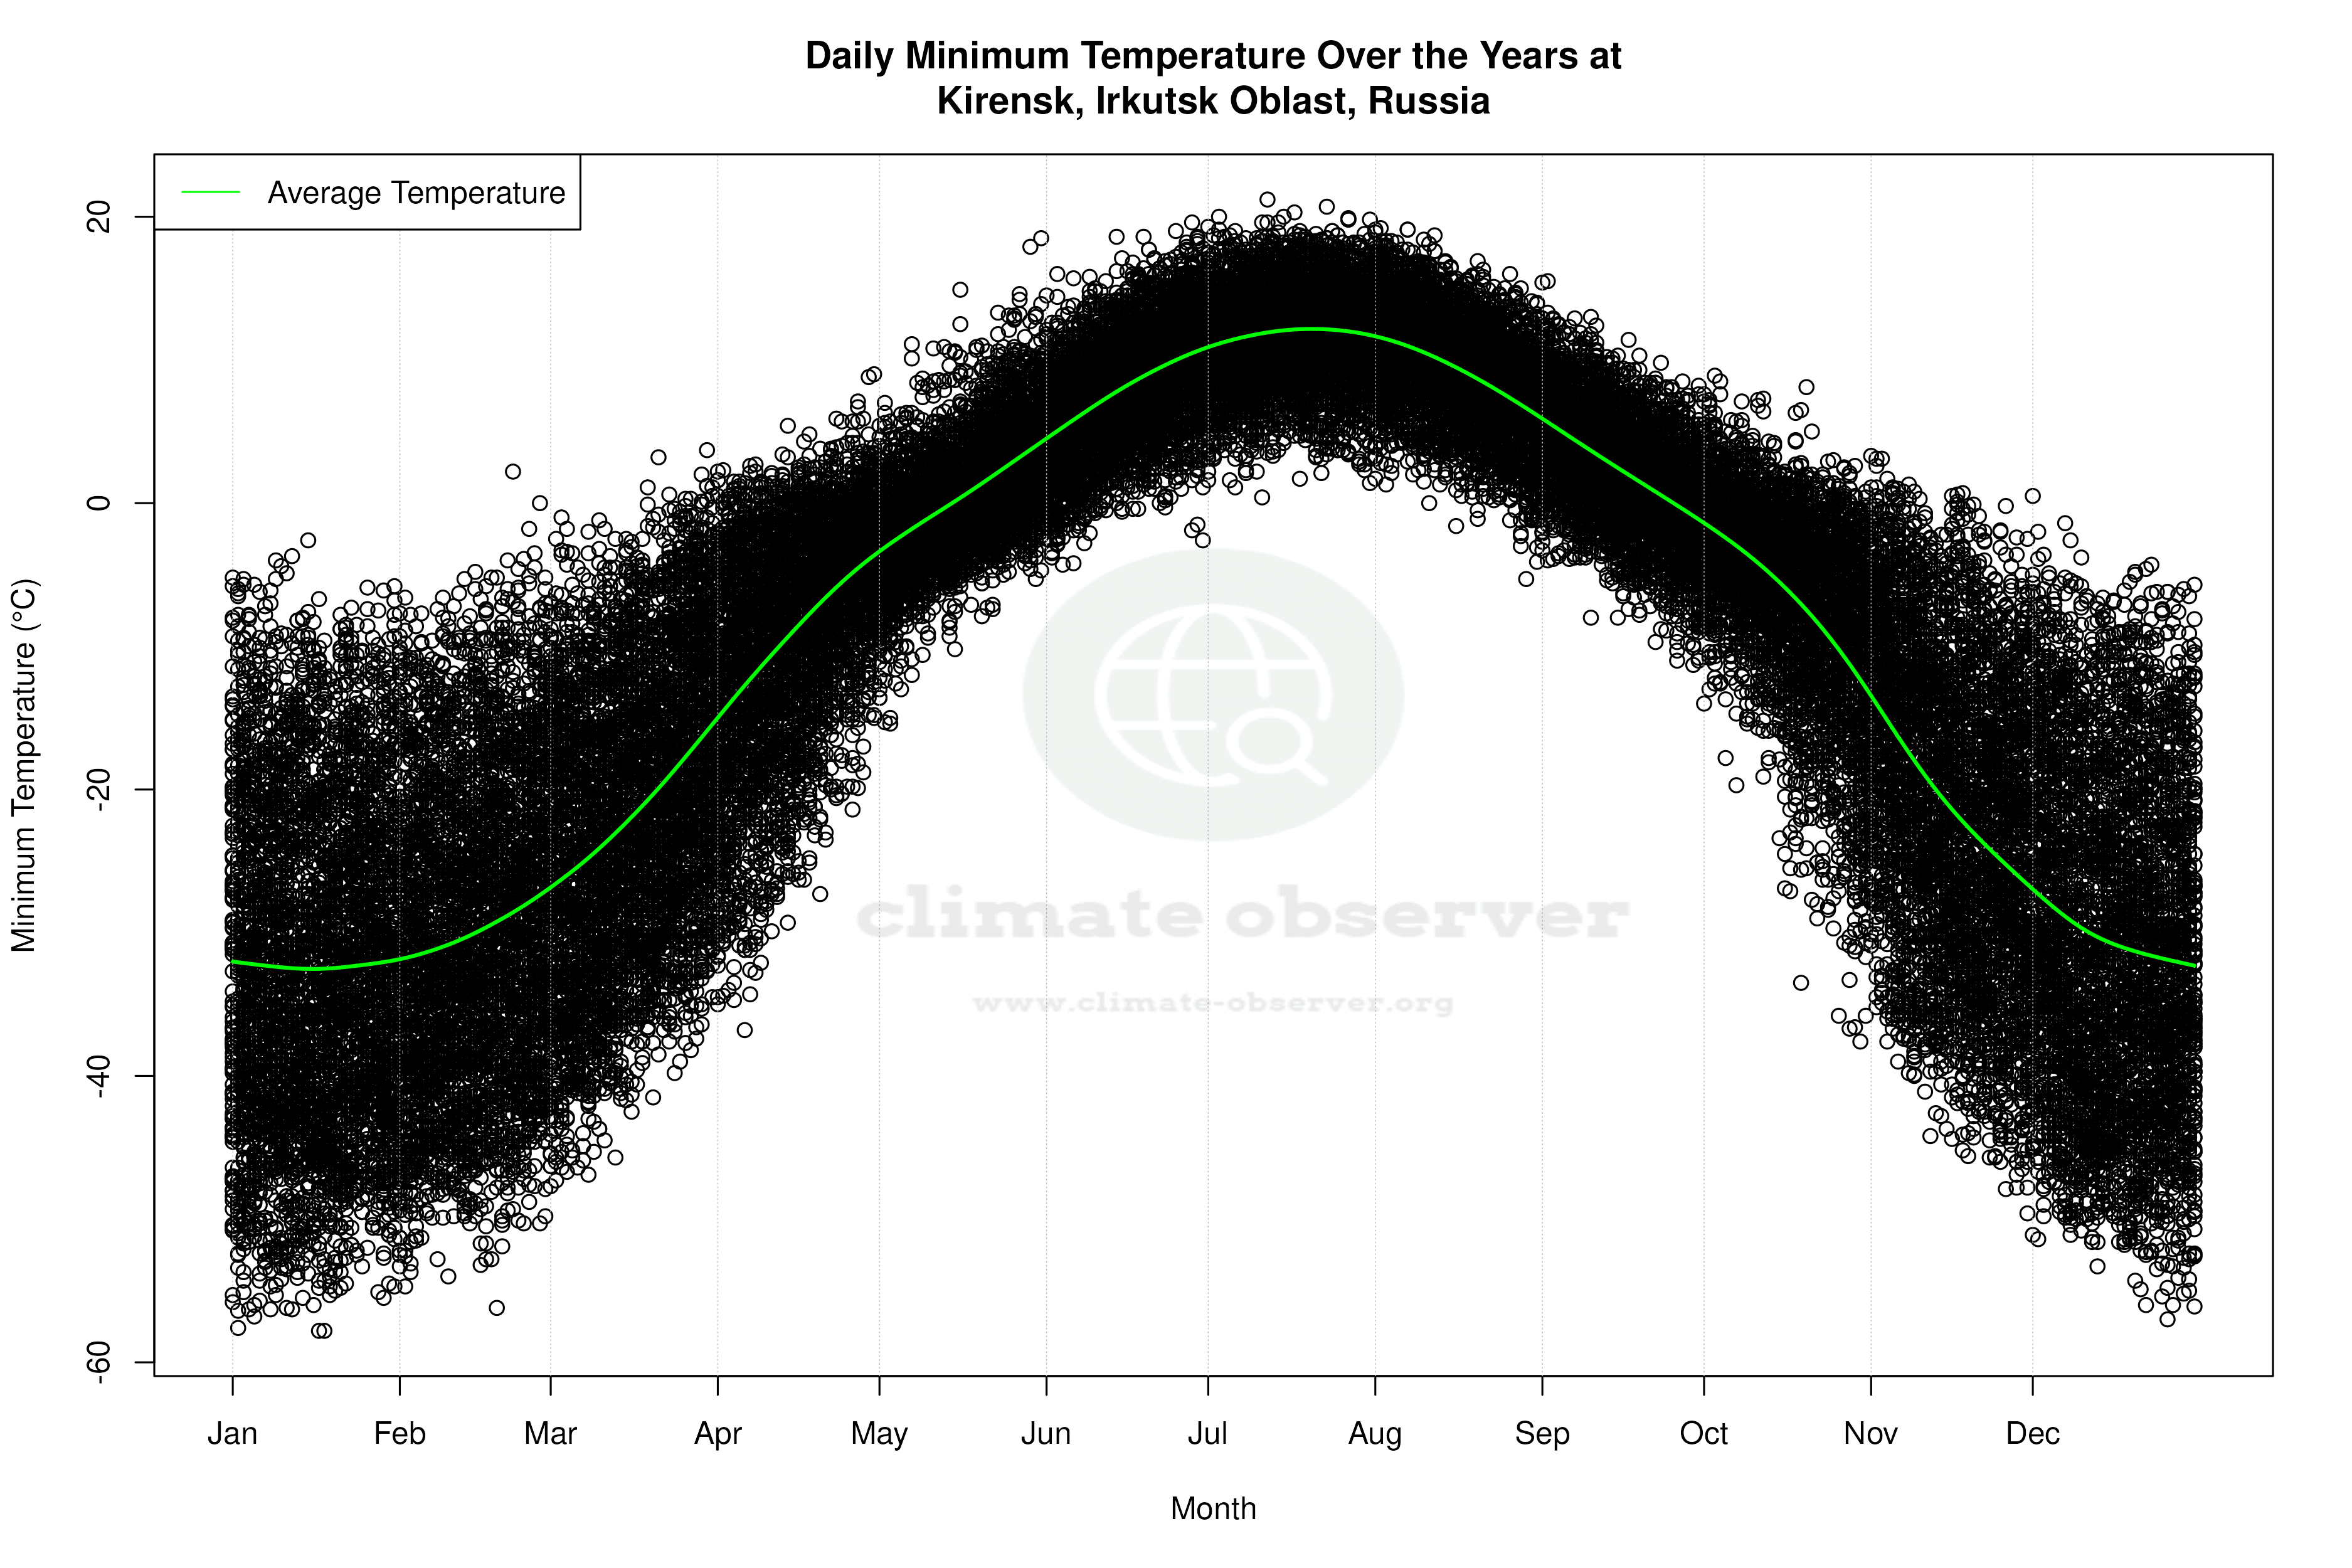
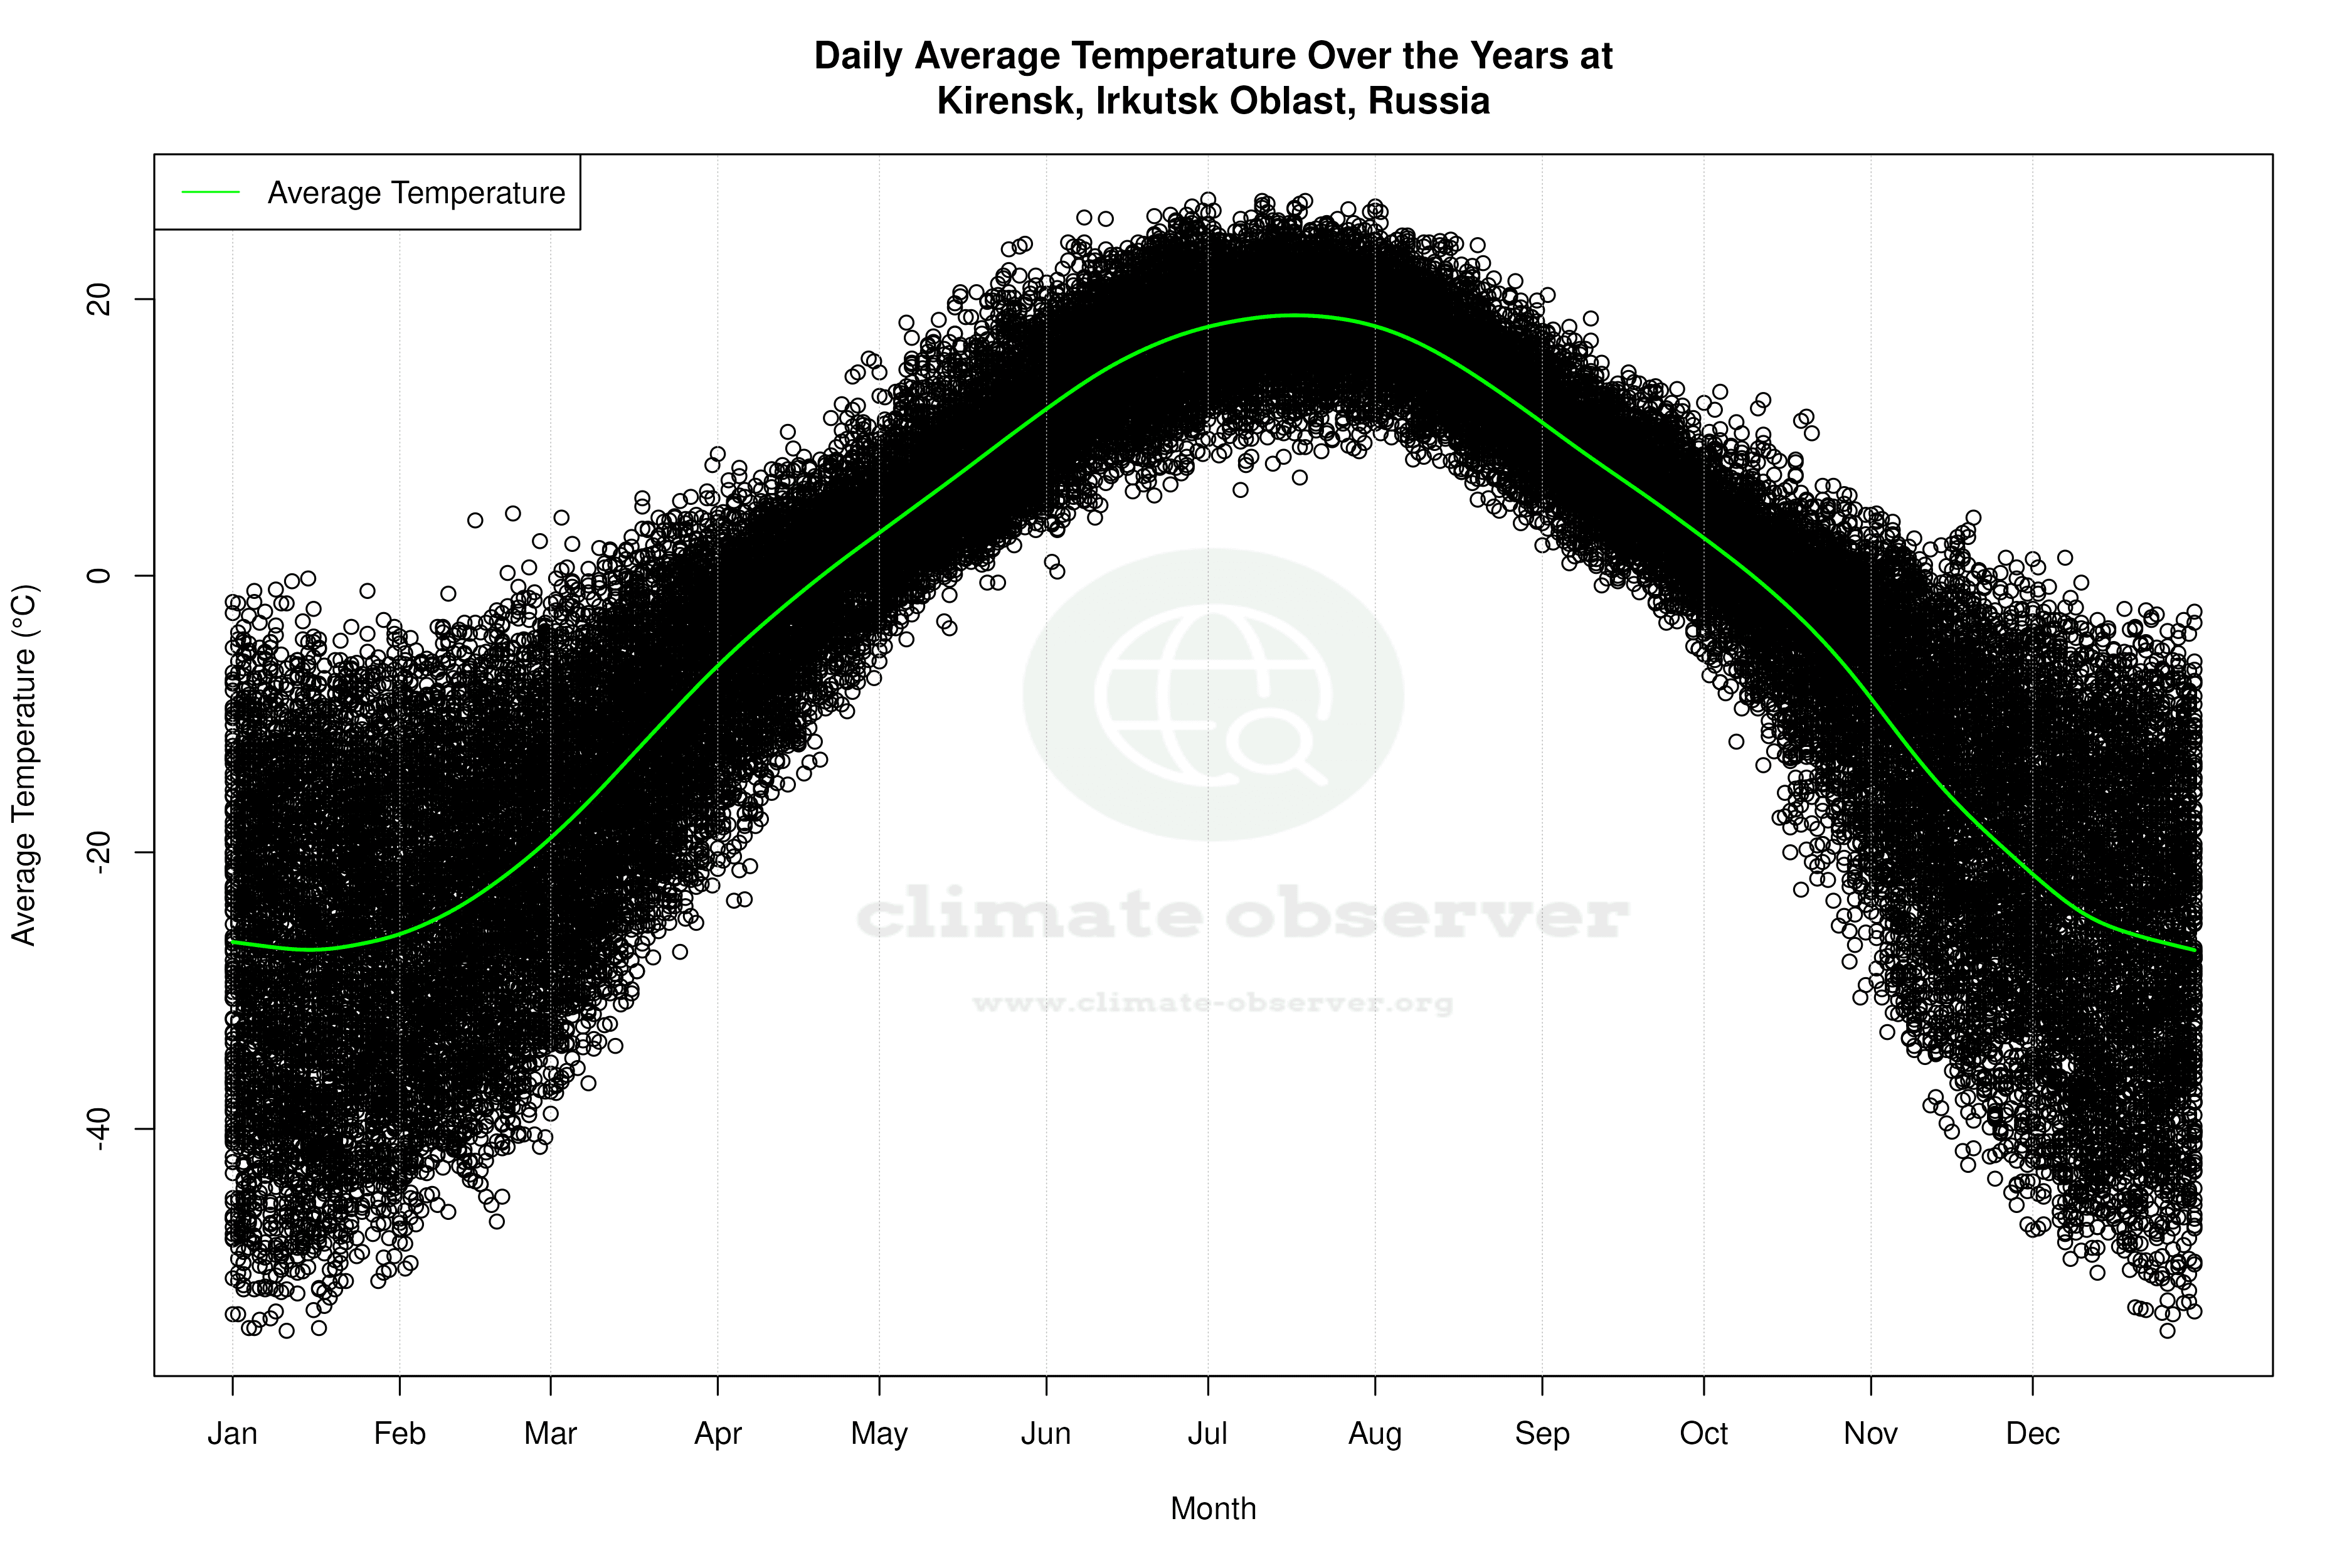


Average Max Temperature Throughout Year | 1 of 5
