Climate for Station: Ulan-Ude, Buryatia Republic, Russia
Loading live weather...
Climate Analysis & Overview
Ulan-Ude, situated in the heart of Siberia, exhibits a complex climate profile characterized by a historical warming trend, yet recent cooling in both high and low temperatures. The precipitation patterns have marginally shifted towards more concentrated events, reflecting subtle changes in the region's hydrological dynamics.
Siberian Thermal Dynamics
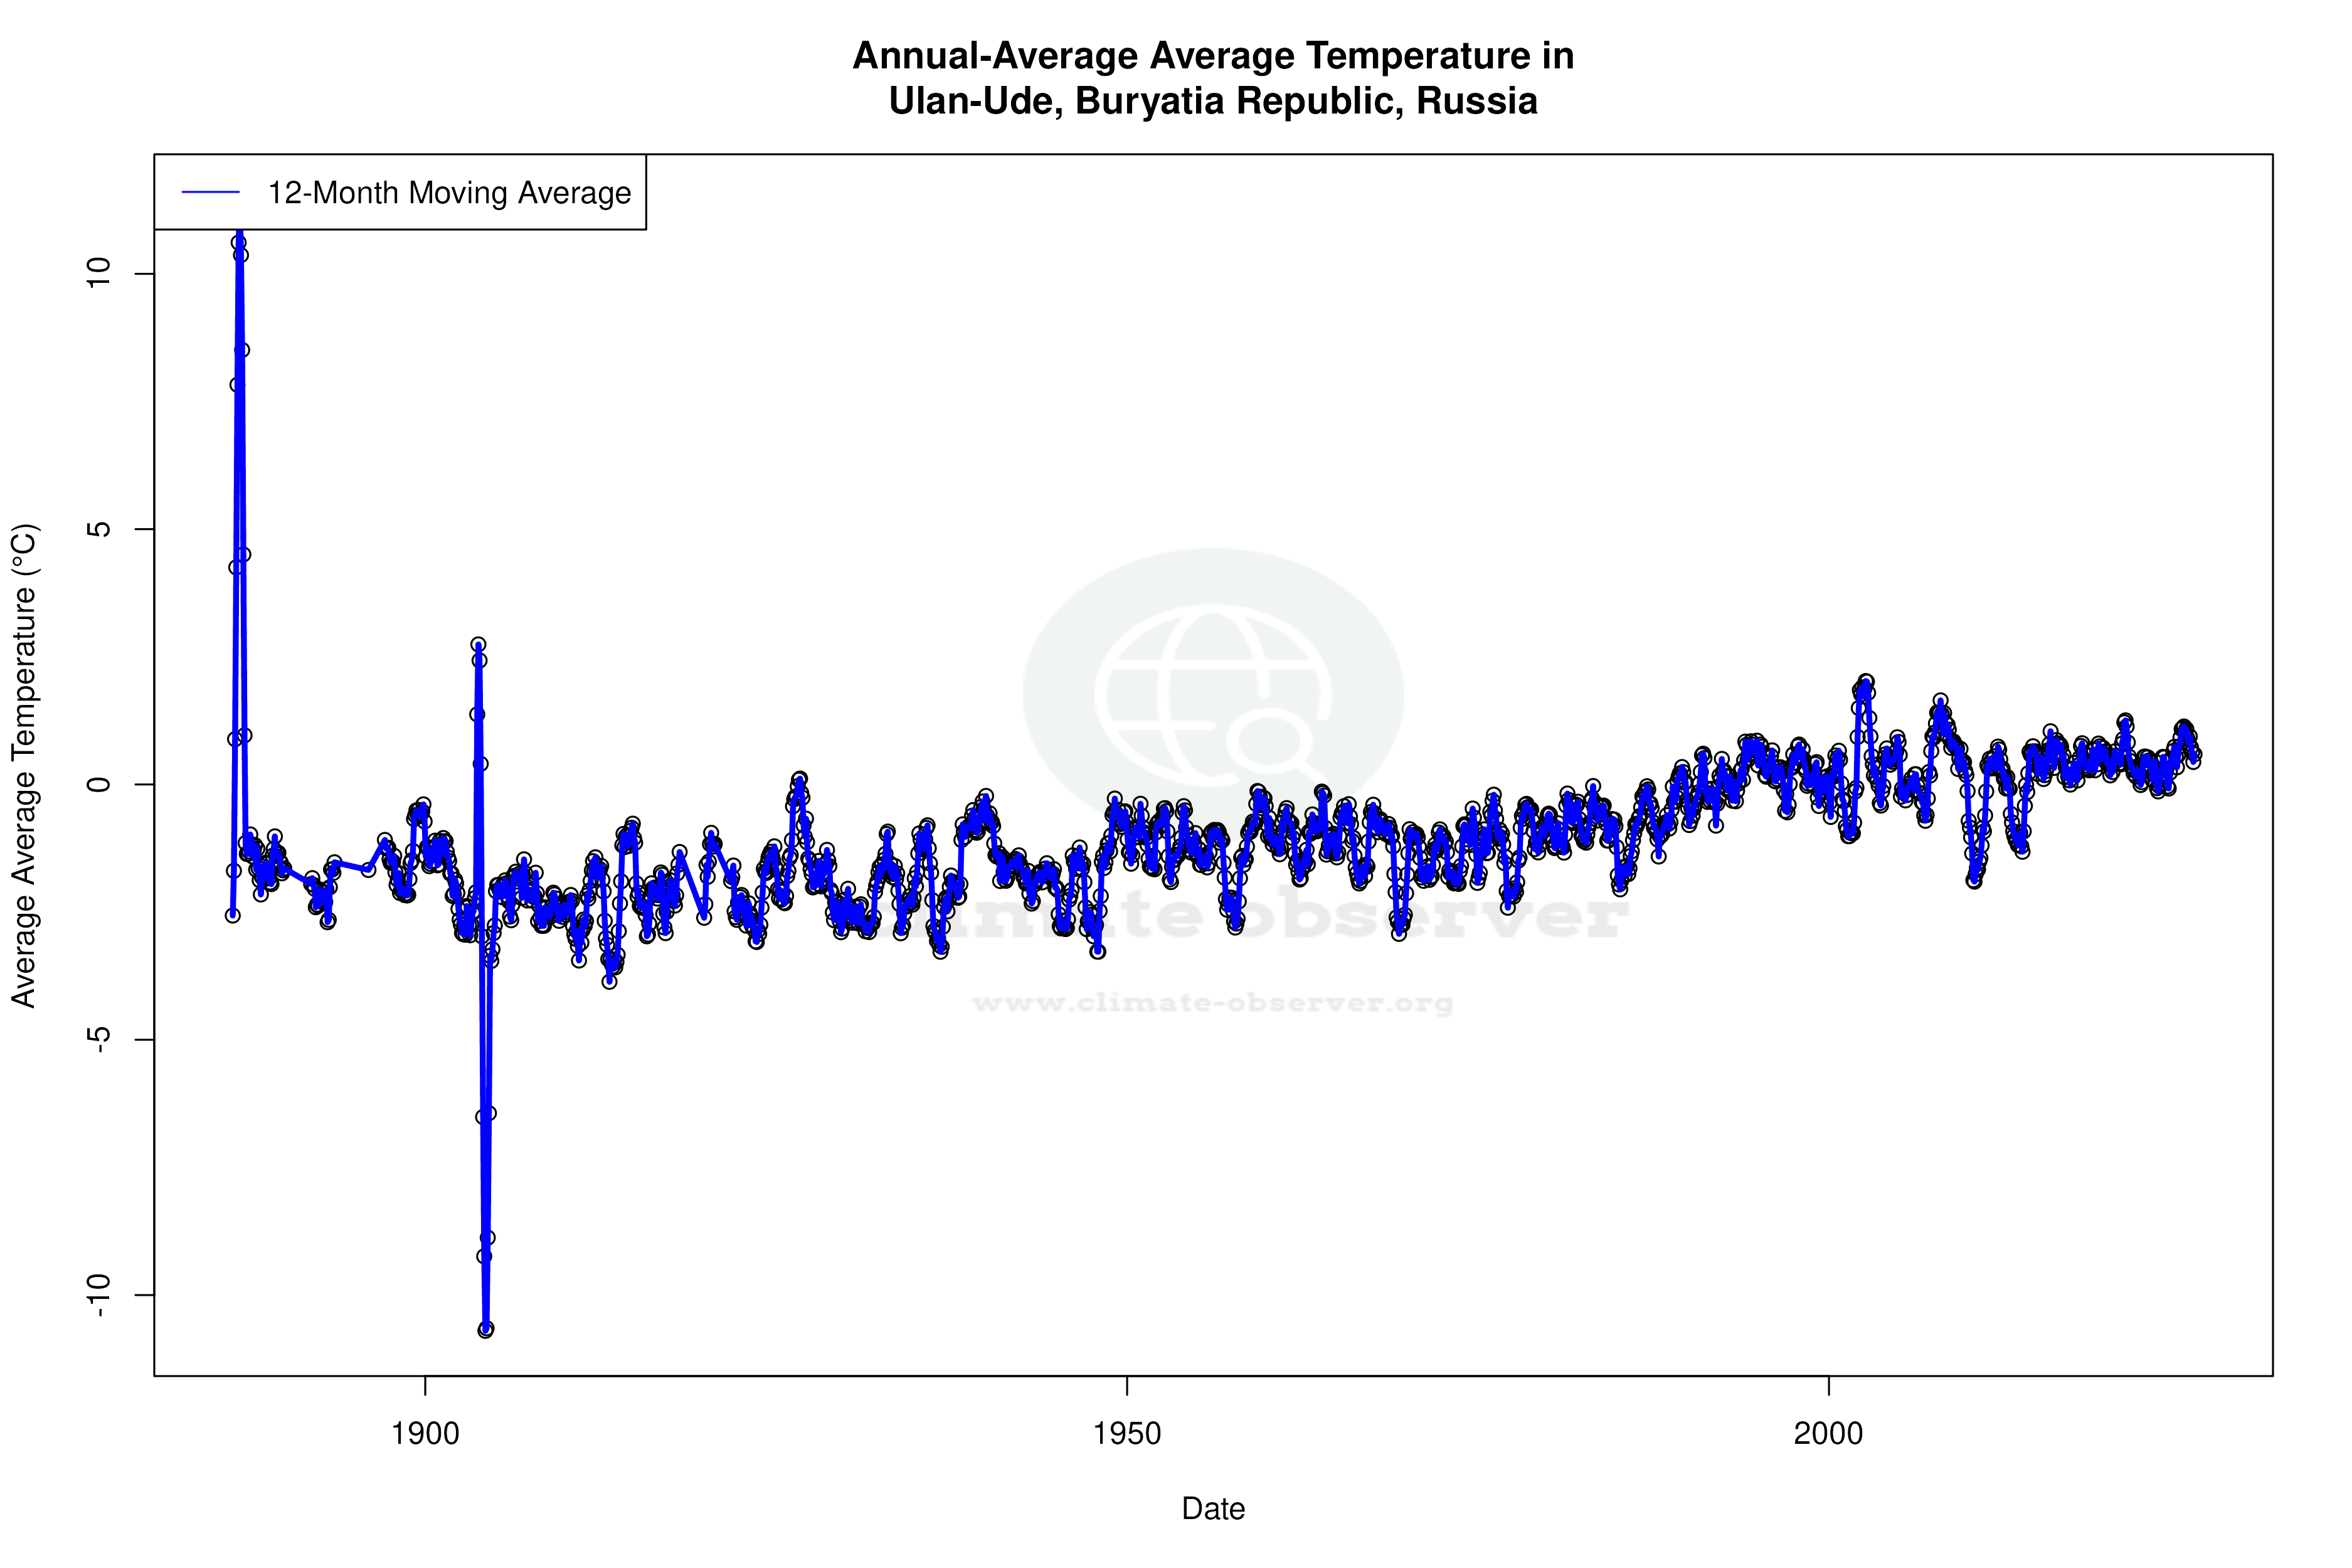
Ulan-Ude, located at 51.8331°N, 107.6°E, falls under the Köppen climate classification of Dwb, indicating a humid continental climate with dry winters and warm summers. The city's geographical setting, nestled between the Sayan and Yablonoi mountain ranges and near the Selenga River, significantly influences its climate patterns. Over the long term, the region has experienced a warming trend, with all-time highs rising by 0.25°C (0.45°F) and lows by 0.37°C (0.67°F). However, the past decade tells a different story, with a cooling trend observed in both high temperatures, decreasing by 0.32°C (0.58°F), and lows by a more pronounced 1.47°C (2.65°F).
Temperature Extremes and Records
Ulan-Ude's climate is marked by extreme temperature records, reflecting its continental nature. The all-time maximum temperature recorded is a scorching 40.6°C (105.1°F), while the minimum plummets to a frigid -54.4°C (-65.9°F). These extremes underscore the region's significant thermal variability, influenced by its inland location and elevation.
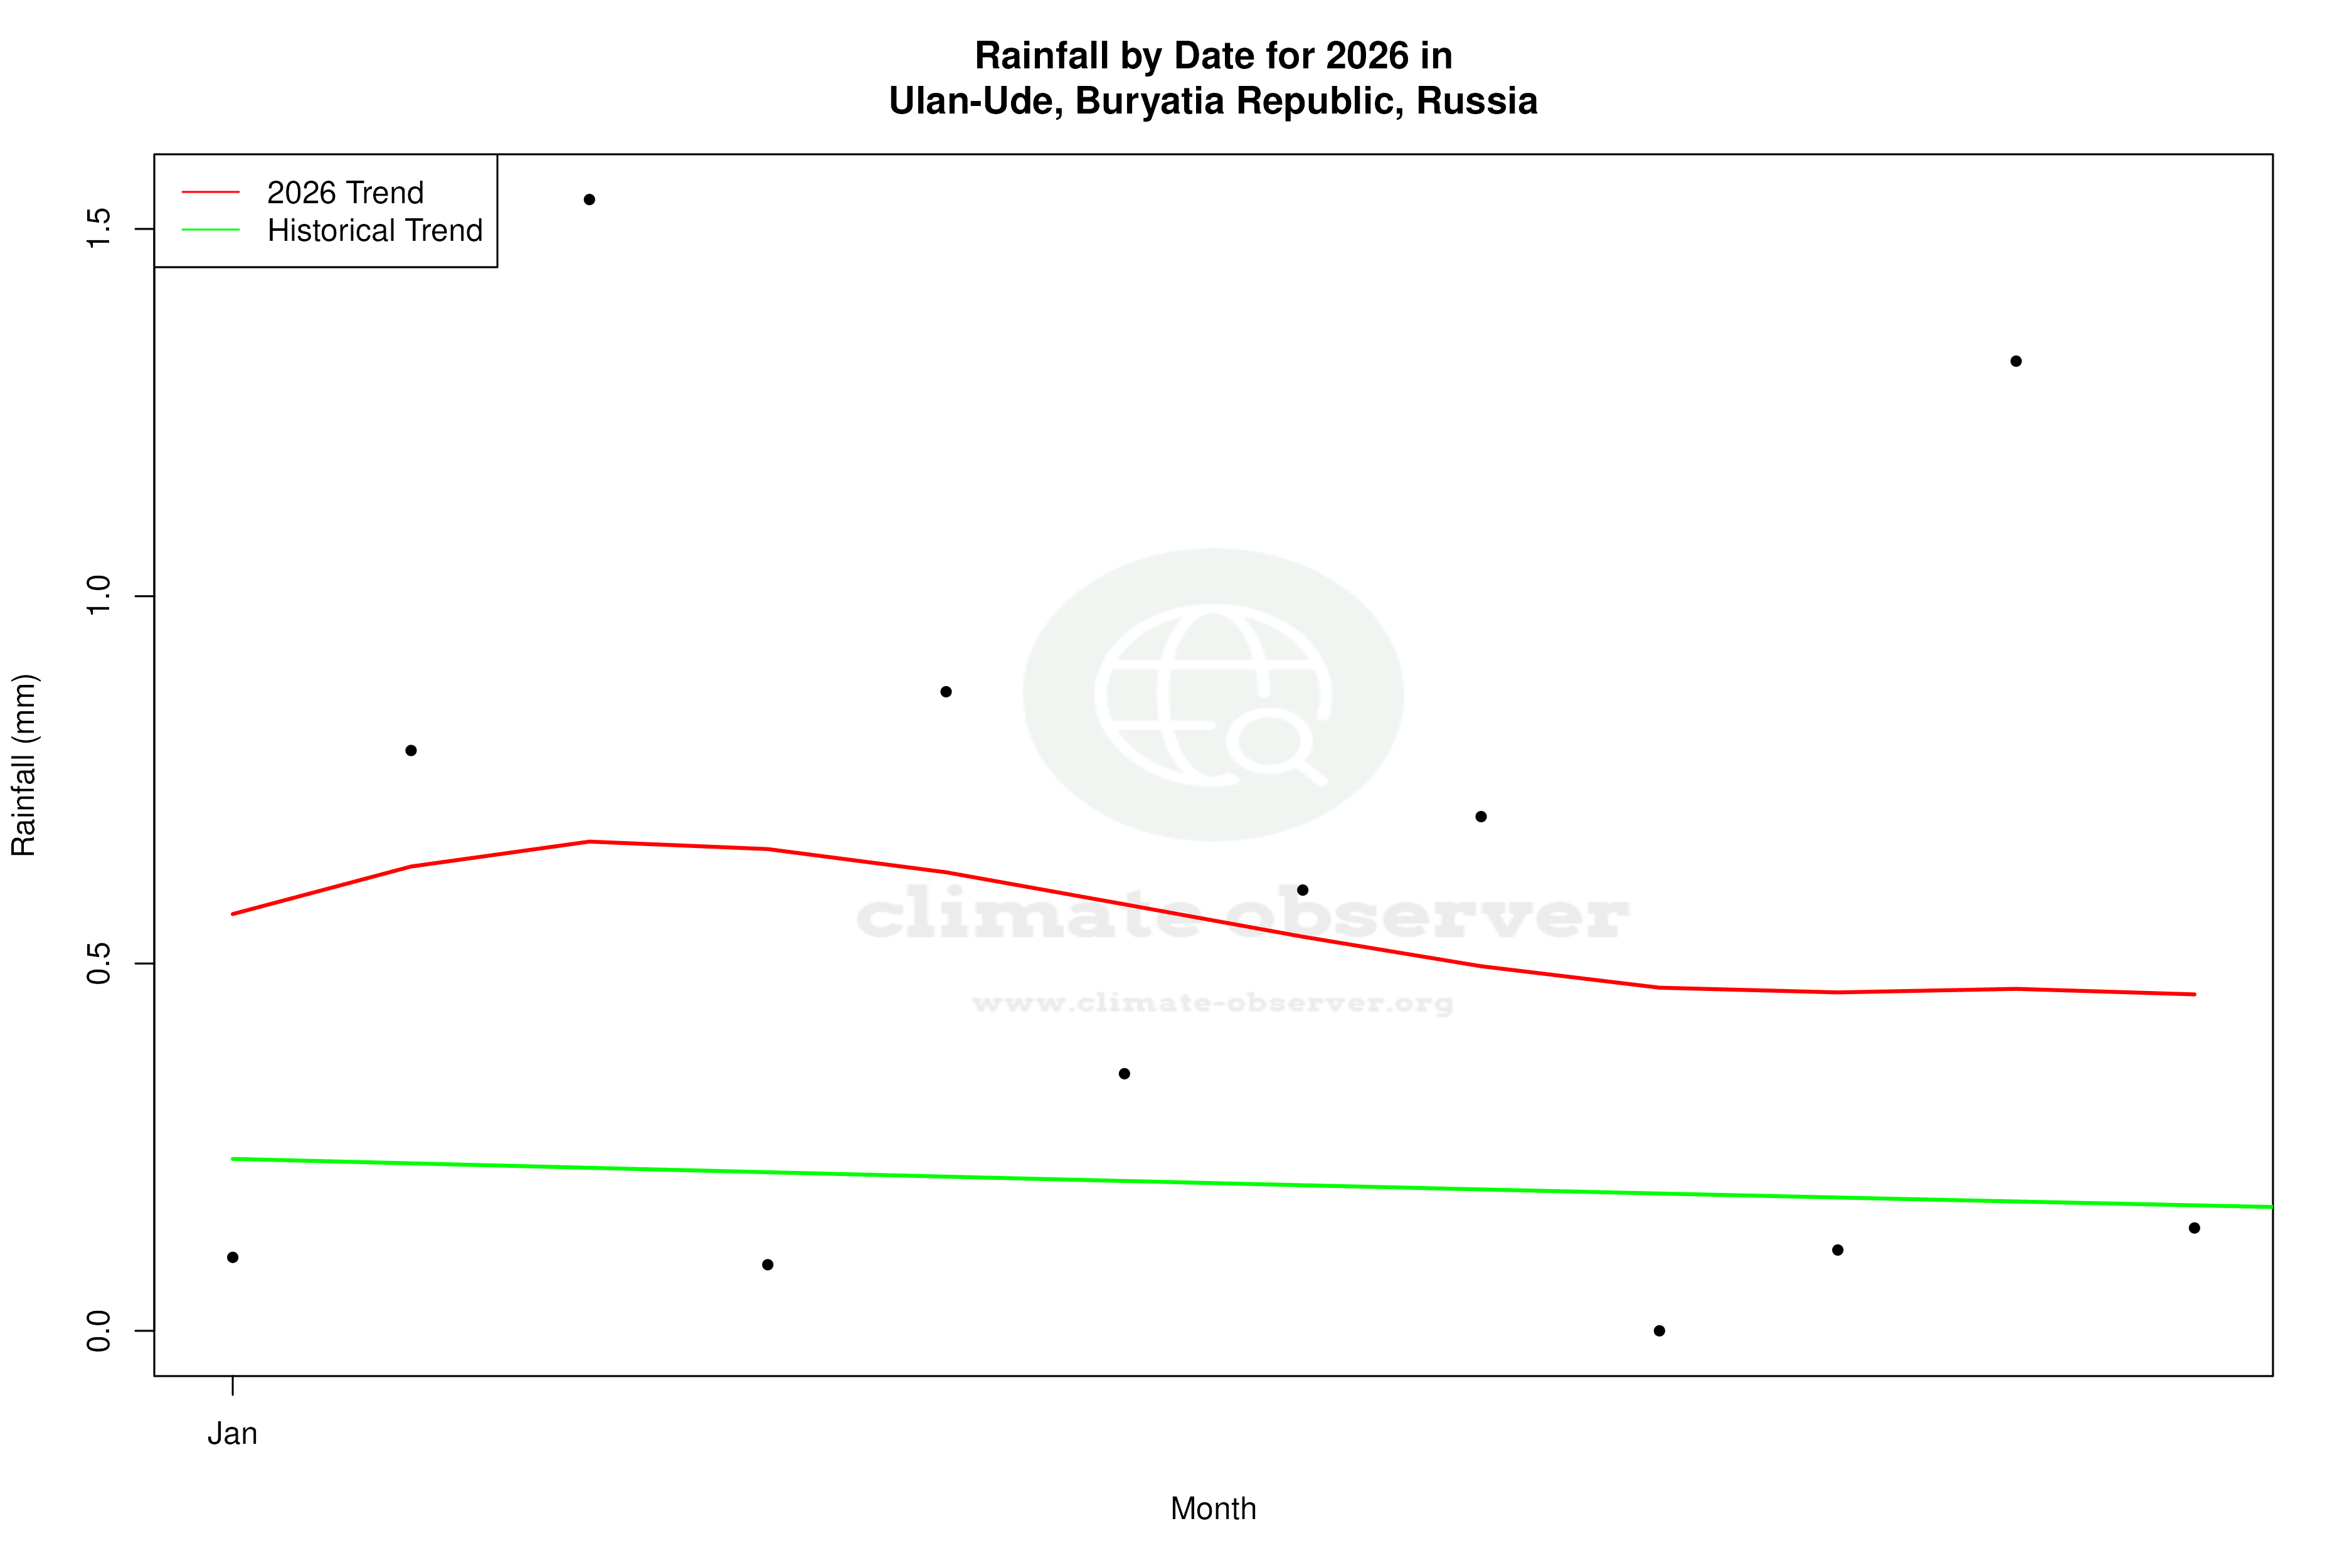
Precipitation Patterns and Concentration
The Precipitation Concentration Index (PCI) provides insight into how rainfall is distributed over time. Ulan-Ude's PCI has seen a slight increase from a baseline of 15.71 to 15.90, indicating a marginal shift towards more concentrated rainfall events. This suggests that precipitation is occurring in fewer, more intense events, although the overall change remains modest. Such patterns are crucial for understanding potential impacts on agriculture and water management in the region.
Regional Climate Context and Goals
Russia's broader climate objectives aim to mitigate the impacts of climate change while adapting to its inevitable consequences. In the context of Ulan-Ude, the observed climatic shifts, including the recent cooling trend and changes in precipitation concentration, are essential considerations for regional planning and resilience strategies. These trends could influence local agriculture, energy consumption, and infrastructure development.
Implications of Recent Weather Events
Recent weather anomalies, such as unexpected cold snaps or intense rainfall, align with the observed trends in Ulan-Ude's climate data. These events serve as a reminder of the region's vulnerability to climatic fluctuations and the importance of robust climate monitoring and adaptive strategies. Understanding the interplay between long-term warming and short-term cooling trends is vital for anticipating future climatic challenges in this Siberian locale.
Station Statistics
10-Year Trend
High: -1.13 °F/decade
Low: -2.78 °F/decade
Rain: +0.019 in/decade
25-Year Trend
High: +0.04 °F/decade
Low: -0.60 °F/decade
Rain: +0.003 in/decade
50-Year Trend
High: +0.54 °F/decade
Low: +0.40 °F/decade
Rain: +0.001 in/decade
All-Time Trend
High: +0.39 °F/decade
Low: +0.67 °F/decade
Rain: +0.000 in/decade
Percentage Above-Average Days
Last 12 Months: 44.5%
This Year: 36.2%
Precipitation Concentration Index (PCI) ℹ️
Last 12 Months: 21.3
Historical Average: 20.6
Percentile Rank of Last 12 Months ℹ️
High: 75th percentile
Low: 65th percentile
Rain: 89th percentile
Change in Variance ℹ️
High: -1.0%
Low: -4.0%
Intraday: -5.5%
Data Coverage
90.8%
First Year of Data
1886
Station Location
Historical Weather Records
| Max High | Avg High | Min High | Max Avg | Avg Avg | Min Avg | Max Low | Avg Low | Min Low | Max Precipitation | Avg Precipitation | Max Snow | Avg Snow | |
|---|---|---|---|---|---|---|---|---|---|---|---|---|---|
| Record | 105.08 °F | — | -33.34 °F | 88.88 °F | — | -52.24 °F | 73.94 °F | — | -65.92 °F | 3.63 in | — | — | — |
| January | 31.28 °F | -1.11 °F | -31.54 °F | 28.76 °F | -12.20 °F | -52.24 °F | 19.76 °F | -20.96 °F | -65.92 °F | 0.27 in | 0.01 in | — | — |
| February | 47.12 °F | 9.22 °F | -23.80 °F | 37.94 °F | -4.56 °F | -37.84 °F | 31.82 °F | -15.89 °F | -48.82 °F | 0.23 in | 0.00 in | — | — |
| March | 66.20 °F | 29.60 °F | -4.90 °F | 47.66 °F | 14.97 °F | -22.18 °F | 39.92 °F | 2.44 °F | -40.72 °F | 0.48 in | 0.00 in | — | — |
| April | 83.66 °F | 48.43 °F | 12.20 °F | 66.02 °F | 35.13 °F | 2.66 °F | 52.88 °F | 23.38 °F | -15.88 °F | 0.69 in | 0.01 in | — | — |
| May | 96.08 °F | 63.68 °F | 32.54 °F | 76.46 °F | 49.39 °F | 24.62 °F | 61.70 °F | 35.42 °F | 4.82 °F | 1.11 in | 0.02 in | — | — |
| June | 104.00 °F | 75.82 °F | 39.38 °F | 85.46 °F | 62.24 °F | 35.06 °F | 73.22 °F | 48.72 °F | 24.98 °F | 2.38 in | 0.05 in | — | — |
| July | 105.08 °F | 79.46 °F | 48.74 °F | 88.88 °F | 67.36 °F | 42.98 °F | 73.58 °F | 55.91 °F | 34.16 °F | 3.63 in | 0.09 in | — | — |
| August | 103.46 °F | 74.33 °F | 46.04 °F | 84.02 °F | 62.25 °F | 40.64 °F | 73.94 °F | 51.67 °F | 24.80 °F | 2.16 in | 0.08 in | — | — |
| September | 89.96 °F | 61.18 °F | 33.08 °F | 72.50 °F | 48.30 °F | 28.62 °F | 62.24 °F | 38.03 °F | 11.48 °F | 1.62 in | 0.04 in | — | — |
| October | 76.46 °F | 44.05 °F | 10.40 °F | 59.00 °F | 31.82 °F | -6.34 °F | 48.74 °F | 22.60 °F | -18.22 °F | 1.09 in | 0.01 in | — | — |
| November | 52.34 °F | 21.42 °F | -12.28 °F | 42.08 °F | 10.88 °F | -23.08 °F | 35.06 °F | 2.14 °F | -36.40 °F | 1.11 in | 0.01 in | — | — |
| December | 41.36 °F | 4.44 °F | -33.34 °F | 30.74 °F | -5.19 °F | -45.40 °F | 26.42 °F | -13.63 °F | -55.84 °F | 0.40 in | 0.01 in | — | — |
Data Visualisations
Remove WatermarksCurrent Year Climate Trends vs Historical


Max Temperature this Year | 1 of 6
Climate 12-Month Moving Averages


Max Temperature 12-Month MA | 1 of 6
Daily Data Points and Averages Throughout the Year

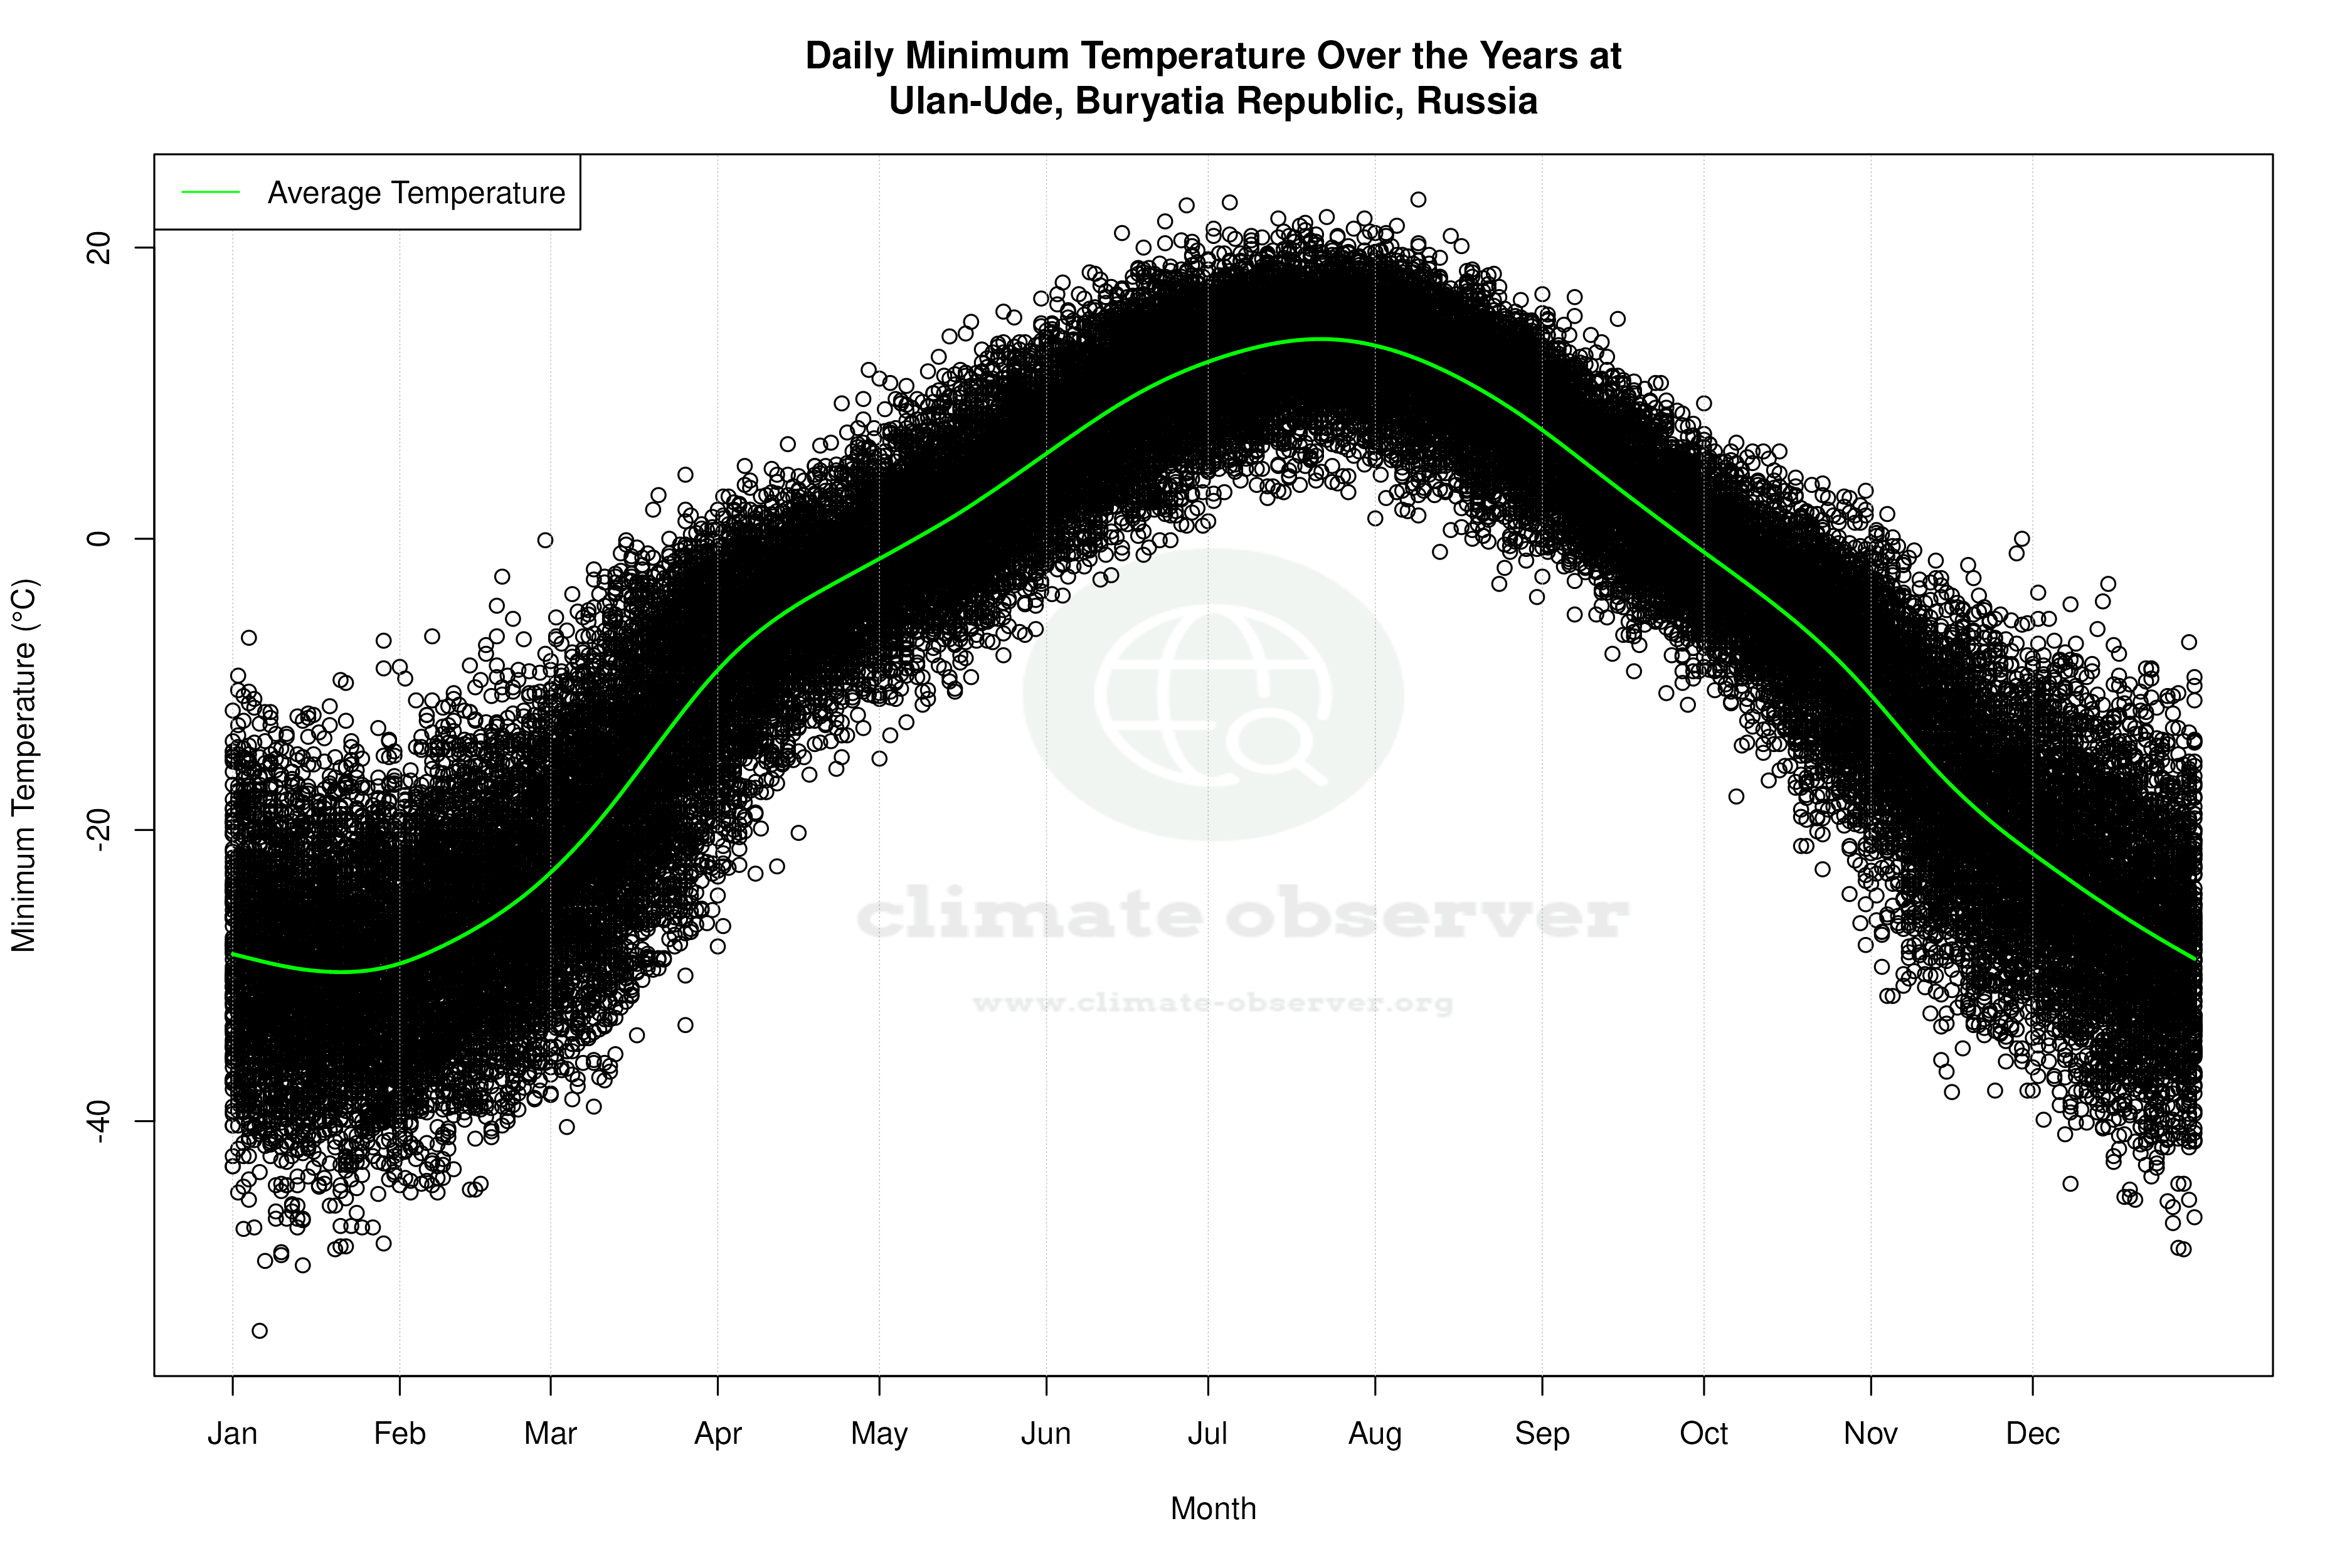

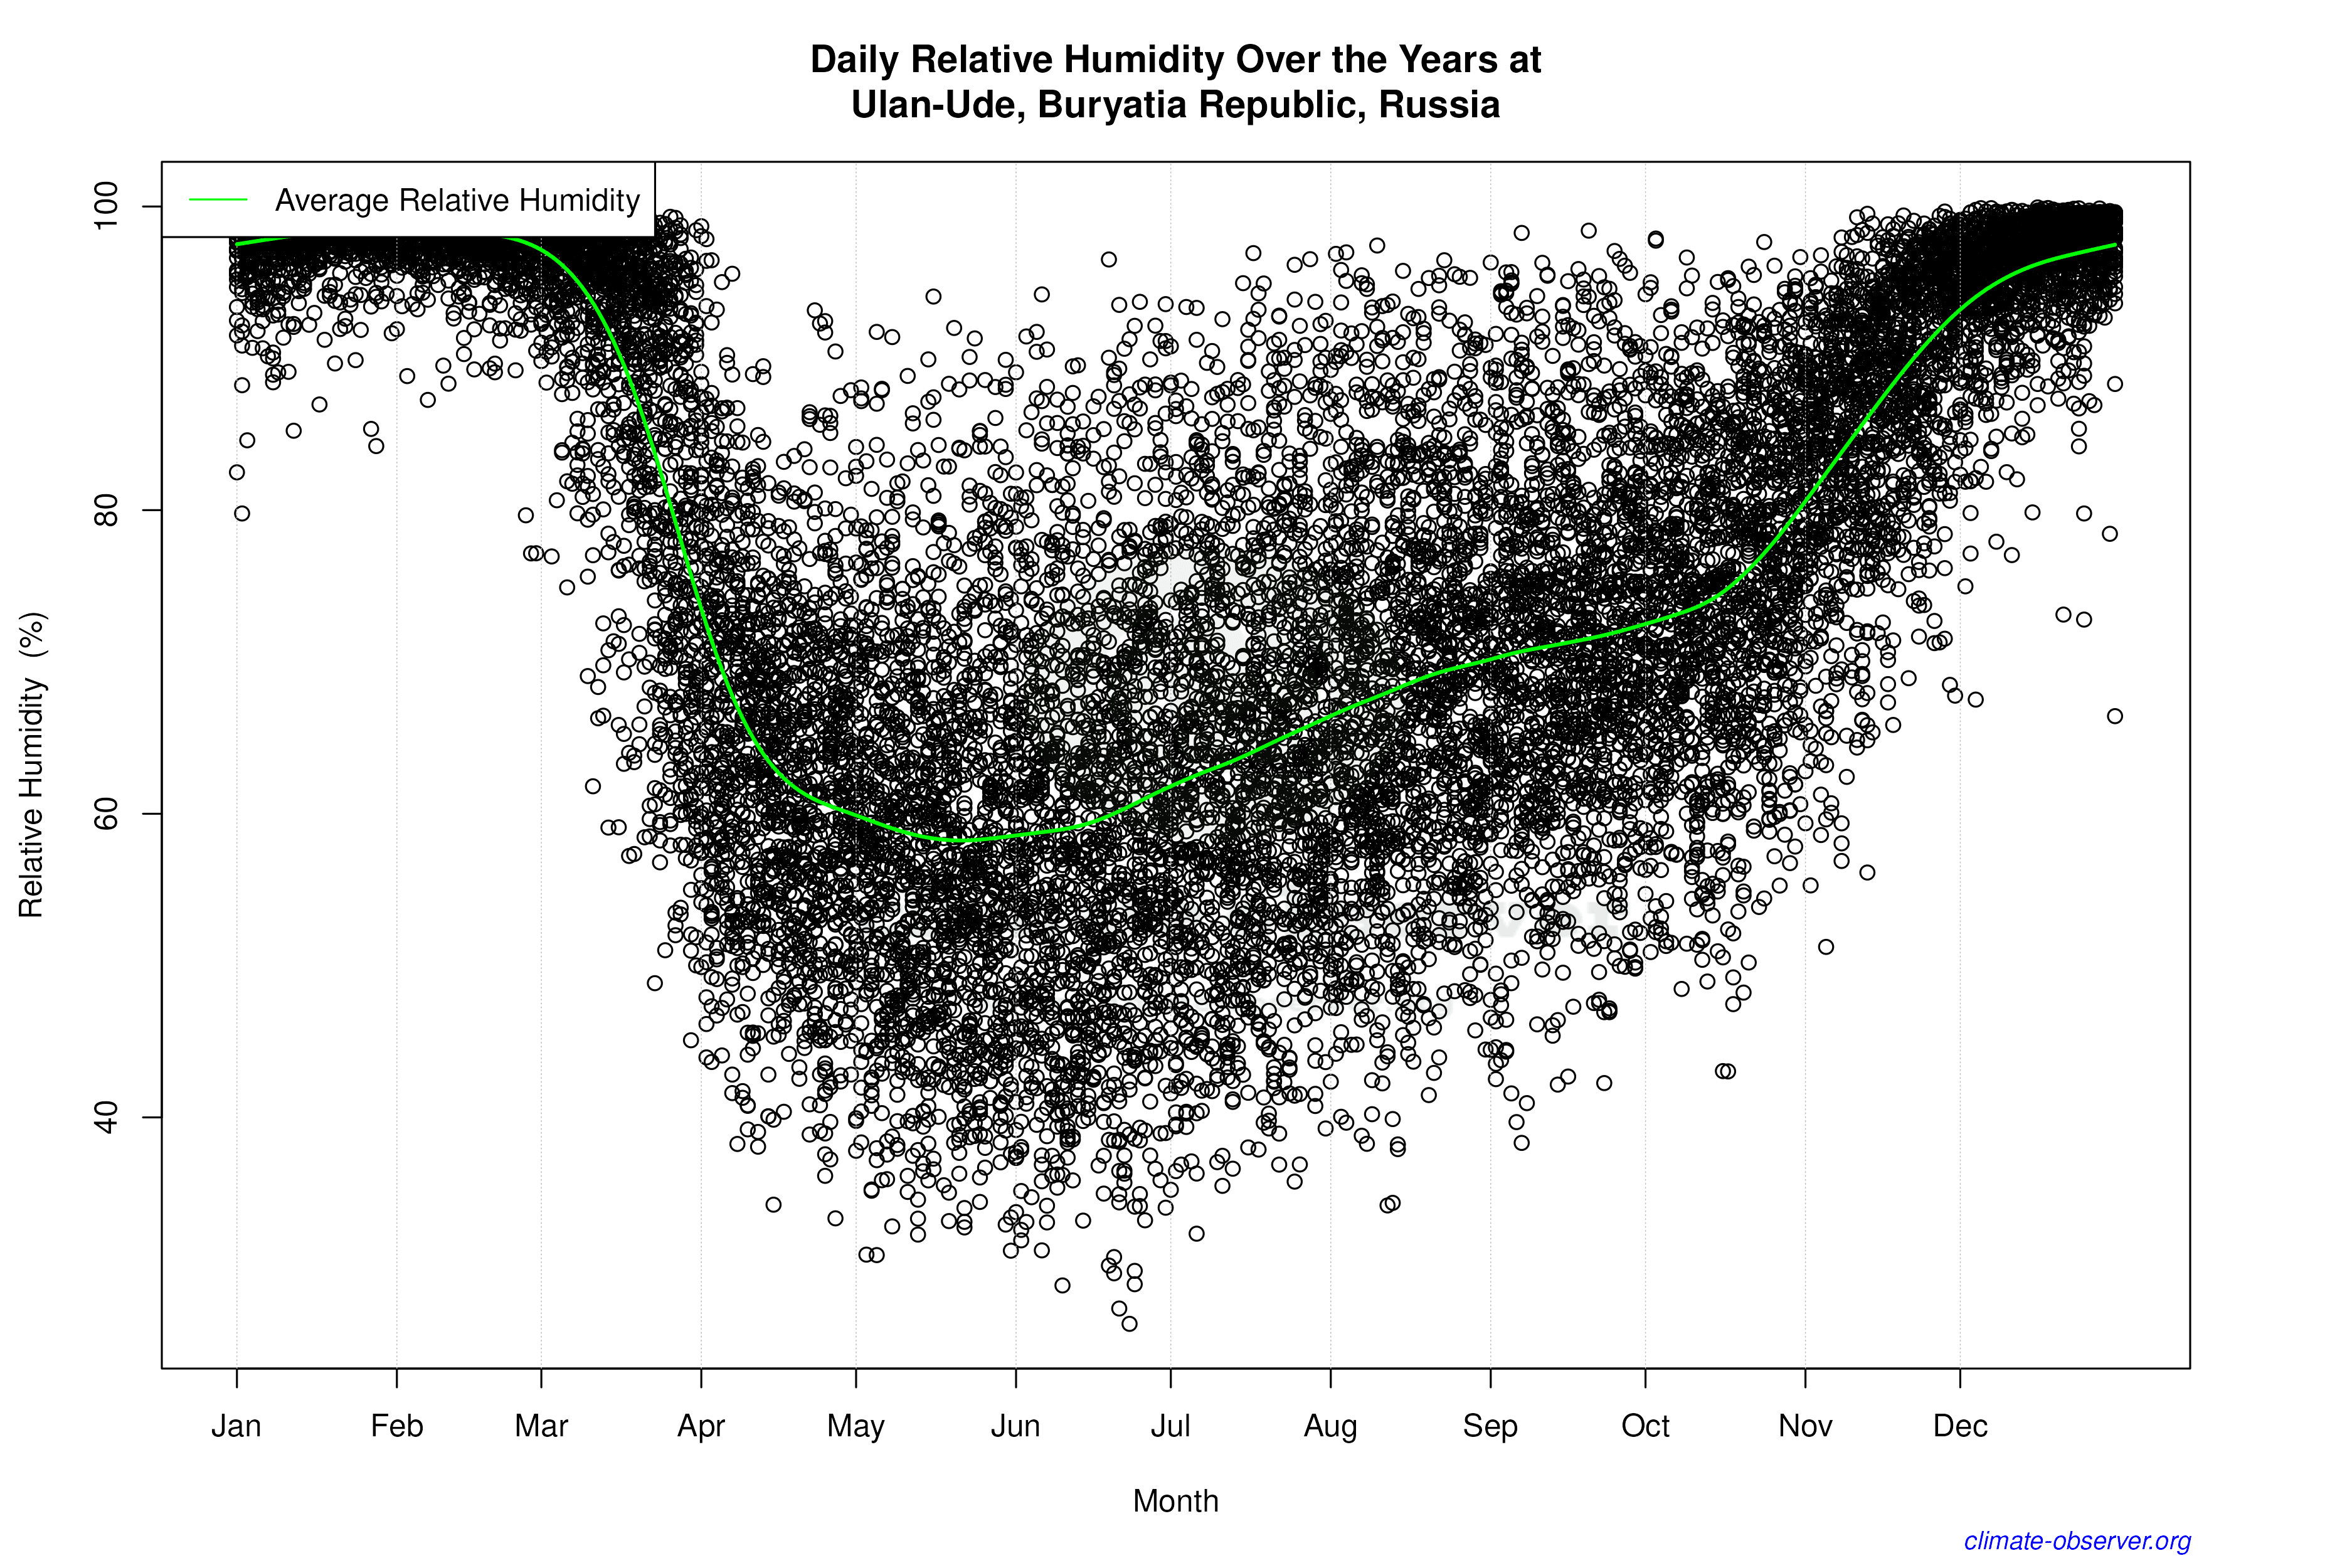

Average Max Temperature Throughout Year | 1 of 5
