Climate for Station: Vladivostok, Primorsky Krai, Russia
Loading live weather...
Climate Analysis & Overview
Vladivostok is experiencing a nuanced climate evolution, with a warming trend in high temperatures and a slight cooling in lows over the past decade. The all-time data reveals a steady warming pattern, while precipitation is becoming more evenly distributed. This aligns with Russia's climate mitigation goals amidst global changes.
Climatic Identity of Vladivostok
Vladivostok, located at 43.1167°N, 131.933°E, falls under the humid continental climate classification (Köppen: Dwb), characterised by cold, dry winters and warm, humid summers. The city’s proximity to the Sea of Japan influences its weather patterns, moderating temperatures and contributing to its unique climatic profile. The surrounding mountains and coastal geography play a significant role in shaping local weather, often leading to rapid changes in temperature and precipitation.
Temperature Trends: A Tale of Two Scales
Over the past decade, Vladivostok has witnessed a warming trend in high temperatures with an increase of 0.73°C (1.31°F). Conversely, the low temperatures have shown a slight cooling trend, decreasing by 0.39°C (0.70°F). However, when examining the all-time trends, both high and low temperatures have exhibited a warming pattern, with highs increasing by 0.15°C (0.27°F) and lows by 0.19°C (0.34°F). This long-term warming aligns with global patterns and Russia's regional climate goals, which aim to mitigate the effects of climate change through adaptation and emission reduction strategies.
Precipitation Patterns: A More Even Distribution
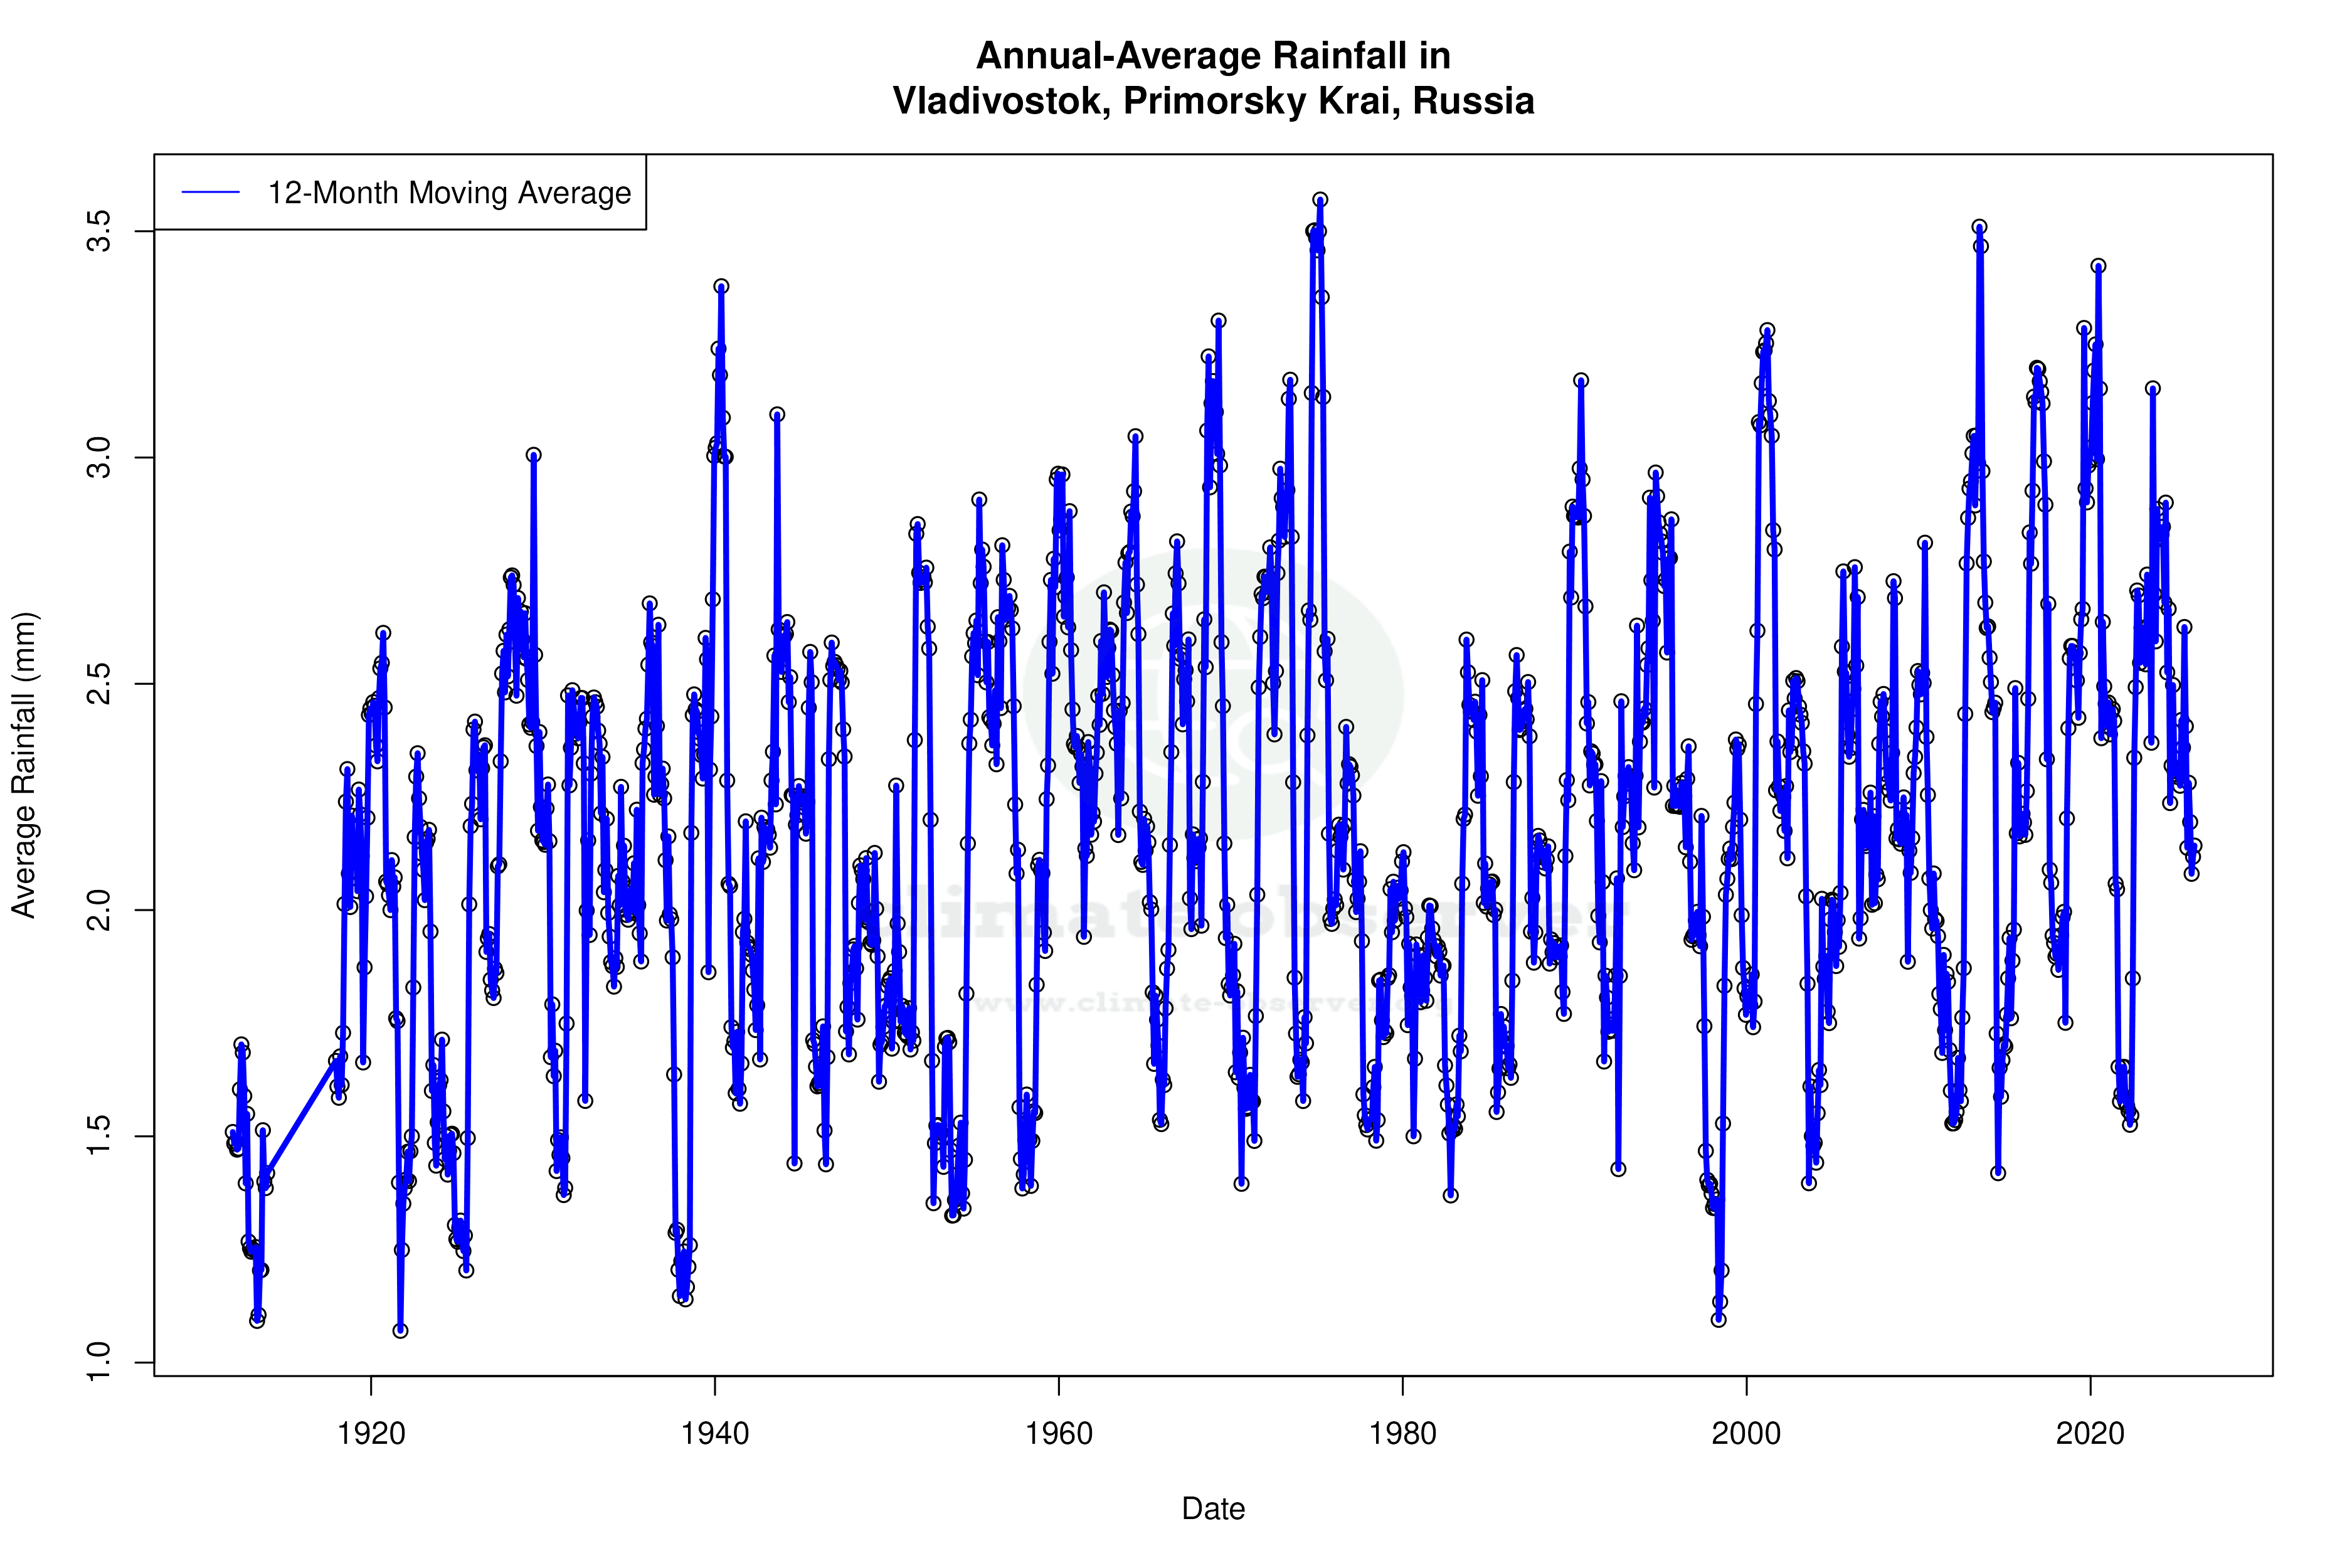
The Precipitation Concentration Index (PCI) for Vladivostok has decreased from a baseline of 16.6 to a current value of 14.6, indicating a more even distribution of precipitation events over time. This suggests that rainfall is becoming less concentrated in intense events, which could reduce the risk of flooding and soil erosion, benefiting both agriculture and urban infrastructure.
Temperature Extremes: Record Highs and Lows
Vladivostok's historical temperature records reflect its climatic extremes, with a maximum recorded temperature of 35.0°C (95.0°F) and a minimum of -39.7°C (-39.5°F). These extremes underscore the city's vulnerability to both heatwaves and severe cold spells, which are critical considerations for local infrastructure and public health planning.
Regional Climate Context and Future Outlook
The observed climate trends in Vladivostok are consistent with broader regional changes and Russia's commitment to addressing climate change. The city's evolving climate profile, marked by a warming trend and more evenly distributed precipitation, highlights the importance of continued monitoring and adaptation strategies to ensure resilience against future climatic shifts.
Station Statistics
10-Year Trend
High: +1.93 °F/decade
Low: -0.39 °F/decade
Rain: -0.016 in/decade
25-Year Trend
High: +0.49 °F/decade
Low: -0.13 °F/decade
Rain: +0.003 in/decade
50-Year Trend
High: +0.58 °F/decade
Low: +0.38 °F/decade
Rain: +0.004 in/decade
All-Time Trend
High: +0.32 °F/decade
Low: +0.44 °F/decade
Rain: +0.001 in/decade
Percentage Above-Average Days
Last 12 Months: 56.1%
This Year: 55.7%
Precipitation Concentration Index (PCI) ℹ️
Last 12 Months: 15.4
Historical Average: 17.1
Percentile Rank of Last 12 Months ℹ️
High: 97th percentile
Low: 78th percentile
Rain: 51st percentile
Change in Variance ℹ️
High: -1.0%
Low: +1.8%
Intraday: +56.2%
Data Coverage
96.1%
First Year of Data
1911
Station Location
Historical Weather Records
| Max High | Avg High | Min High | Max Avg | Avg Avg | Min Avg | Max Low | Avg Low | Min Low | Max Precipitation | Avg Precipitation | Max Snow | Avg Snow | |
|---|---|---|---|---|---|---|---|---|---|---|---|---|---|
| Record | 95.00 °F | — | -12.64 °F | 82.58 °F | — | -18.58 °F | 76.46 °F | — | -39.46 °F | 7.01 in | — | — | — |
| January | 41.00 °F | 15.83 °F | -12.64 °F | 34.34 °F | 8.35 °F | -18.58 °F | 30.02 °F | 1.40 °F | -39.46 °F | 1.91 in | 0.01 in | — | — |
| February | 50.00 °F | 22.48 °F | -8.50 °F | 42.08 °F | 14.68 °F | -14.08 °F | 35.42 °F | 7.63 °F | -38.56 °F | 1.42 in | 0.02 in | — | — |
| March | 66.92 °F | 35.14 °F | 9.50 °F | 51.62 °F | 27.70 °F | -0.40 °F | 48.38 °F | 21.53 °F | -21.10 °F | 2.02 in | 0.03 in | — | — |
| April | 81.86 °F | 48.73 °F | 28.04 °F | 63.68 °F | 40.45 °F | 23.90 °F | 53.60 °F | 34.67 °F | 10.22 °F | 2.71 in | 0.06 in | — | — |
| May | 86.00 °F | 58.20 °F | 35.60 °F | 75.74 °F | 49.44 °F | 33.80 °F | 67.28 °F | 43.66 °F | 28.76 °F | 3.46 in | 0.10 in | — | — |
| June | 89.24 °F | 63.43 °F | 42.44 °F | 80.06 °F | 56.20 °F | 40.64 °F | 71.60 °F | 51.64 °F | 33.62 °F | 5.41 in | 0.14 in | — | — |
| July | 92.48 °F | 70.56 °F | 51.80 °F | 82.58 °F | 64.36 °F | 50.00 °F | 75.92 °F | 60.42 °F | 47.66 °F | 4.23 in | 0.16 in | — | — |
| August | 95.00 °F | 74.22 °F | 56.66 °F | 81.50 °F | 68.17 °F | 48.38 °F | 76.46 °F | 64.04 °F | 43.34 °F | 6.02 in | 0.20 in | — | — |
| September | 86.00 °F | 67.80 °F | 49.28 °F | 77.00 °F | 60.88 °F | 43.16 °F | 70.34 °F | 55.25 °F | 25.88 °F | 7.01 in | 0.15 in | — | — |
| October | 78.80 °F | 55.36 °F | 27.86 °F | 64.22 °F | 48.14 °F | 21.02 °F | 62.24 °F | 41.90 °F | 8.96 °F | 5.60 in | 0.08 in | — | — |
| November | 63.50 °F | 37.43 °F | 6.62 °F | 53.96 °F | 30.35 °F | 1.76 °F | 52.16 °F | 24.53 °F | -16.06 °F | 5.01 in | 0.05 in | — | — |
| December | 66.74 °F | 21.45 °F | -8.50 °F | 42.08 °F | 14.62 °F | -9.76 °F | 38.84 °F | 8.26 °F | -36.94 °F | 3.11 in | 0.02 in | — | — |
Data Visualisations
Remove WatermarksCurrent Year Climate Trends vs Historical

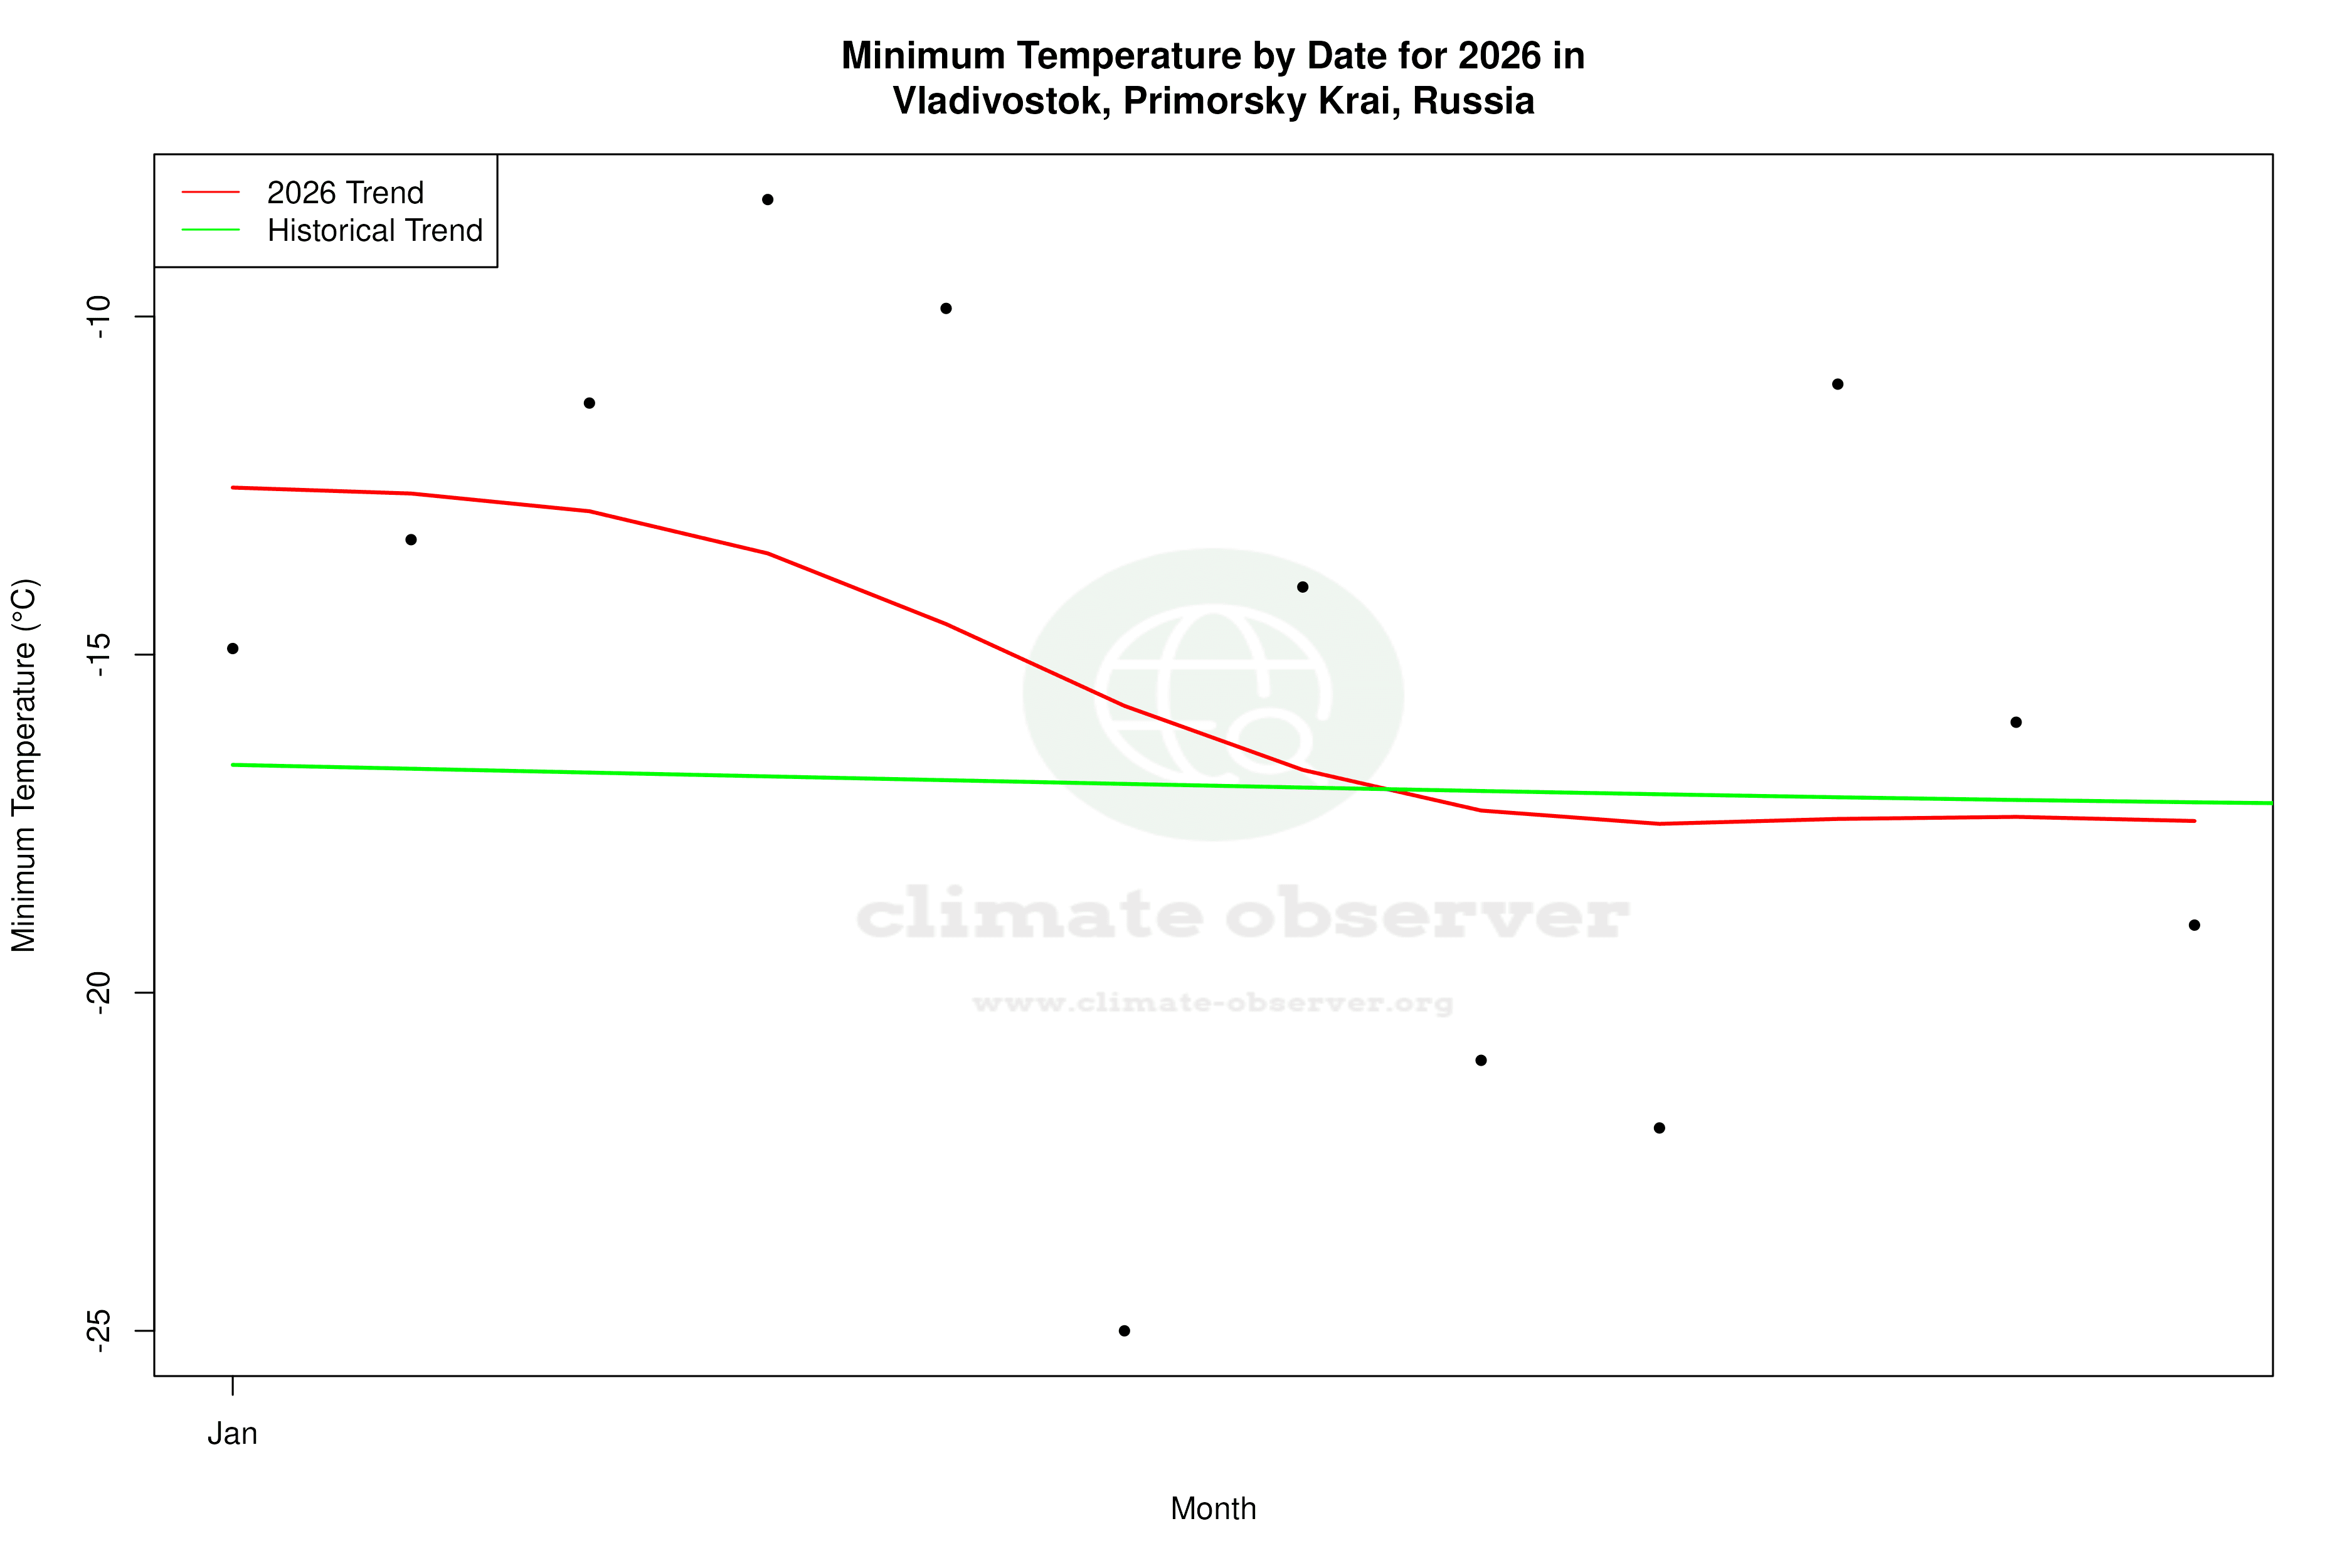


Max Temperature this Year | 1 of 6
Climate 12-Month Moving Averages
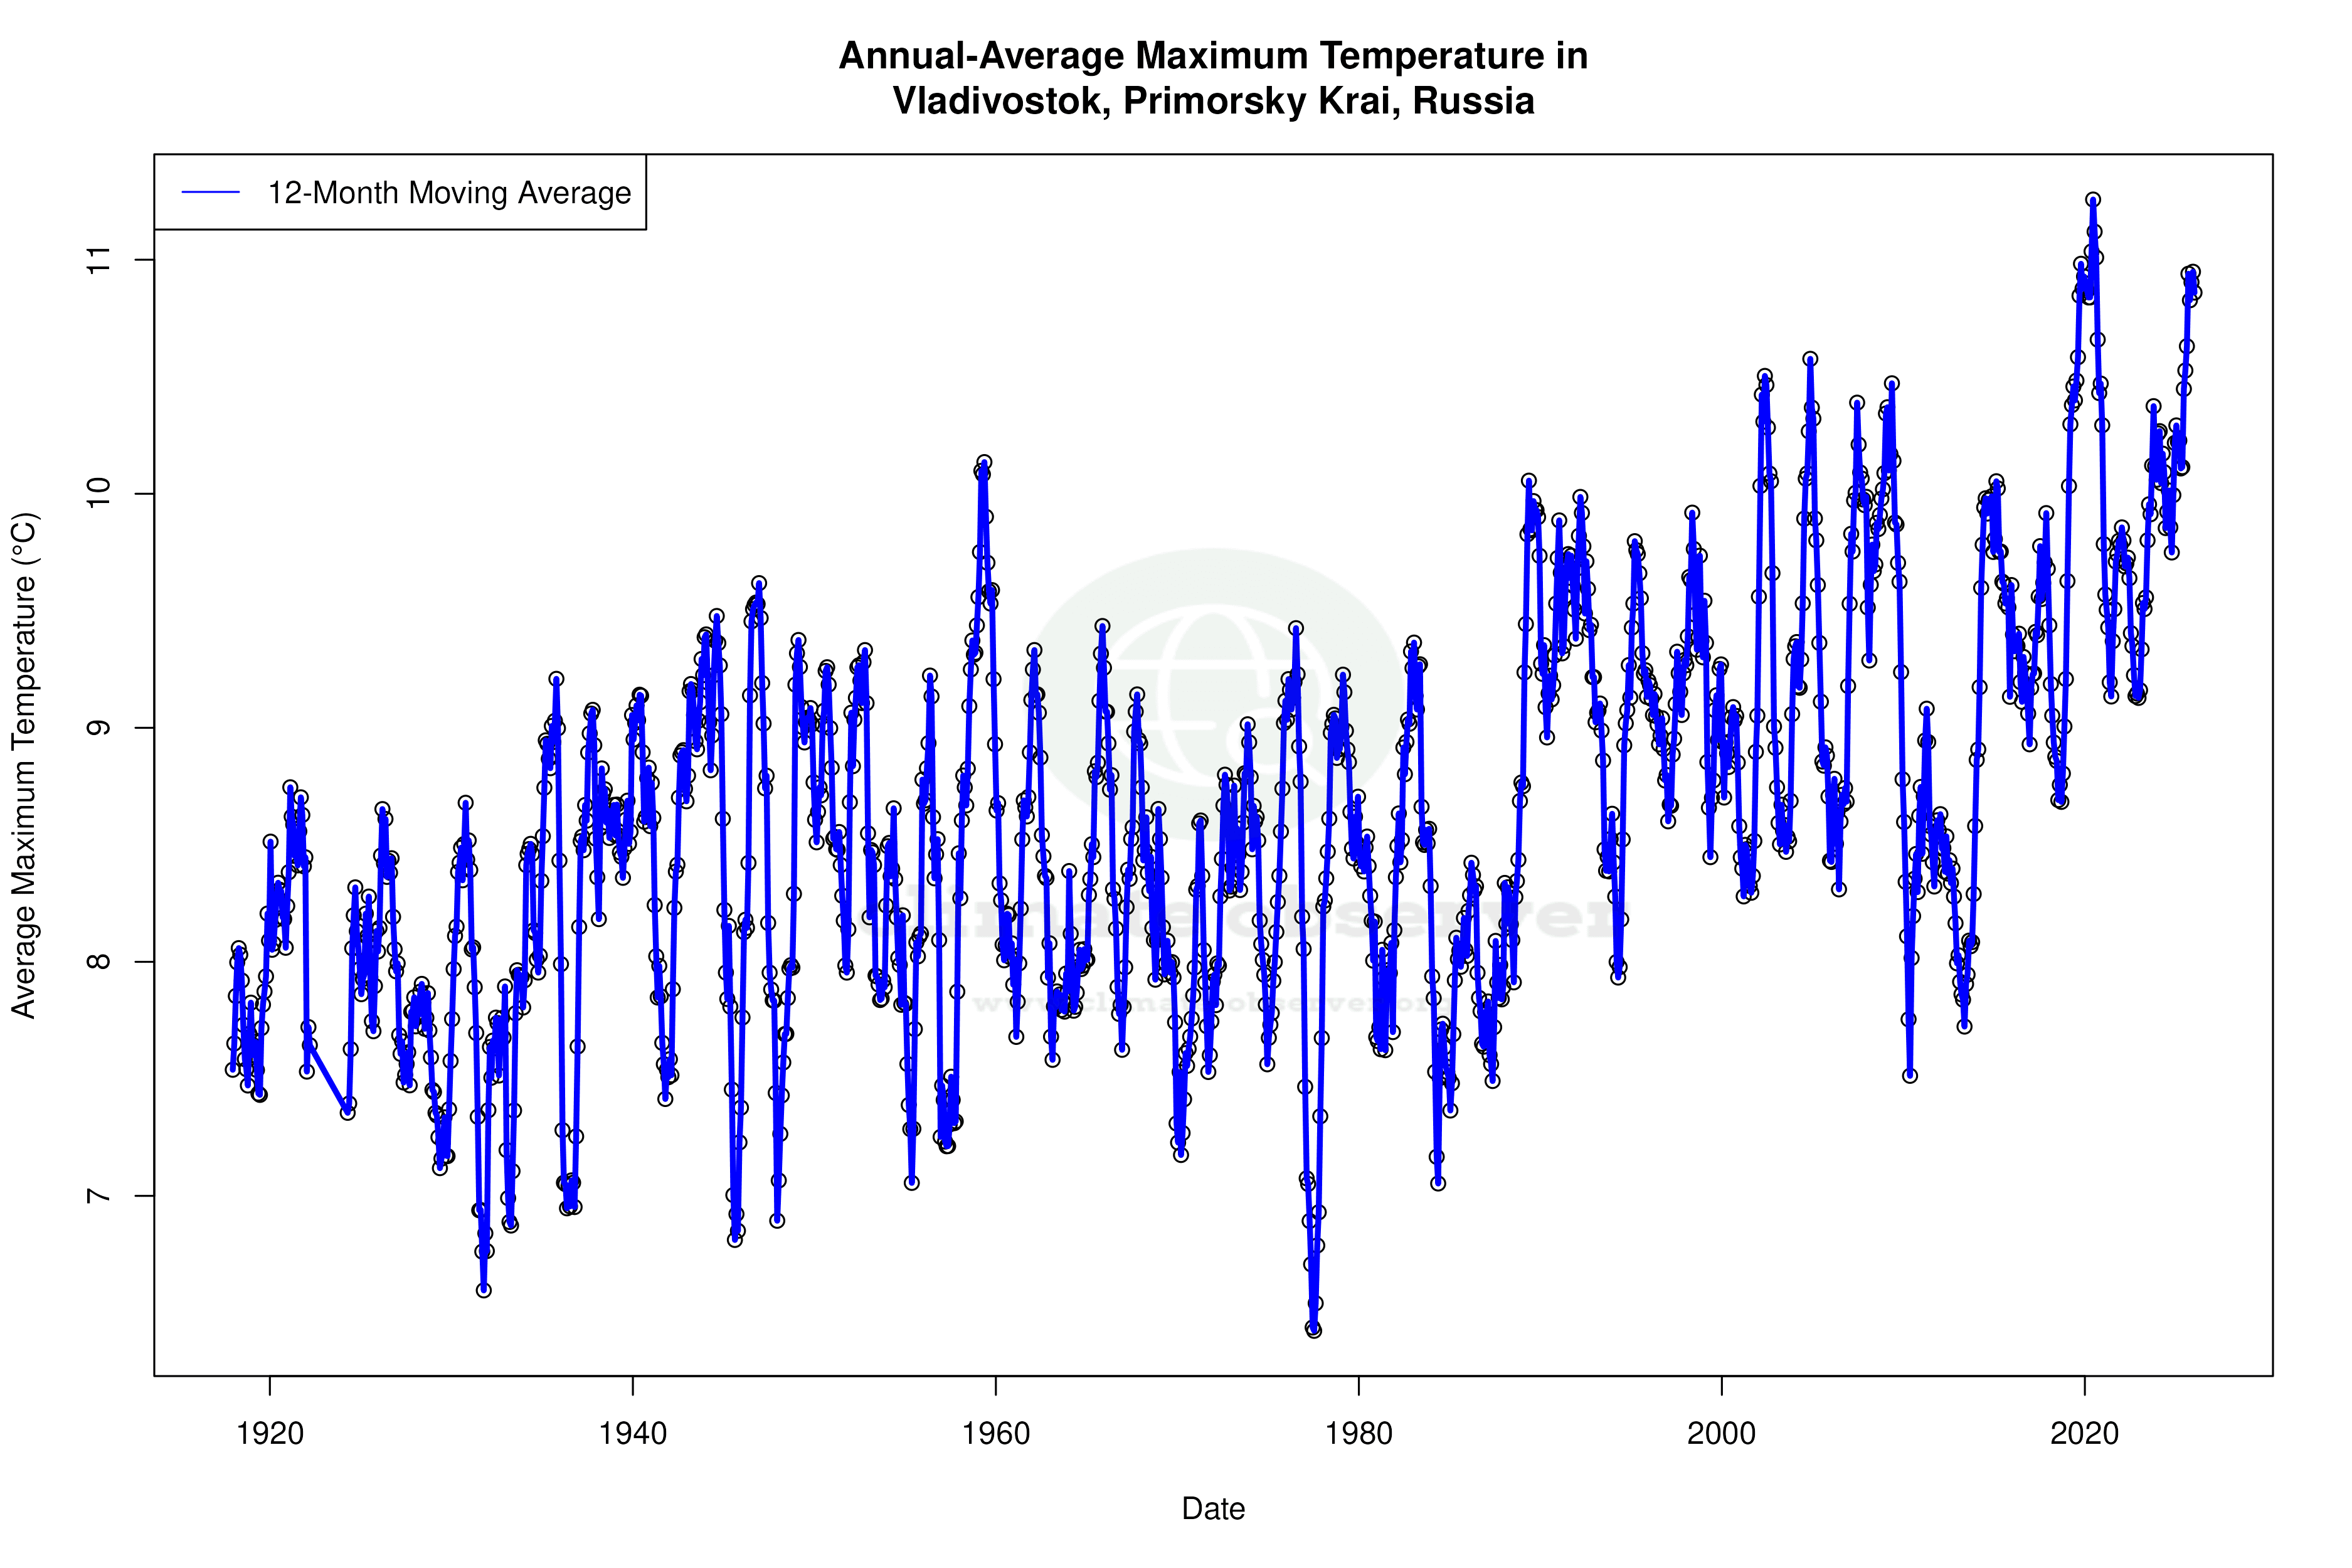


Max Temperature 12-Month MA | 1 of 6
Daily Data Points and Averages Throughout the Year

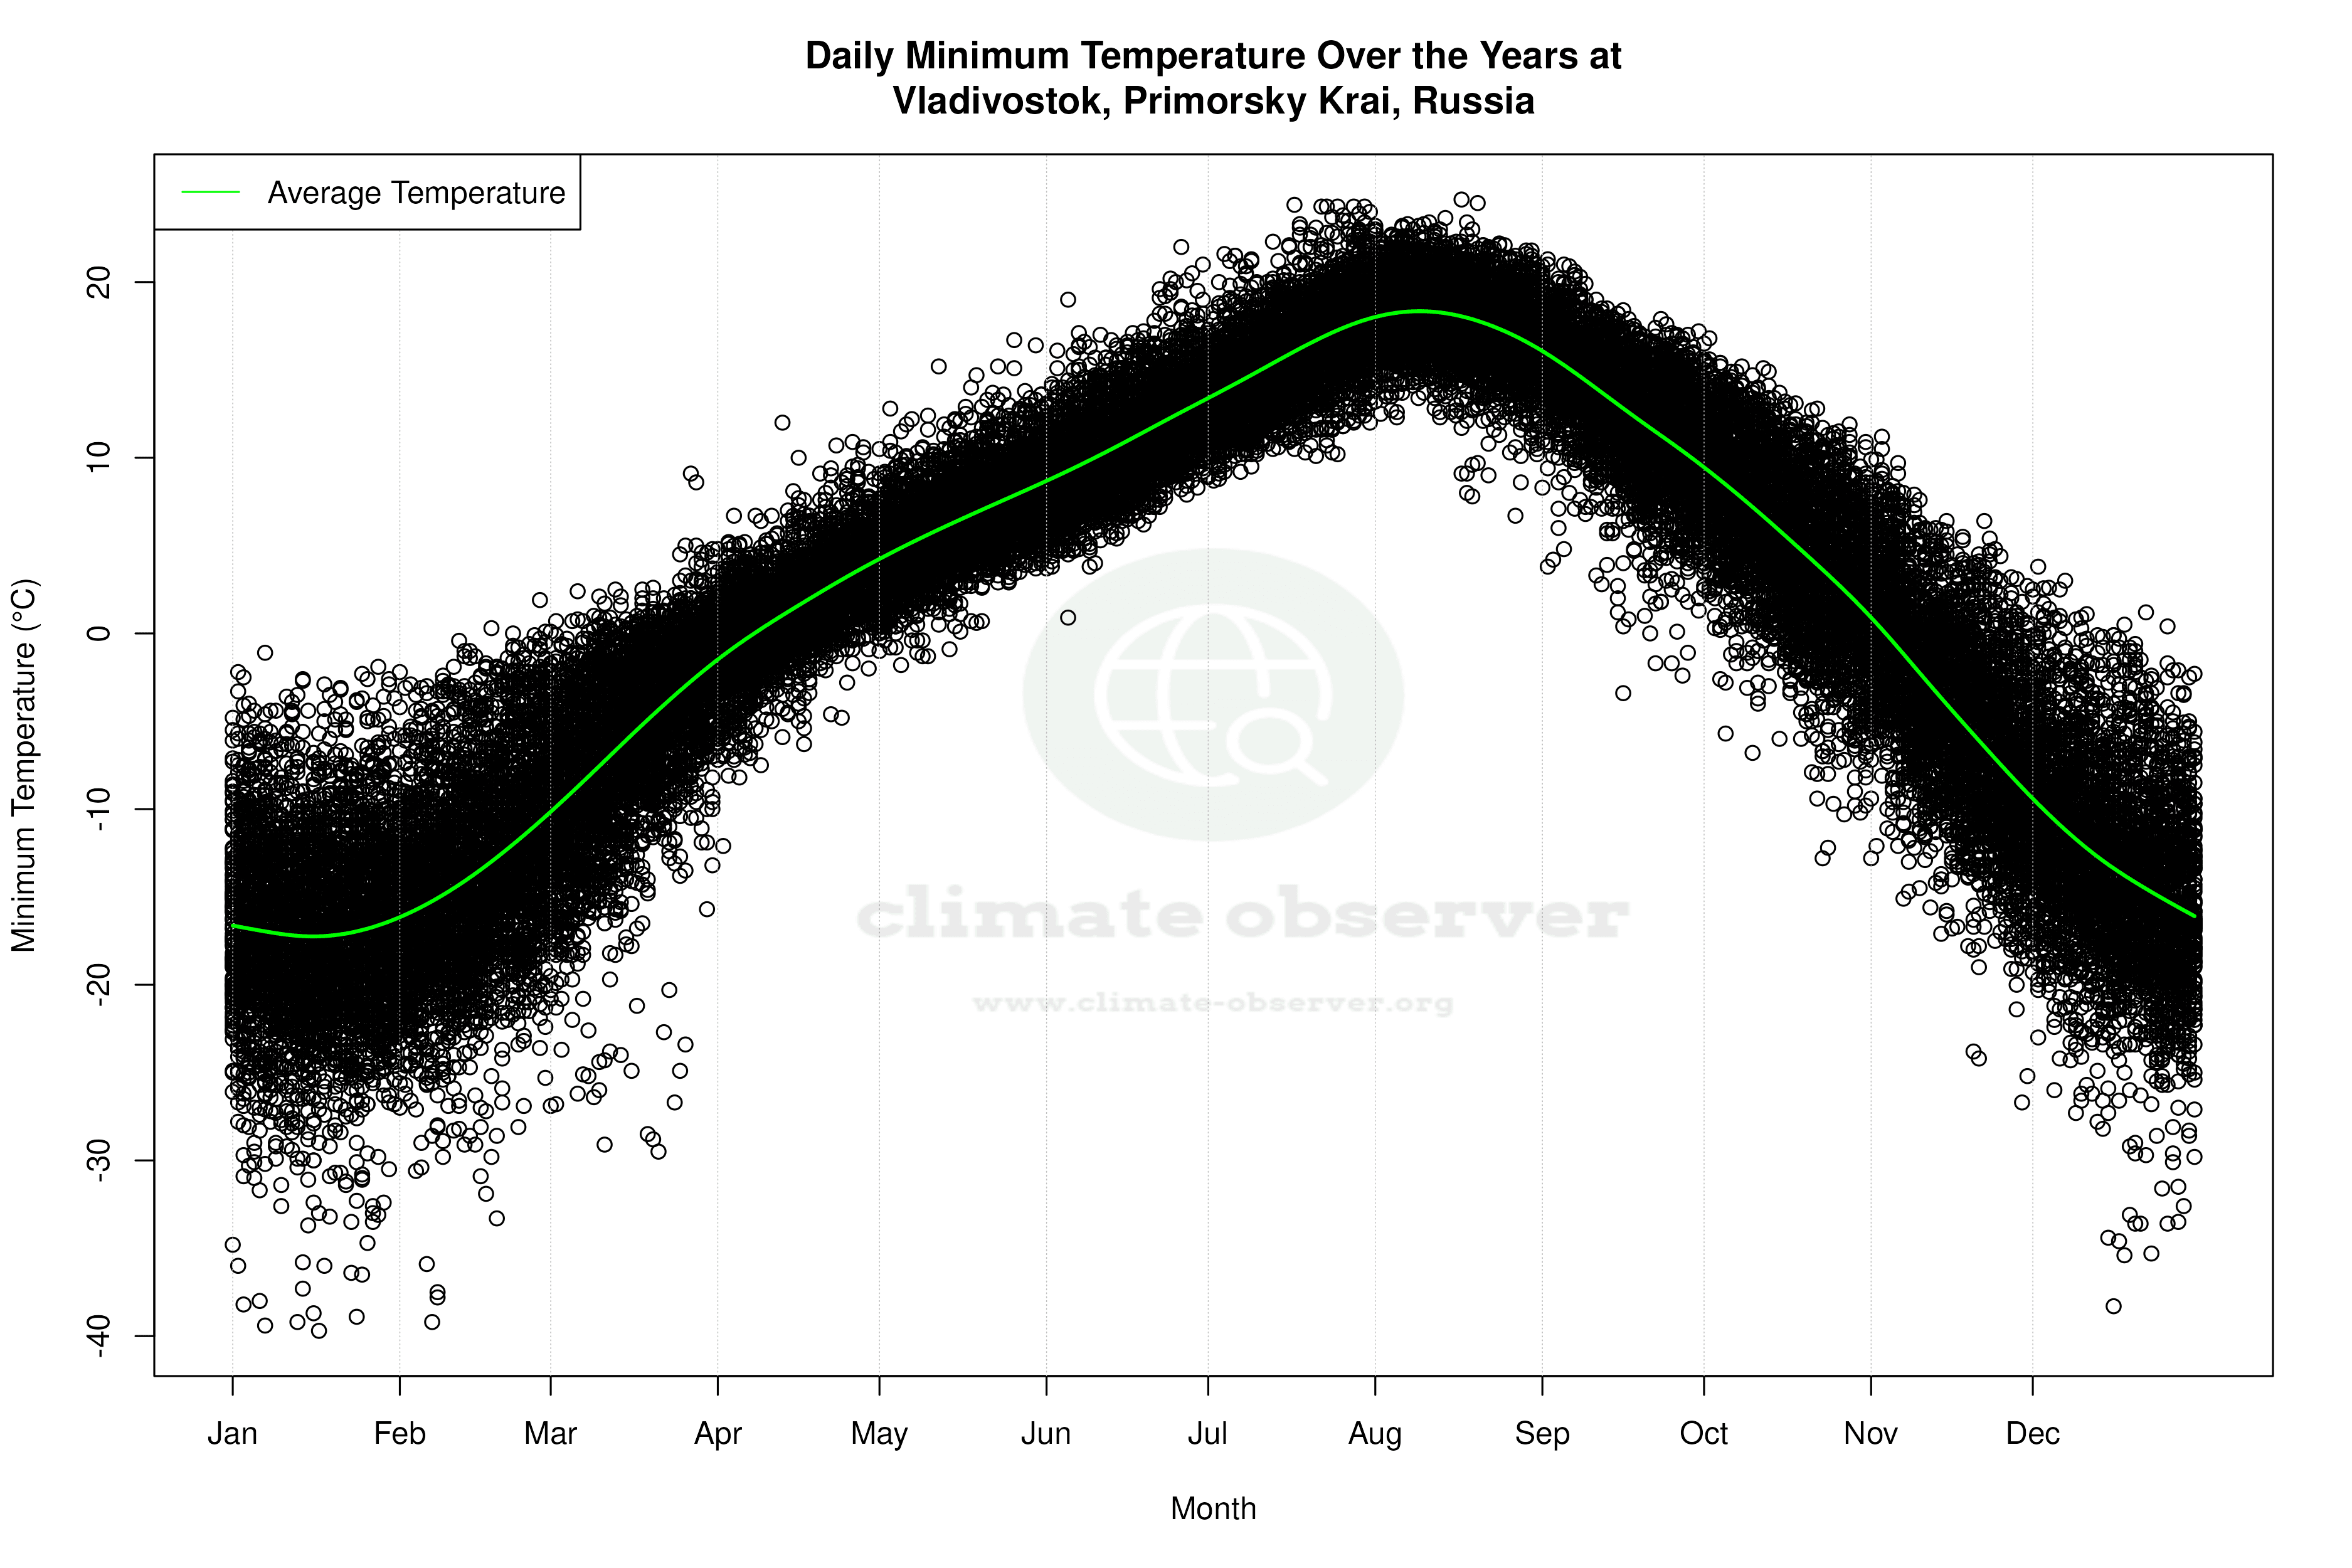
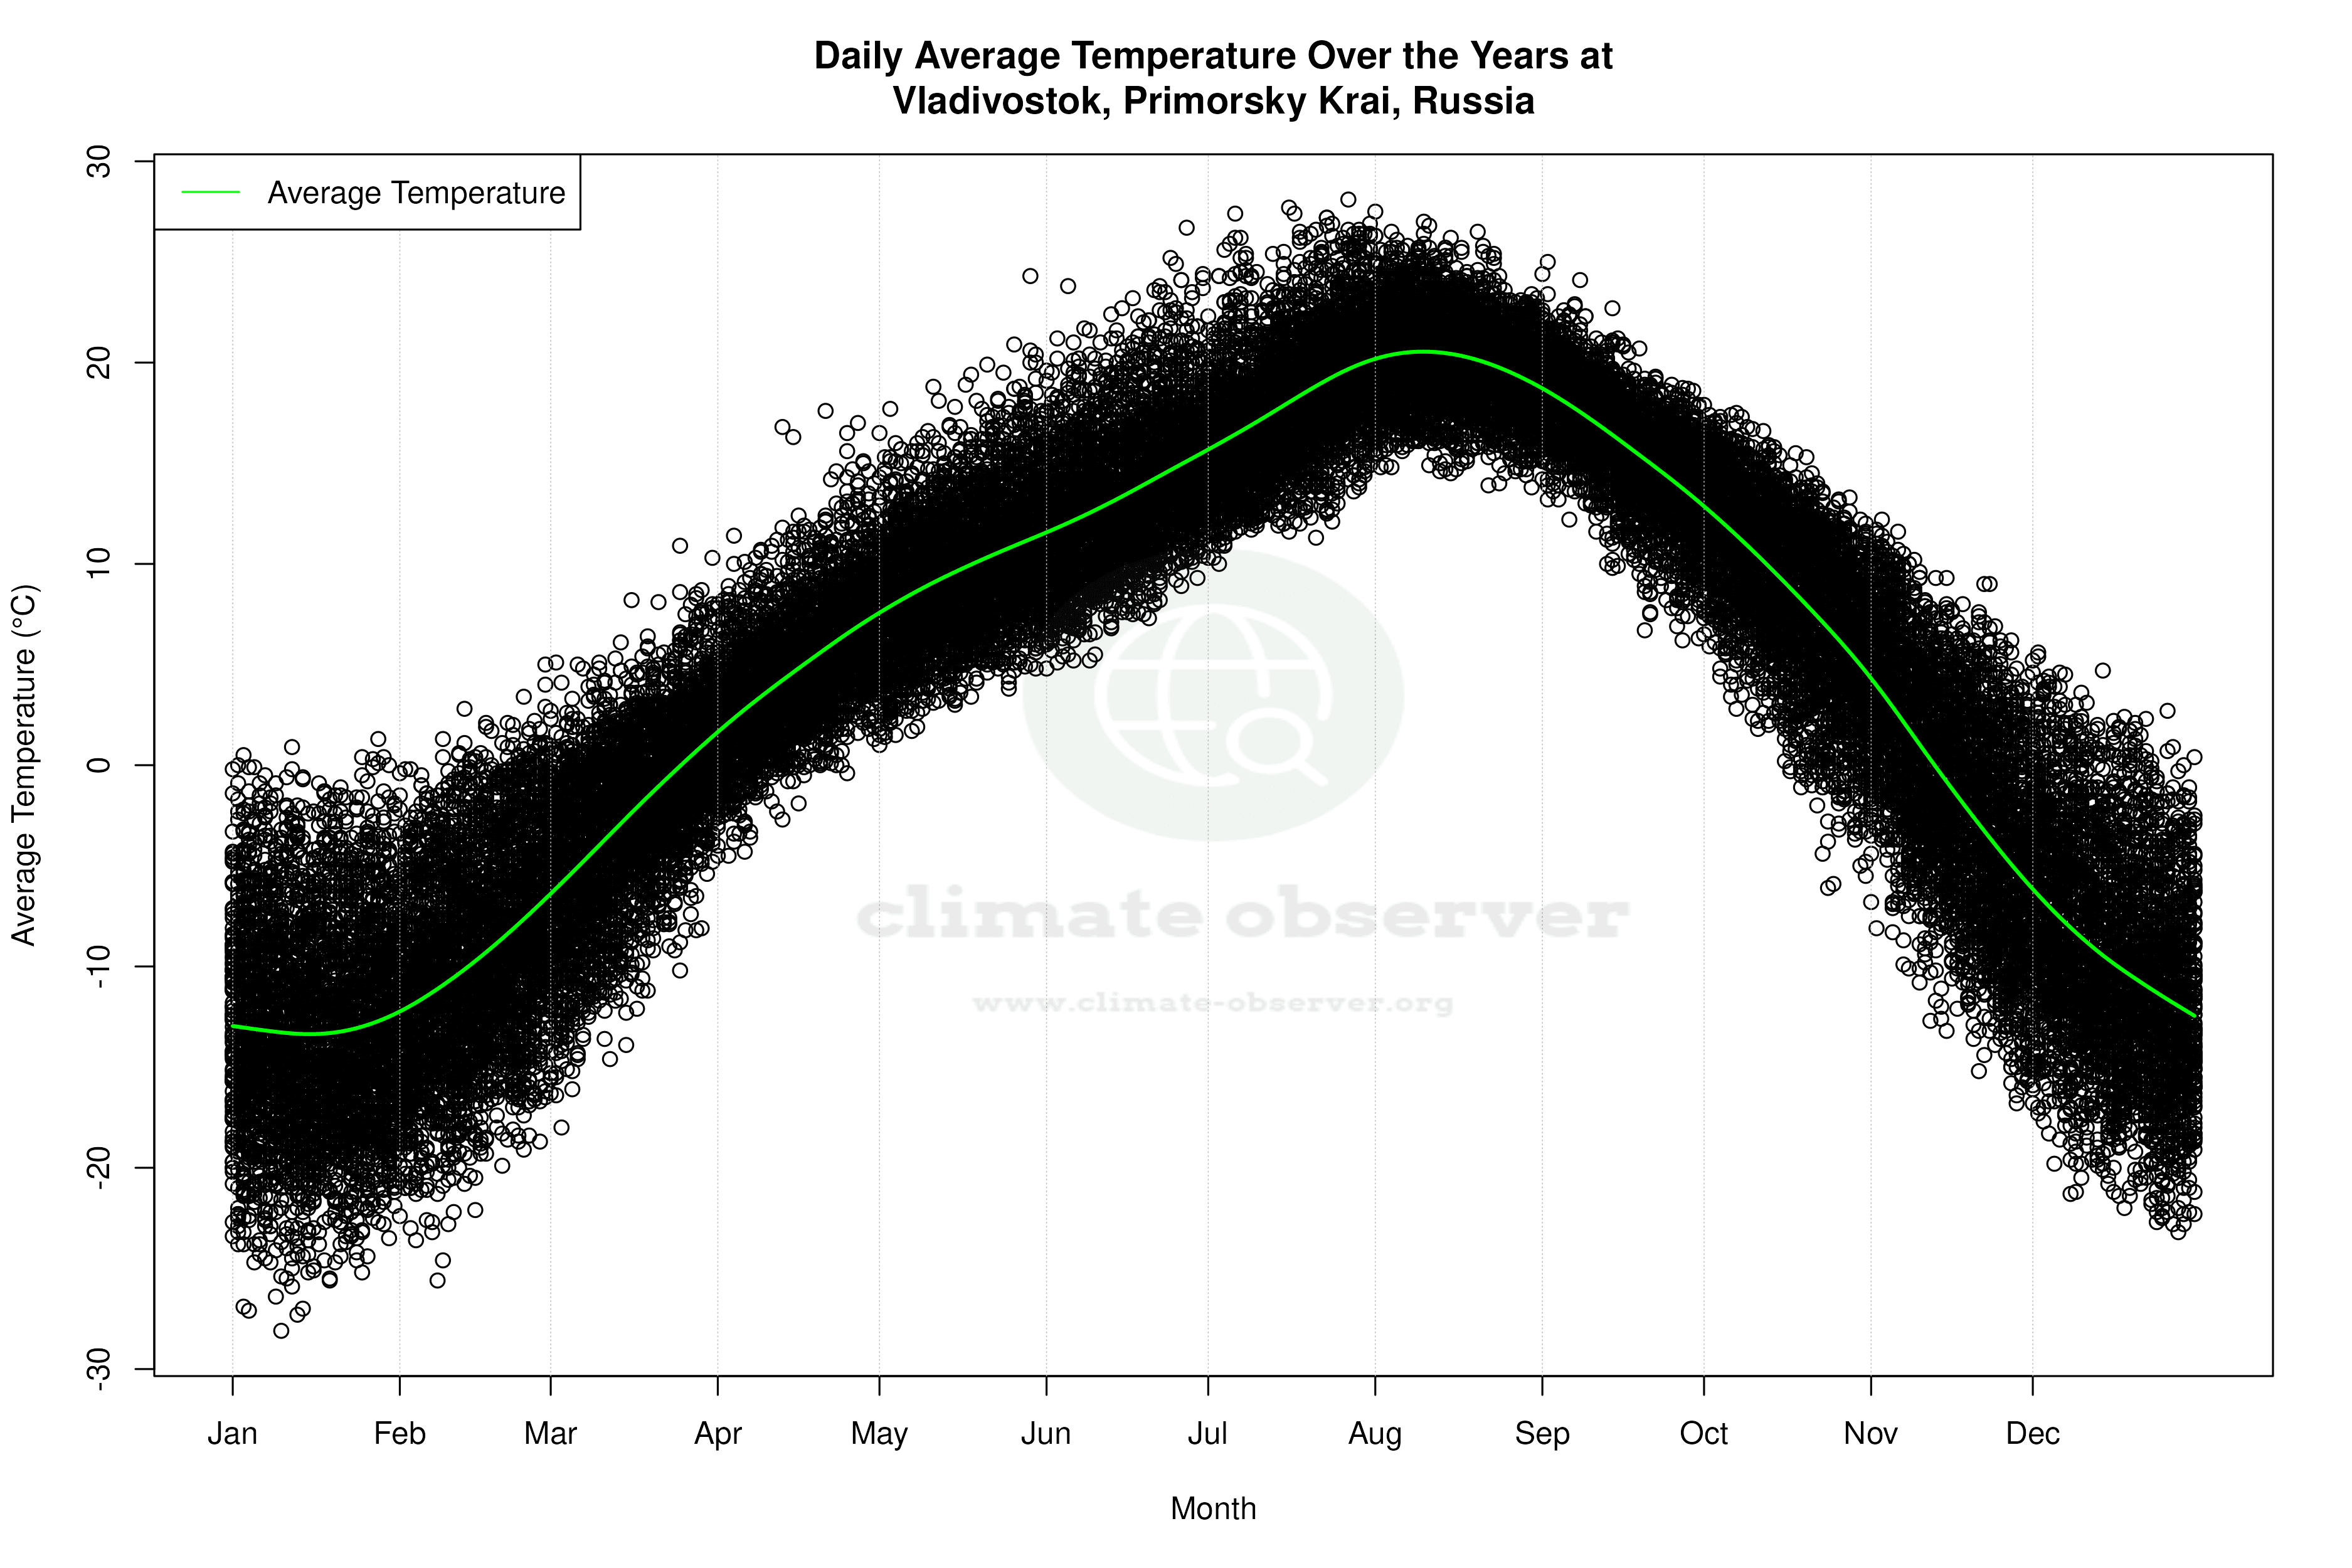


Average Max Temperature Throughout Year | 1 of 5
