Climate for Station: Nikolskoye/Beringa Ostrov, Kamchatka Krai, Russia
Loading live weather...
Climate Analysis & Overview
Nikolskoye, located on Beringa Ostrov, is experiencing a notable warming trend, particularly in its low temperatures over the past decade. While all-time trends show a modest warming, recent data indicates a more pronounced increase, suggesting potential implications for local ecosystems and weather patterns. Precipitation is becoming more evenly distributed, which may influence water resource management.
Nikolskoye's Climate Context
Nikolskoye, situated at 55.2°N, 165.98°E, falls under the subarctic oceanic climate classification (Cfc) according to the Köppen system. This classification is characterised by cool summers and mild winters, heavily influenced by its proximity to the Bering Sea. The surrounding waters moderate temperatures, preventing extreme cold but also limiting summer warmth. This maritime influence is evident in the station's temperature records, which show a maximum of 21.4°C (70.5°F) and a minimum of -23.5°C (-10.3°F).
Temperature Trends: A Decade of Change
Over the past decade, Nikolskoye has experienced a significant warming trend in its low temperatures, with an increase of 1.27°C (2.29°F). This is notably higher than the all-time trend, which shows a more modest rise of 0.24°C (0.43°F) in low temperatures. High temperatures have also increased over the last ten years by 0.61°C (1.10°F), compared to an all-time increase of 0.07°C (0.13°F). This discrepancy between recent and historical data suggests a potential shift in local climatic conditions, which could have profound impacts on local flora and fauna accustomed to more stable conditions.
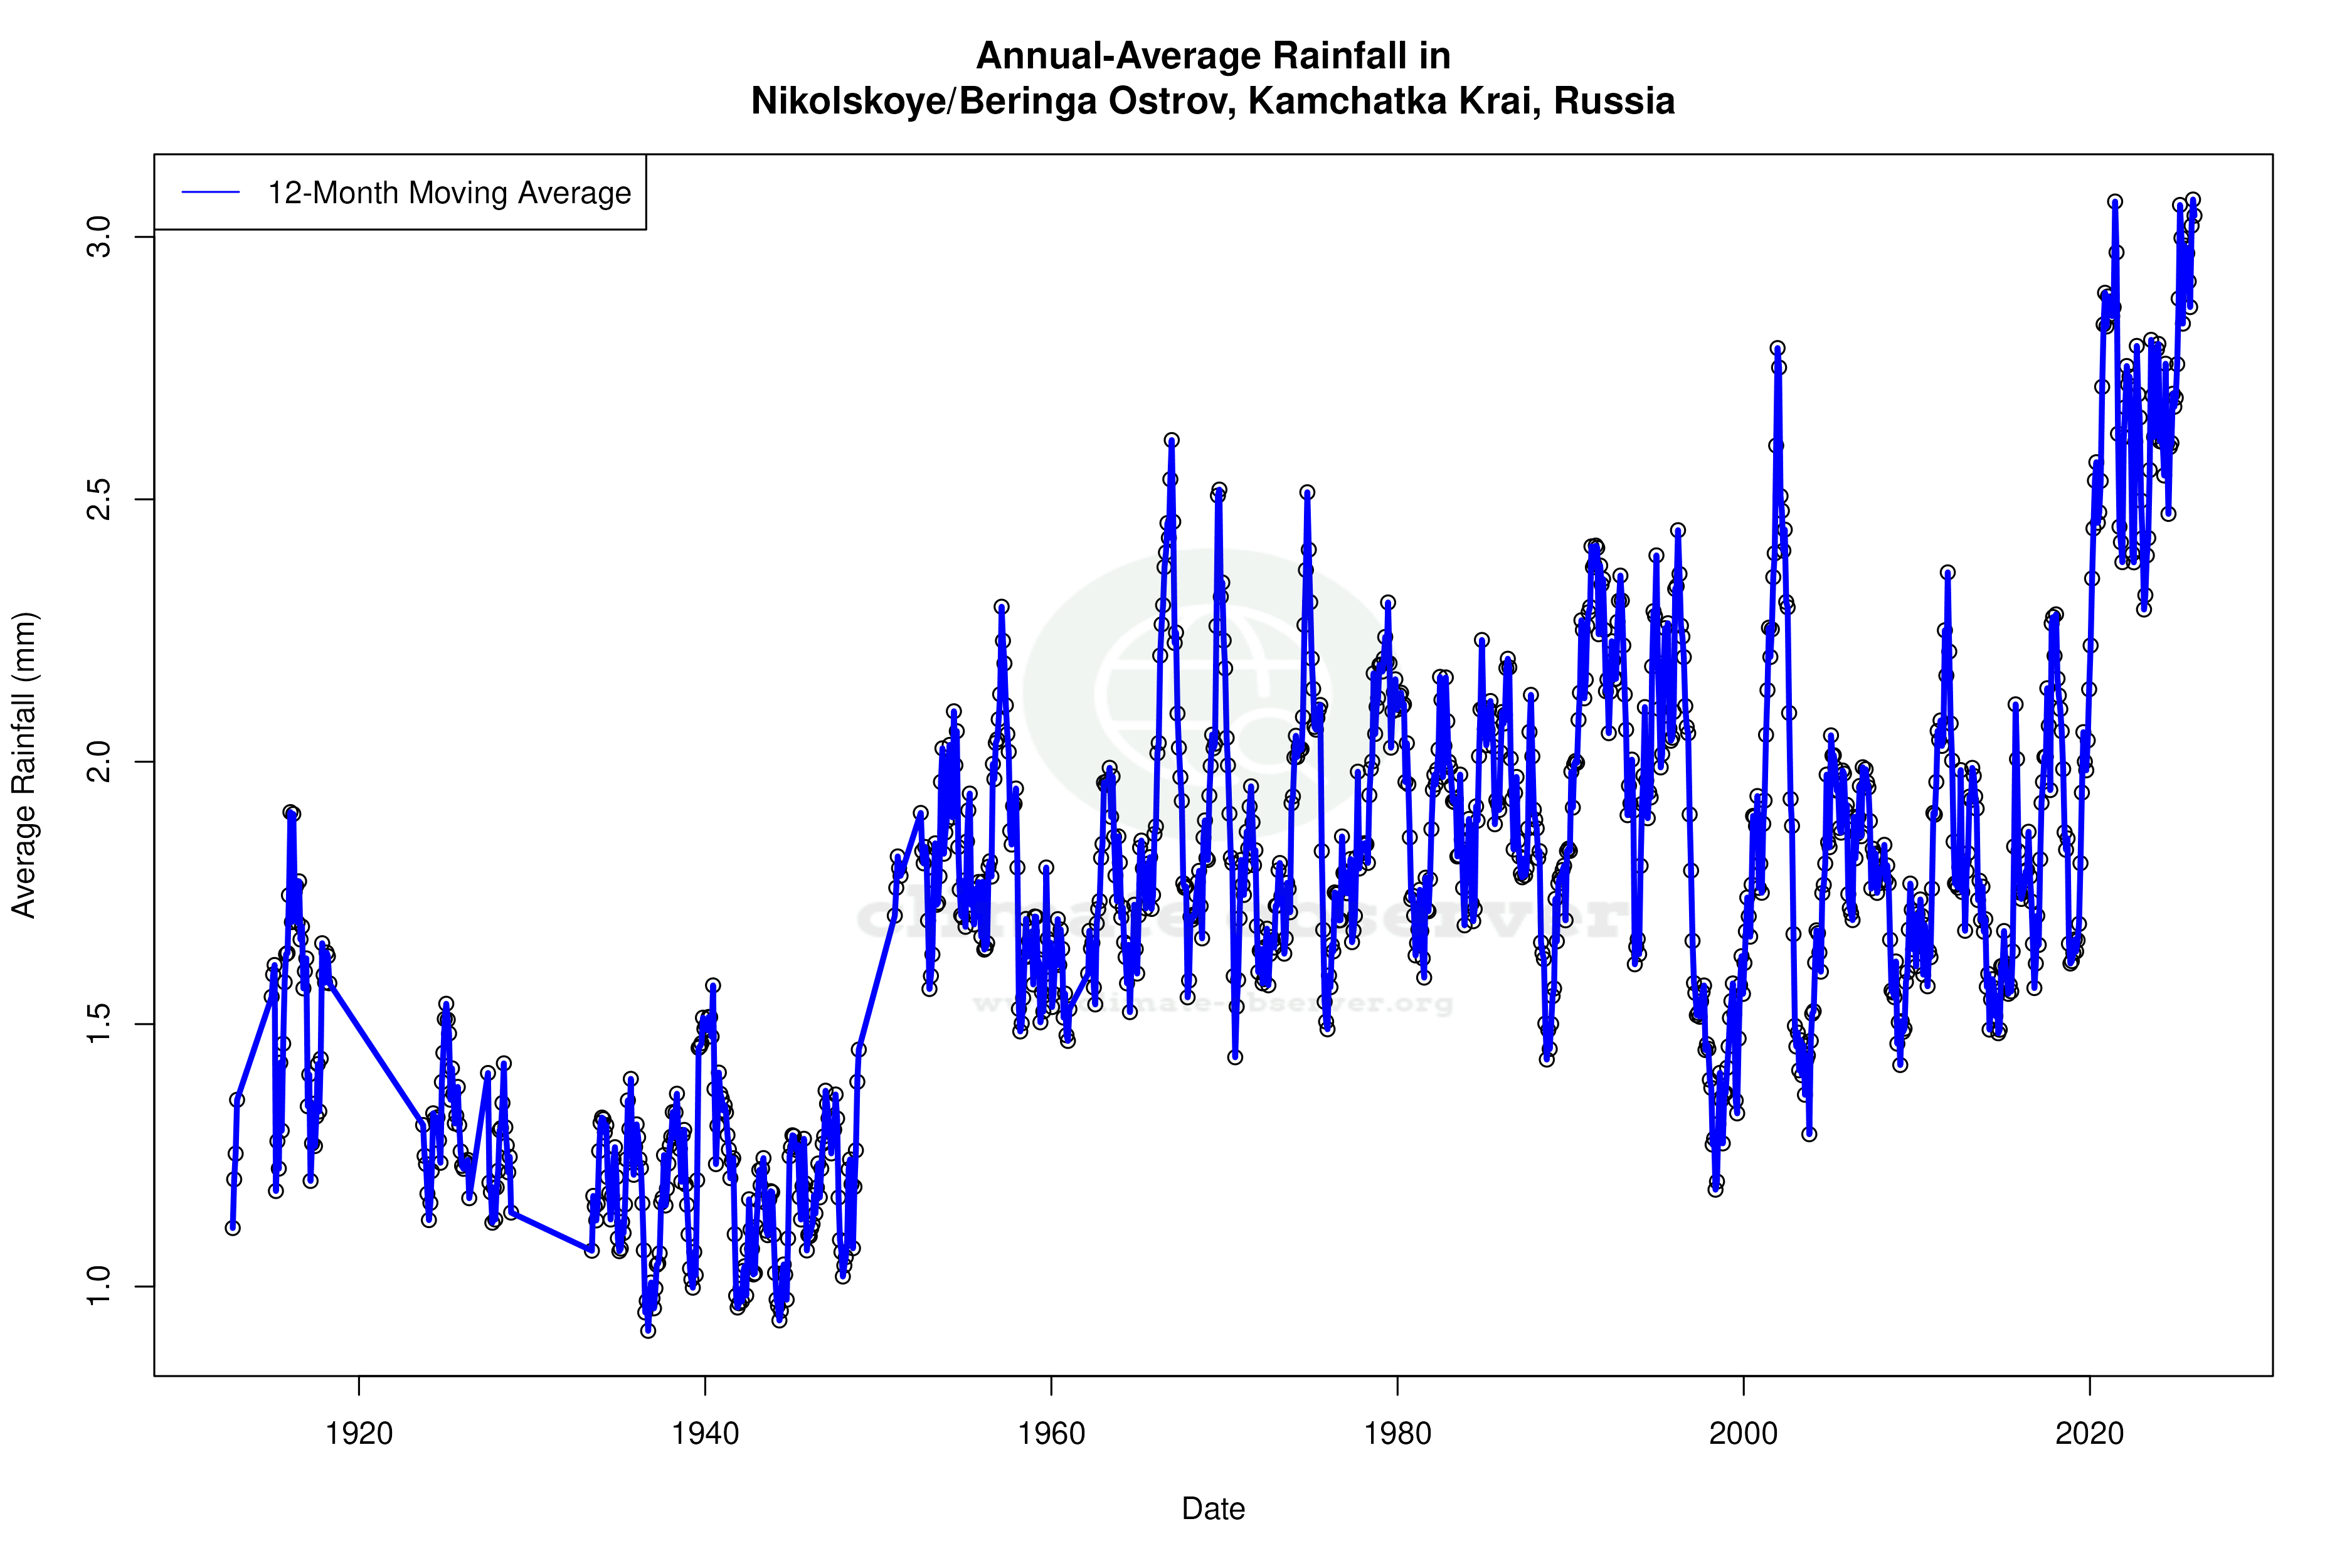
Precipitation Patterns: Towards Even Distribution
The Precipitation Concentration Index (PCI) for Nikolskoye has decreased from a baseline of 10.39 to a current value of 9.21. A PCI under 10 indicates that precipitation is becoming more evenly distributed throughout the year, rather than concentrated in a few intense events. This shift could lead to more consistent water availability, which is beneficial for both agriculture and natural ecosystems. However, it may also require adjustments in water management strategies to accommodate these changes.
Implications for Regional Climate Goals
Russia's regional climate goals include adapting to climate change impacts and managing natural resources sustainably. The warming trends observed in Nikolskoye, particularly the sharp rise in low temperatures, could influence these objectives. As temperatures rise, the local environment may see shifts in species distribution and ecosystem dynamics. Furthermore, the more even distribution of precipitation could affect agricultural practices and water management policies, necessitating adaptive strategies to ensure resource sustainability.
Conclusion of Observations
The climate profile of Nikolskoye on Beringa Ostrov highlights significant warming trends, particularly in low temperatures over the past decade, alongside a more even distribution of precipitation. These changes present both challenges and opportunities for local climate adaptation and resource management strategies.
Station Statistics
10-Year Trend
High: +1.28 °F/decade
Low: +2.56 °F/decade
Rain: +0.049 in/decade
25-Year Trend
High: +0.82 °F/decade
Low: +1.26 °F/decade
Rain: +0.016 in/decade
50-Year Trend
High: +0.44 °F/decade
Low: +0.67 °F/decade
Rain: +0.003 in/decade
All-Time Trend
High: +0.15 °F/decade
Low: +0.43 °F/decade
Rain: +0.003 in/decade
Percentage Above-Average Days
Last 12 Months: 45.2%
This Year: 26.3%
Precipitation Concentration Index (PCI) ℹ️
Last 12 Months: 9.5
Historical Average: 10.6
Percentile Rank of Last 12 Months ℹ️
High: 93rd percentile
Low: 98th percentile
Rain: 99th percentile
Change in Variance ℹ️
High: -9.9%
Low: -14.1%
Intraday: -46.4%
Data Coverage
86.2%
First Year of Data
1899
Station Location
Historical Weather Records
| Max High | Avg High | Min High | Max Avg | Avg Avg | Min Avg | Max Low | Avg Low | Min Low | Max Precipitation | Avg Precipitation | Max Snow | Avg Snow | |
|---|---|---|---|---|---|---|---|---|---|---|---|---|---|
| Record | 70.52 °F | — | 7.70 °F | 62.96 °F | — | 3.20 °F | 57.92 °F | — | -10.30 °F | 2.91 in | — | — | — |
| January | 43.88 °F | 29.04 °F | 8.24 °F | 39.02 °F | 25.97 °F | 4.10 °F | 37.58 °F | 21.84 °F | -7.60 °F | 1.39 in | 0.07 in | — | — |
| February | 41.18 °F | 28.67 °F | 7.70 °F | 37.76 °F | 25.63 °F | 5.00 °F | 35.78 °F | 21.65 °F | -10.30 °F | 1.63 in | 0.06 in | — | — |
| March | 47.84 °F | 30.36 °F | 10.58 °F | 38.48 °F | 27.28 °F | 8.24 °F | 37.04 °F | 23.41 °F | 0.14 °F | 1.34 in | 0.05 in | — | — |
| April | 44.60 °F | 33.95 °F | 18.50 °F | 43.88 °F | 31.14 °F | 14.36 °F | 37.58 °F | 27.91 °F | 5.54 °F | 1.20 in | 0.05 in | — | — |
| May | 56.48 °F | 39.54 °F | 28.58 °F | 47.84 °F | 36.25 °F | 24.80 °F | 42.44 °F | 33.27 °F | 20.30 °F | 1.48 in | 0.05 in | — | — |
| June | 63.50 °F | 45.57 °F | 35.78 °F | 53.06 °F | 41.95 °F | 33.98 °F | 49.95 °F | 39.08 °F | 27.86 °F | 1.23 in | 0.04 in | — | — |
| July | 70.52 °F | 51.65 °F | 41.00 °F | 60.08 °F | 48.14 °F | 39.02 °F | 55.76 °F | 45.43 °F | 31.10 °F | 2.24 in | 0.06 in | — | — |
| August | 69.80 °F | 54.75 °F | 45.86 °F | 62.96 °F | 51.54 °F | 44.42 °F | 57.92 °F | 48.71 °F | 35.24 °F | 2.23 in | 0.08 in | — | — |
| September | 66.02 °F | 52.10 °F | 41.72 °F | 58.82 °F | 48.73 °F | 33.98 °F | 55.94 °F | 45.26 °F | 26.78 °F | 2.03 in | 0.08 in | — | — |
| October | 57.02 °F | 44.50 °F | 29.30 °F | 53.60 °F | 41.08 °F | 25.34 °F | 50.54 °F | 37.02 °F | 16.70 °F | 2.91 in | 0.10 in | — | — |
| November | 48.56 °F | 36.14 °F | 18.50 °F | 45.32 °F | 32.94 °F | 14.18 °F | 43.88 °F | 28.97 °F | 4.28 °F | 1.86 in | 0.09 in | — | — |
| December | 45.32 °F | 31.04 °F | 9.50 °F | 41.36 °F | 28.00 °F | 3.20 °F | 39.56 °F | 23.93 °F | -3.82 °F | 1.13 in | 0.08 in | — | — |
Data Visualisations
Remove WatermarksCurrent Year Climate Trends vs Historical

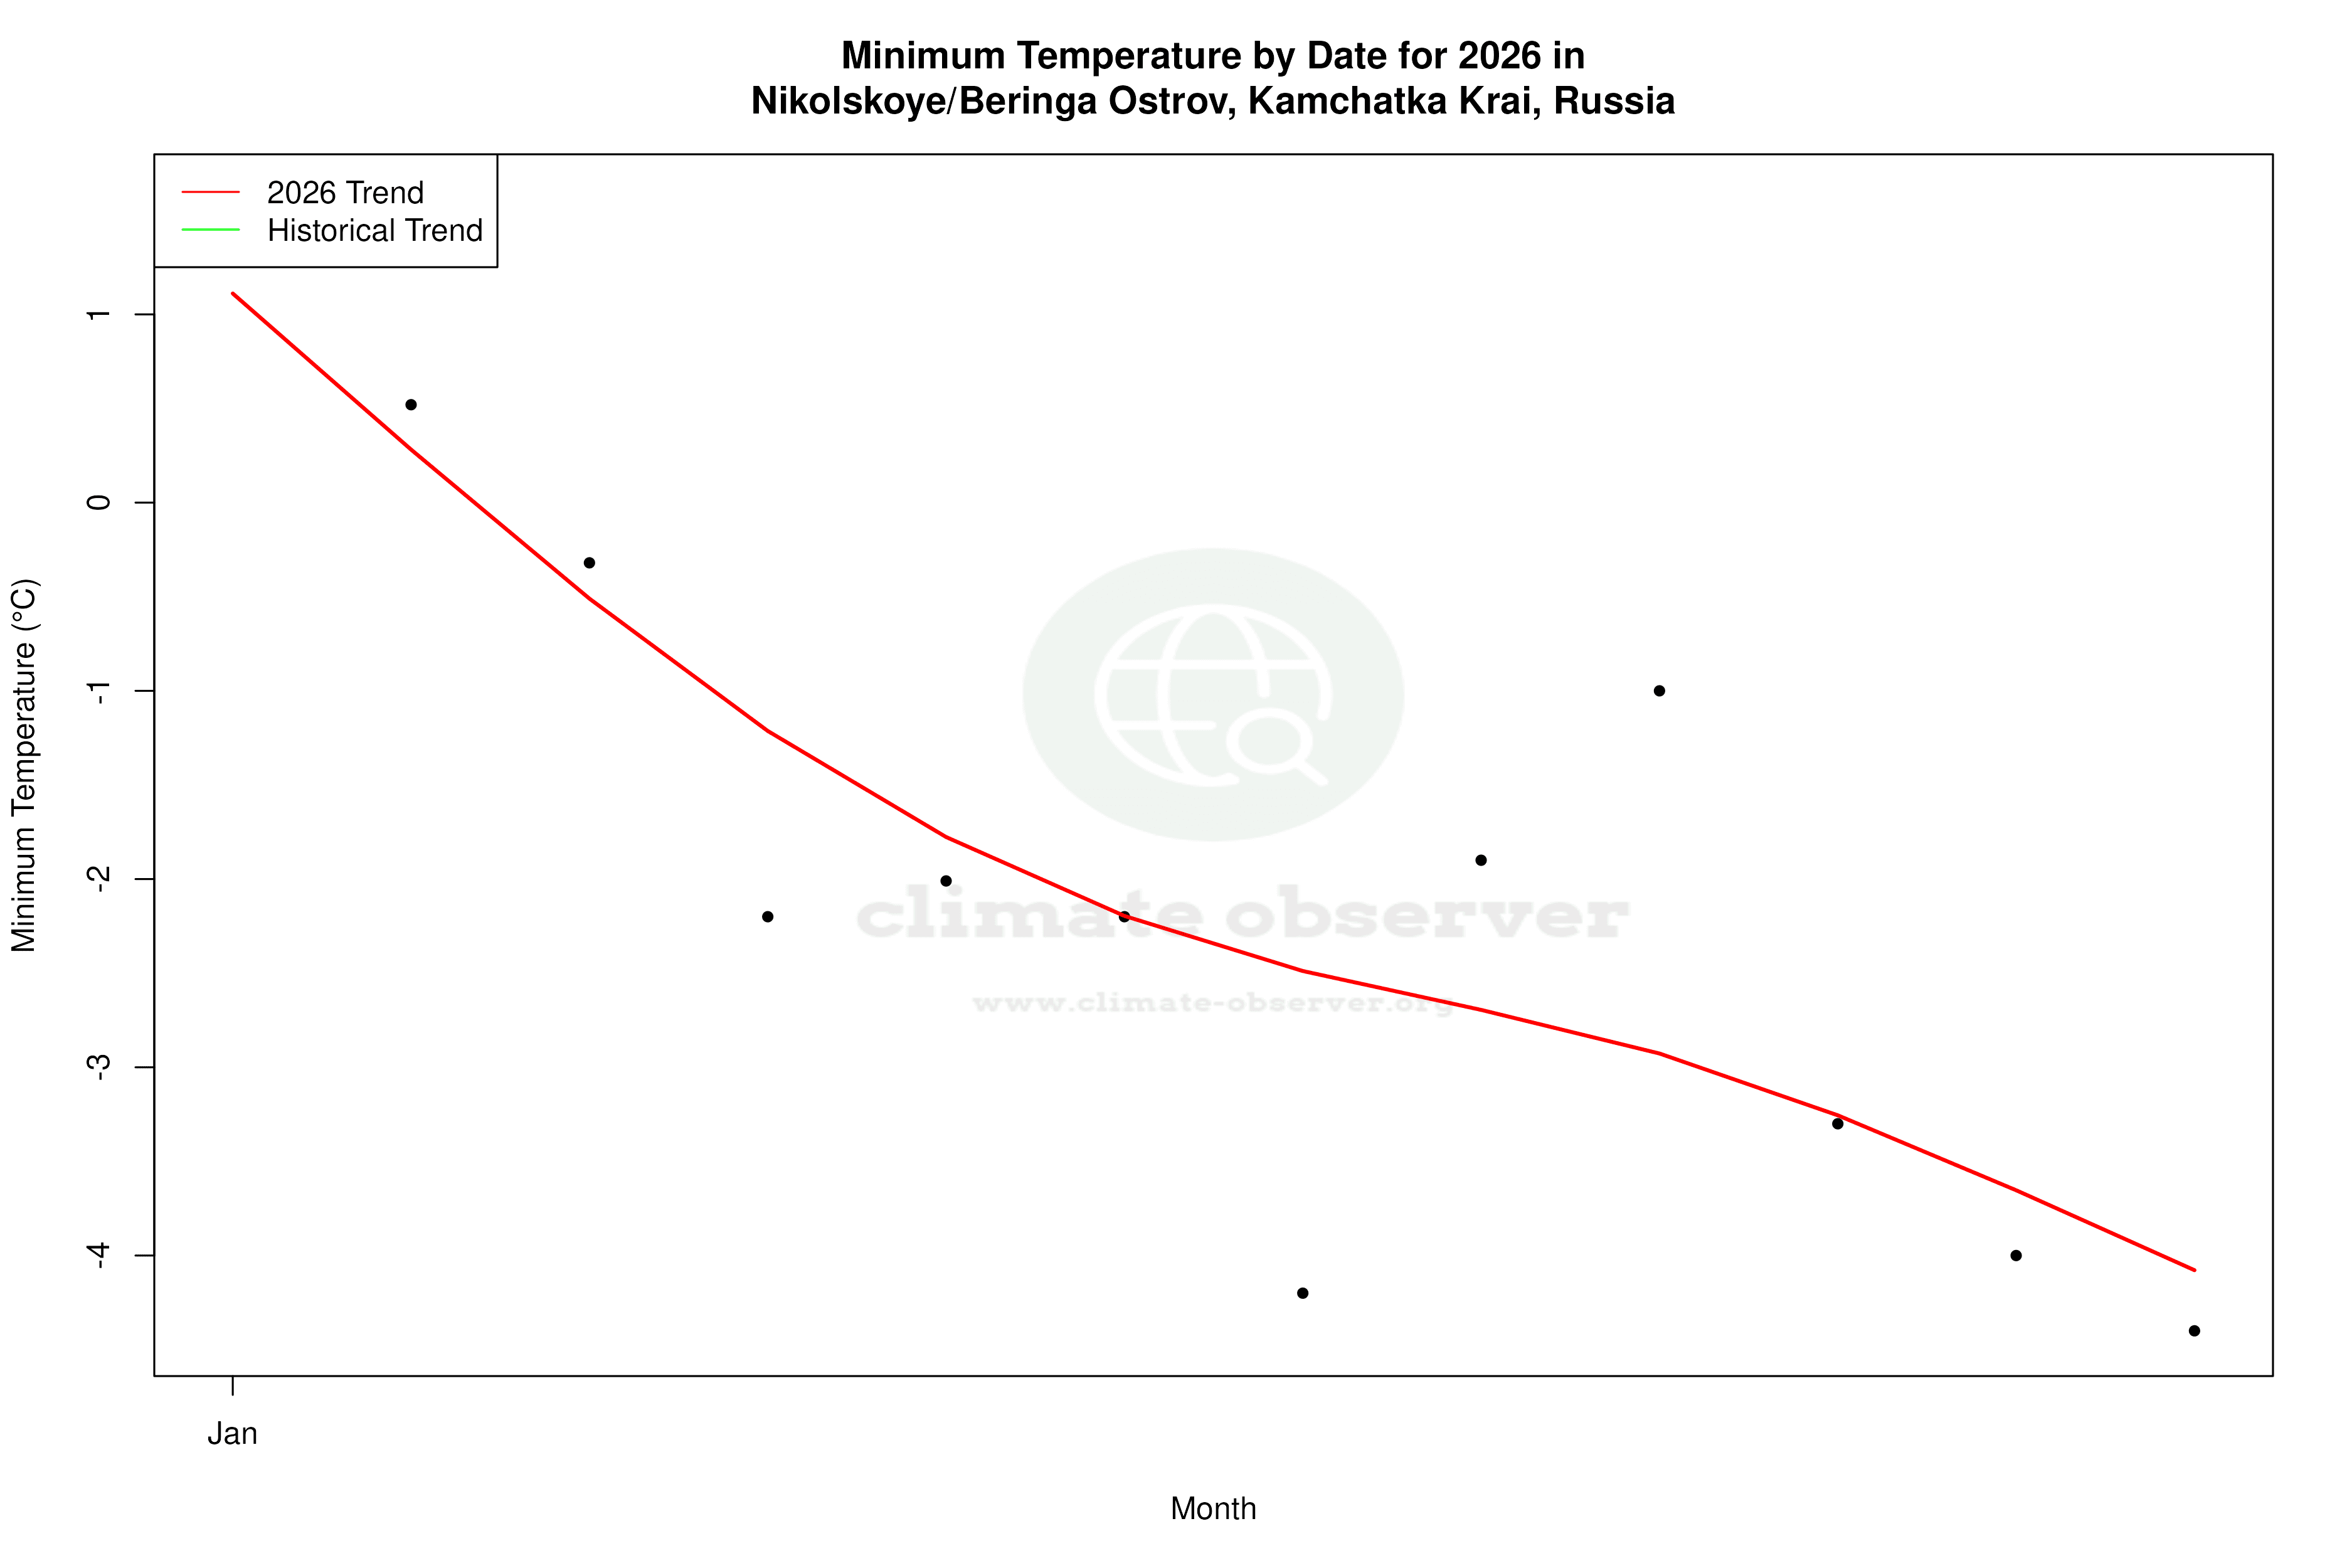


Max Temperature this Year | 1 of 6
Climate 12-Month Moving Averages

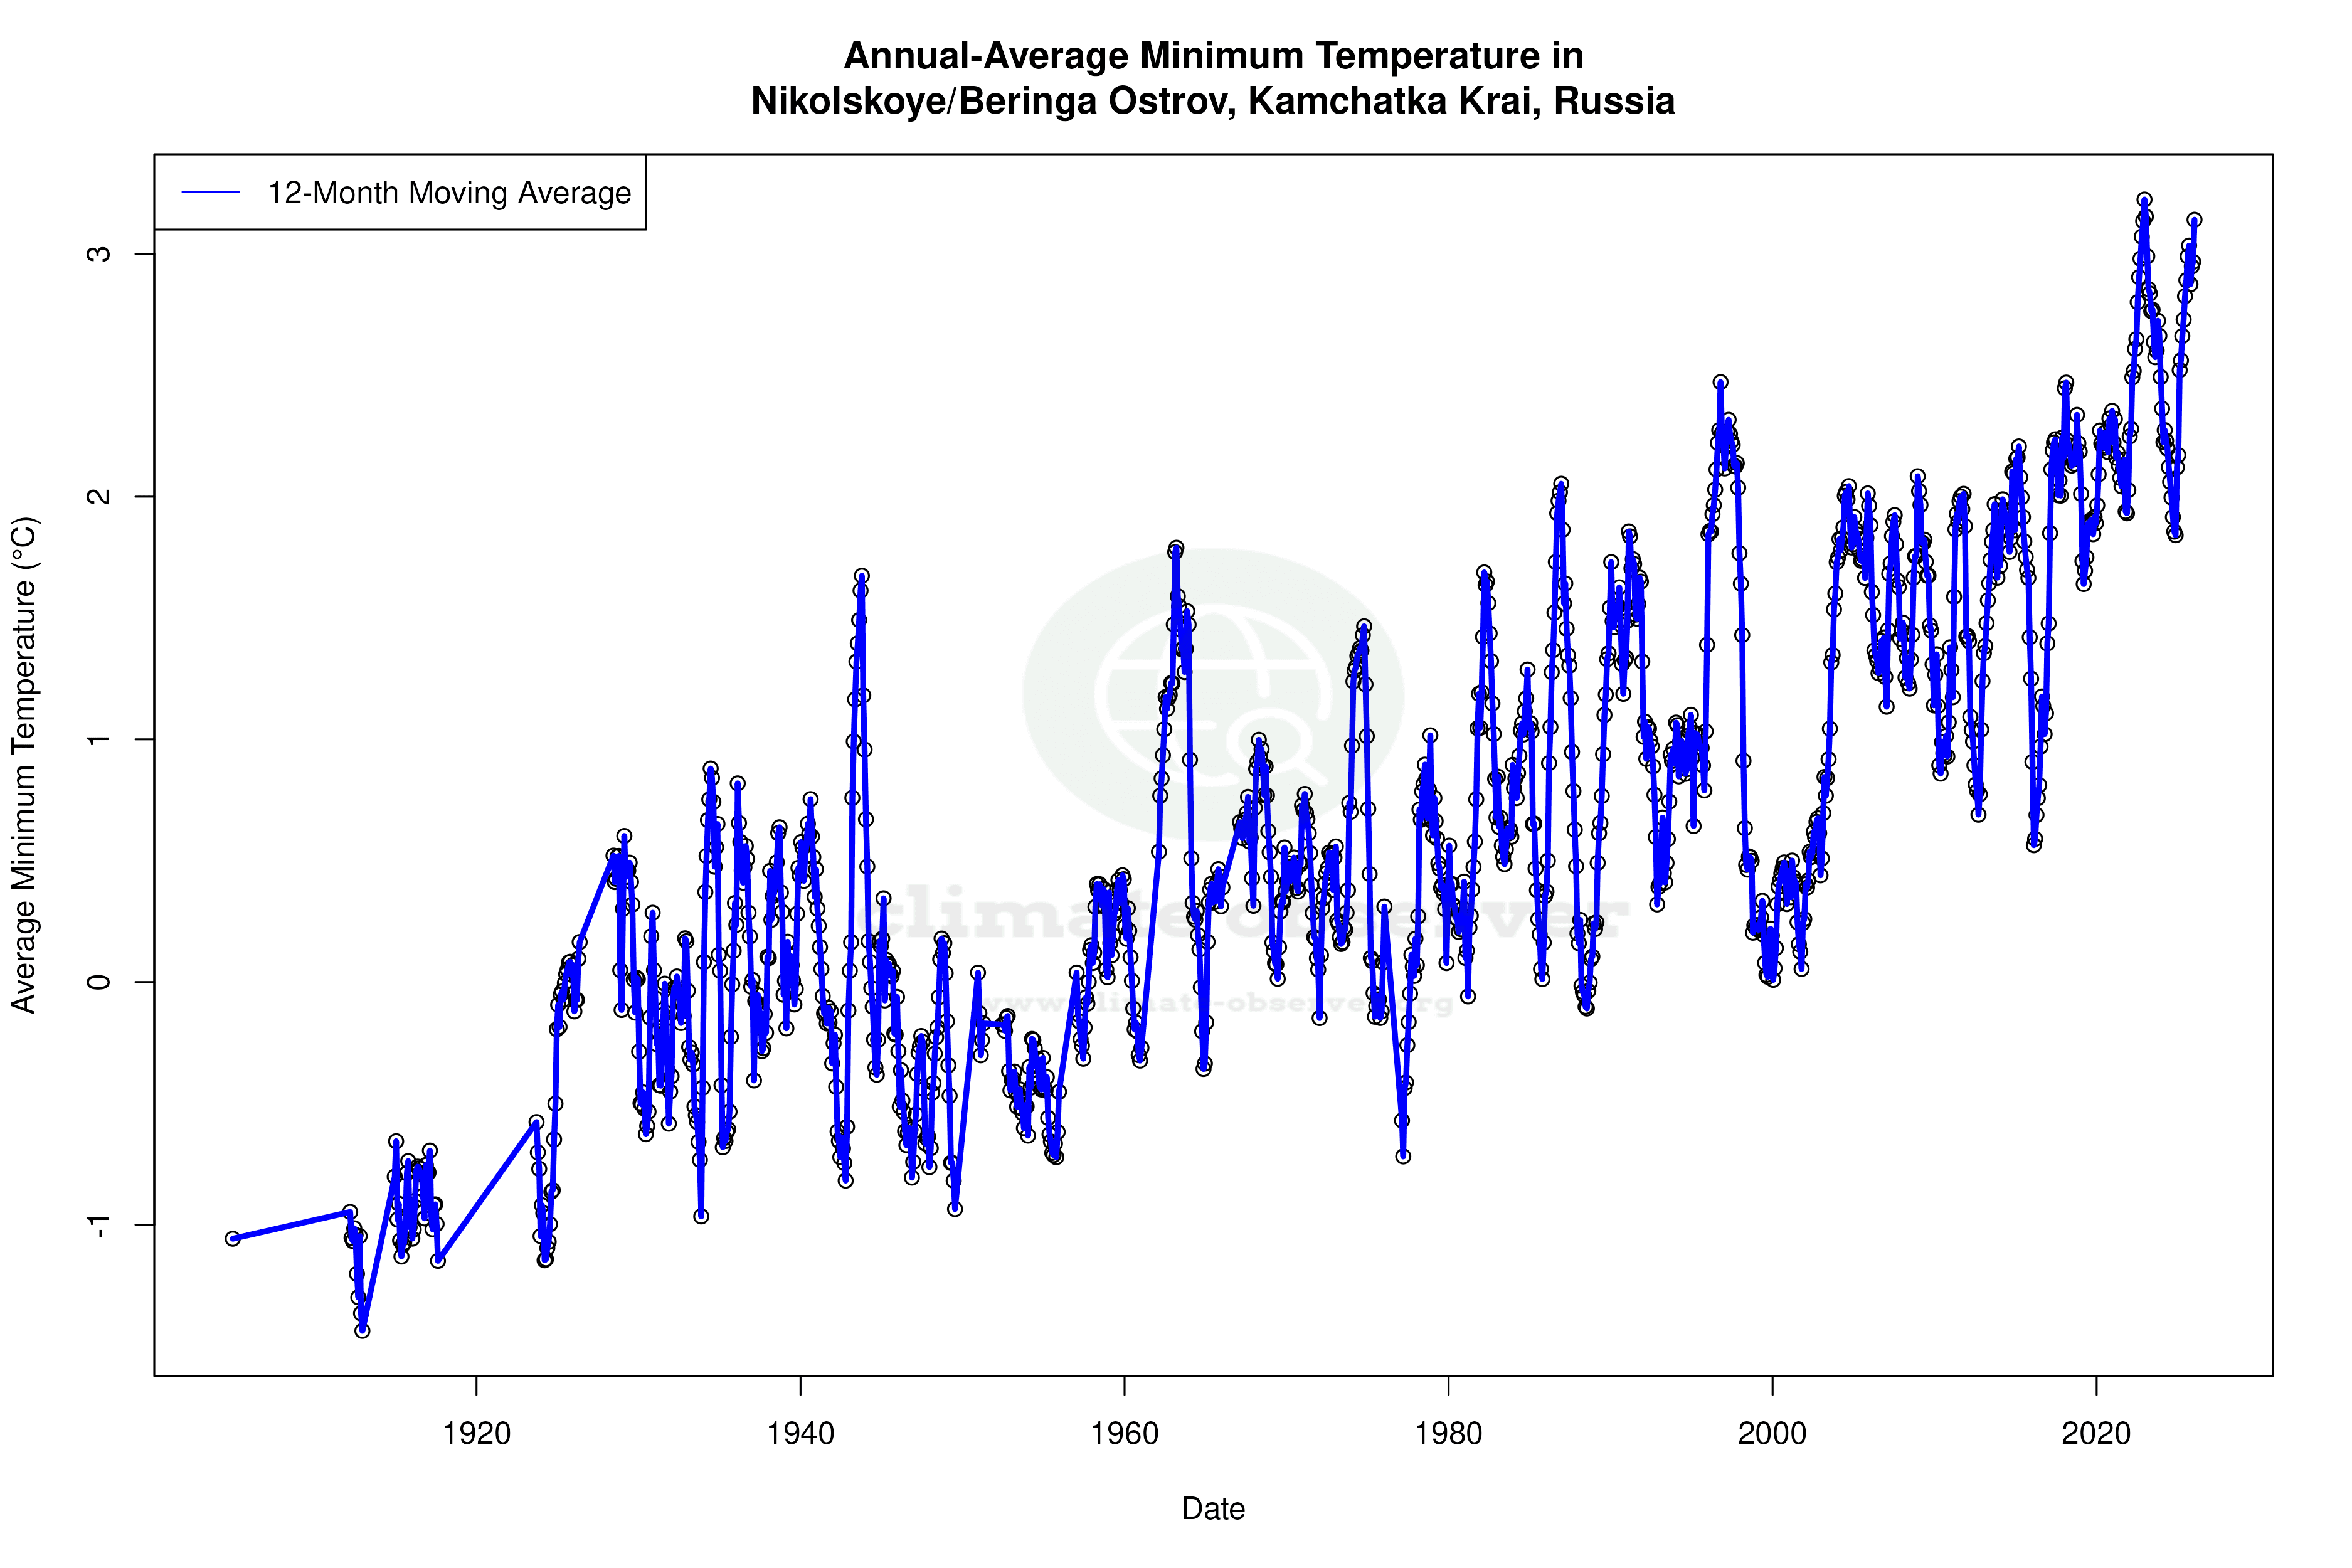


Max Temperature 12-Month MA | 1 of 6
Daily Data Points and Averages Throughout the Year

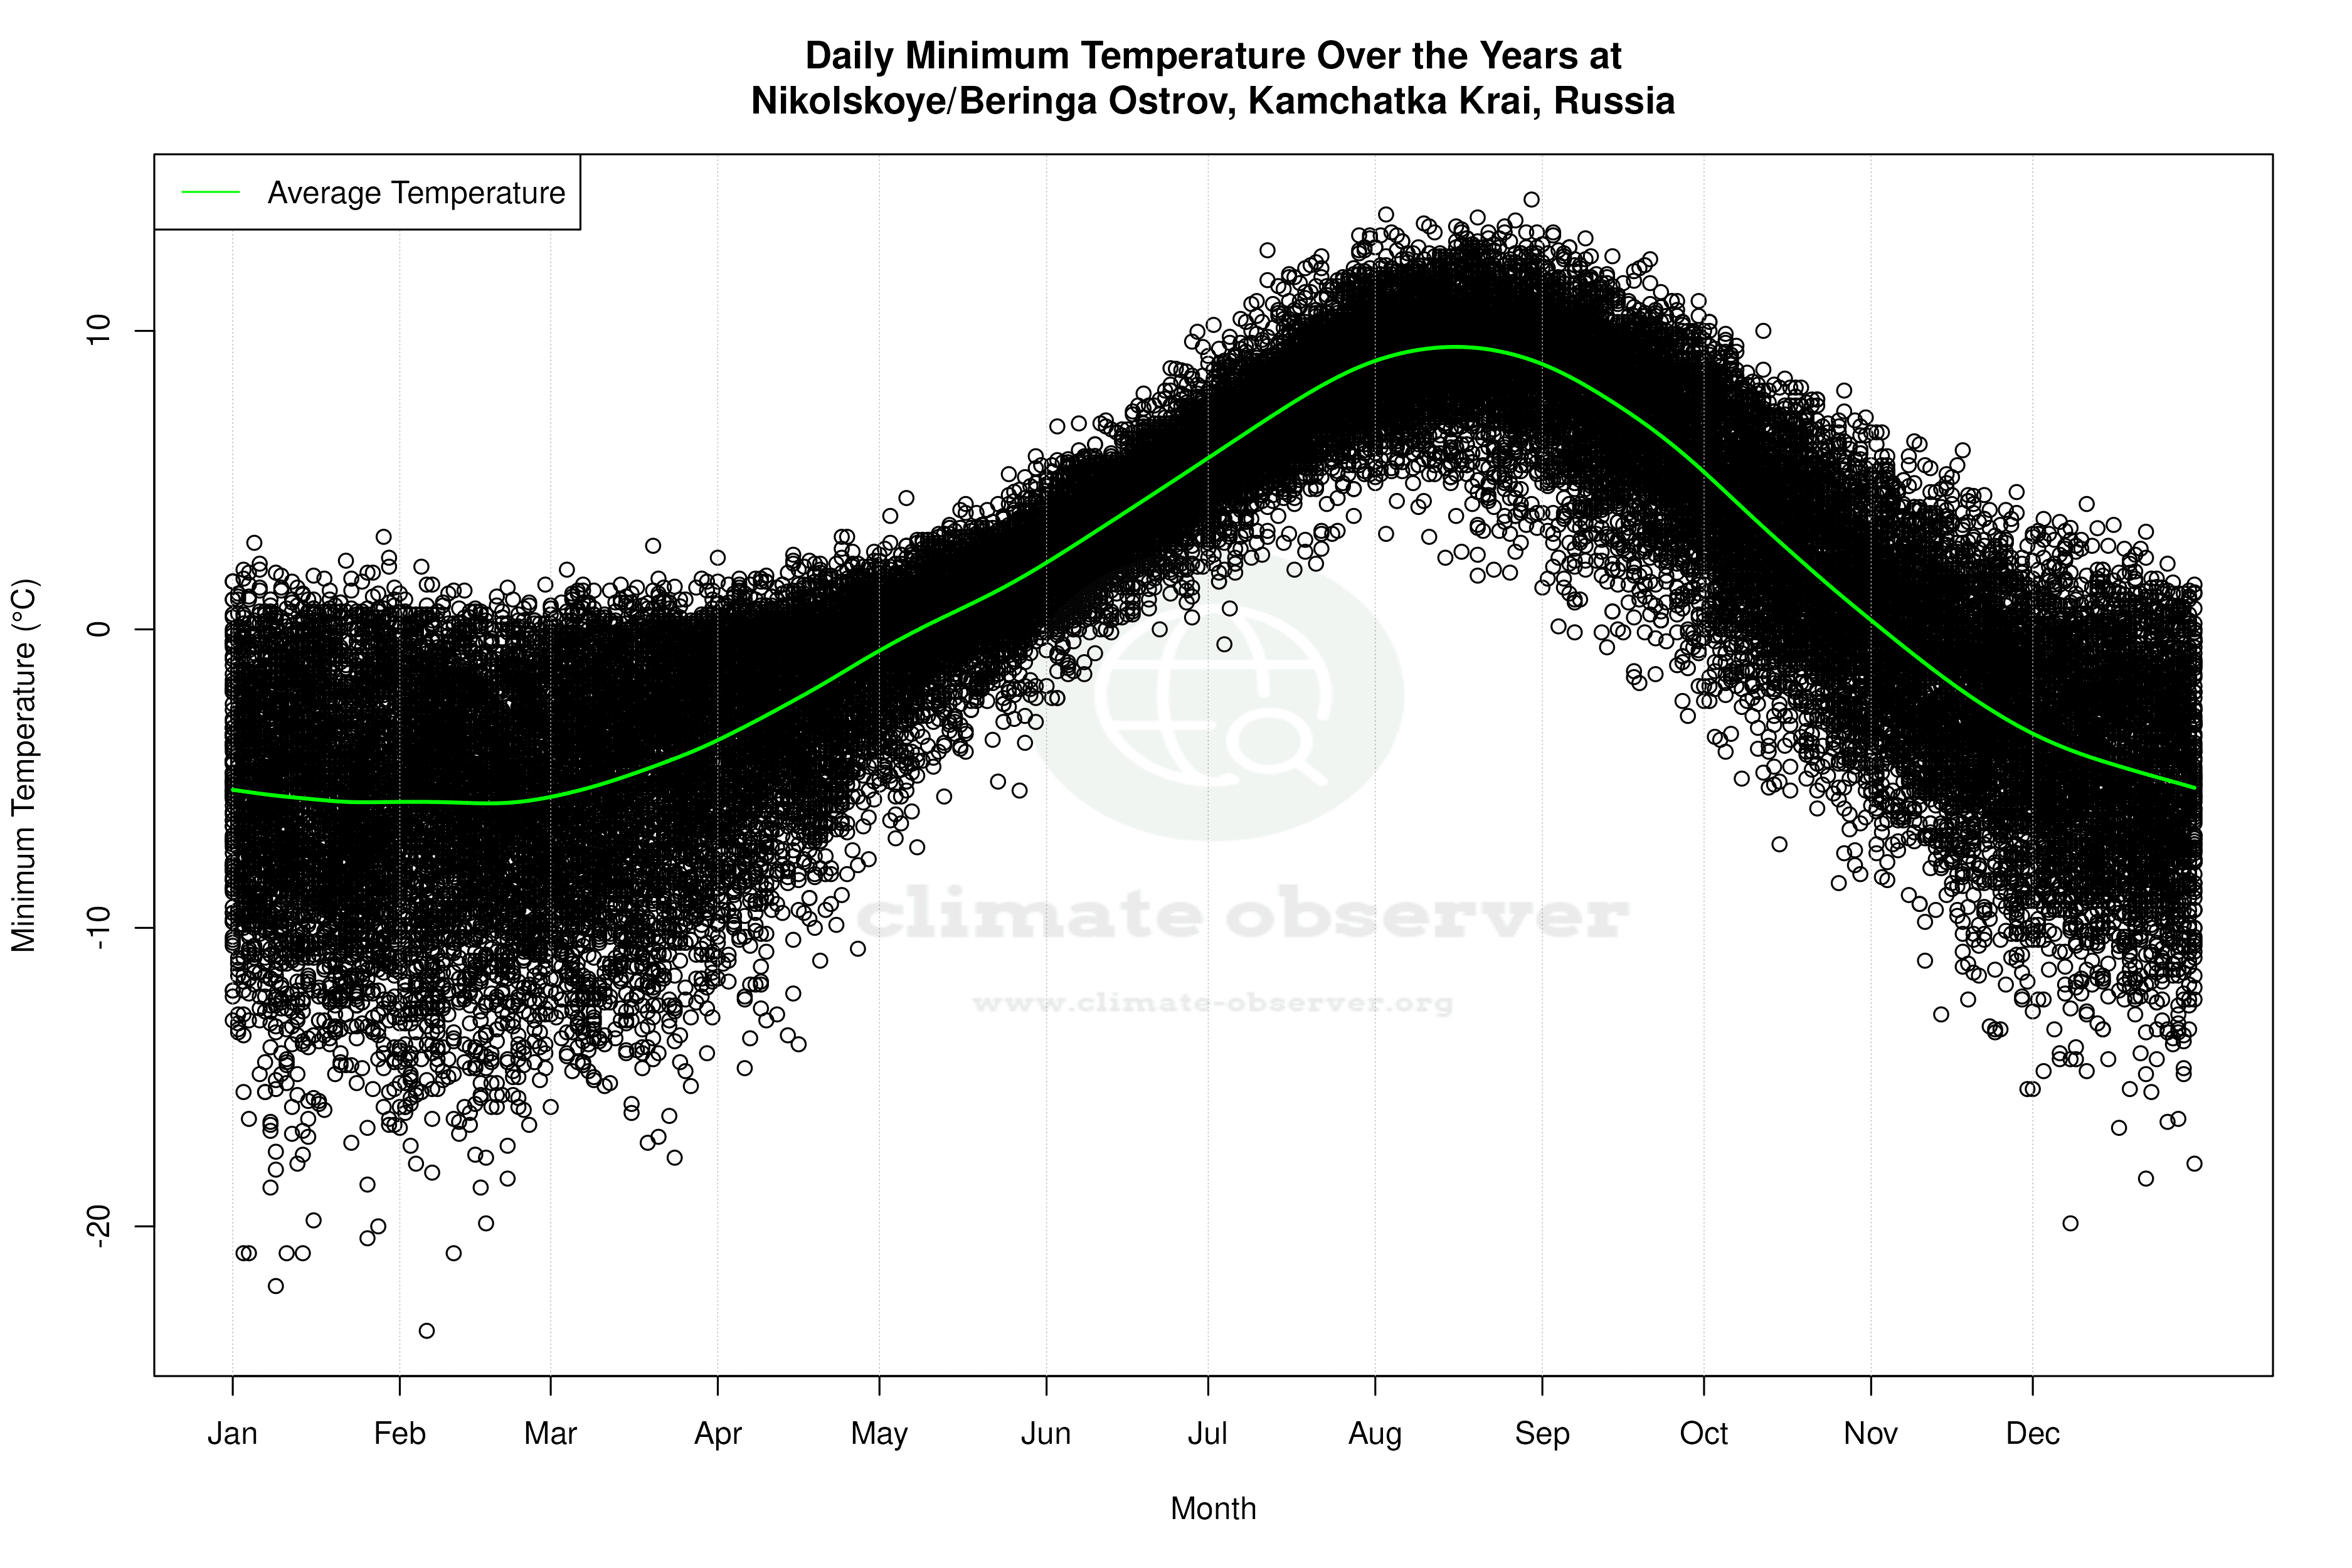


Average Max Temperature Throughout Year | 1 of 5
