Climate for Station: Novorossijsk, Krasnodar Krai, Russia
Loading live weather...
Climate Analysis & Overview
Novorossiysk is experiencing a warming trend with significant increases in both high and low temperatures over time. The Precipitation Concentration Index indicates a more even distribution of rainfall, suggesting a shift towards more consistent precipitation patterns. These changes are set against the backdrop of Russia's climate goals, which aim to mitigate the effects of climate change.
Thermal Dynamics in Novorossiysk
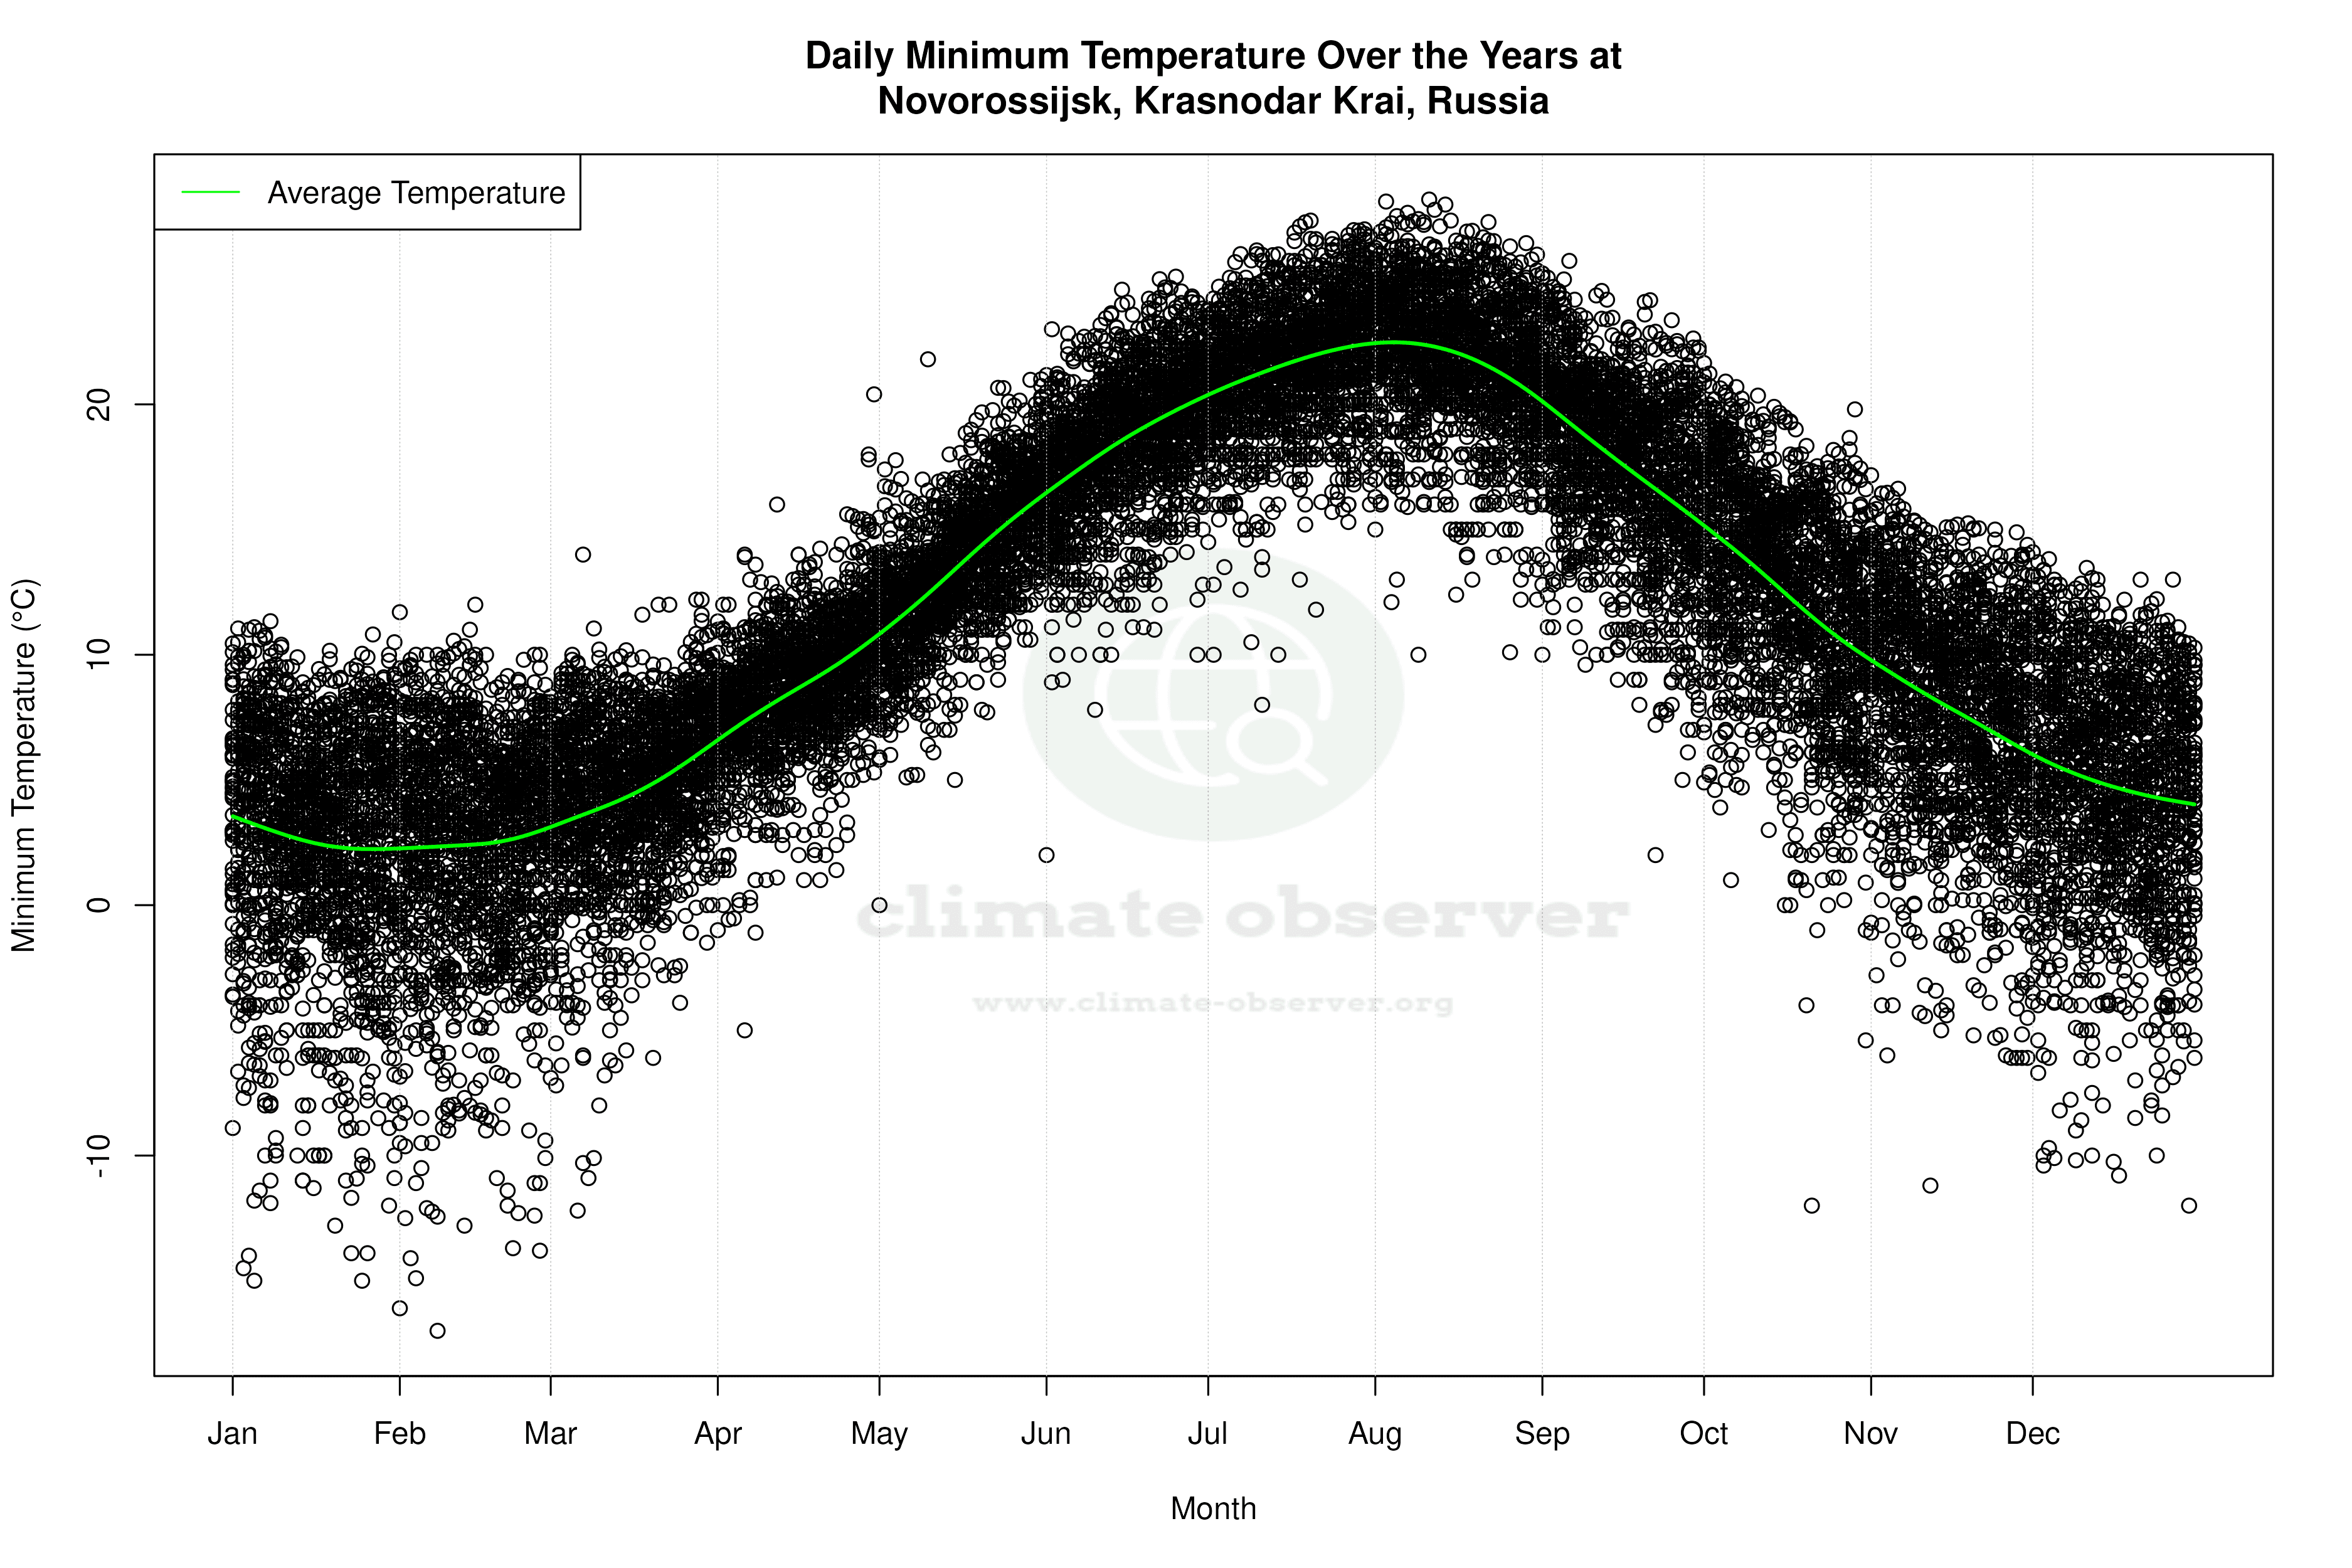
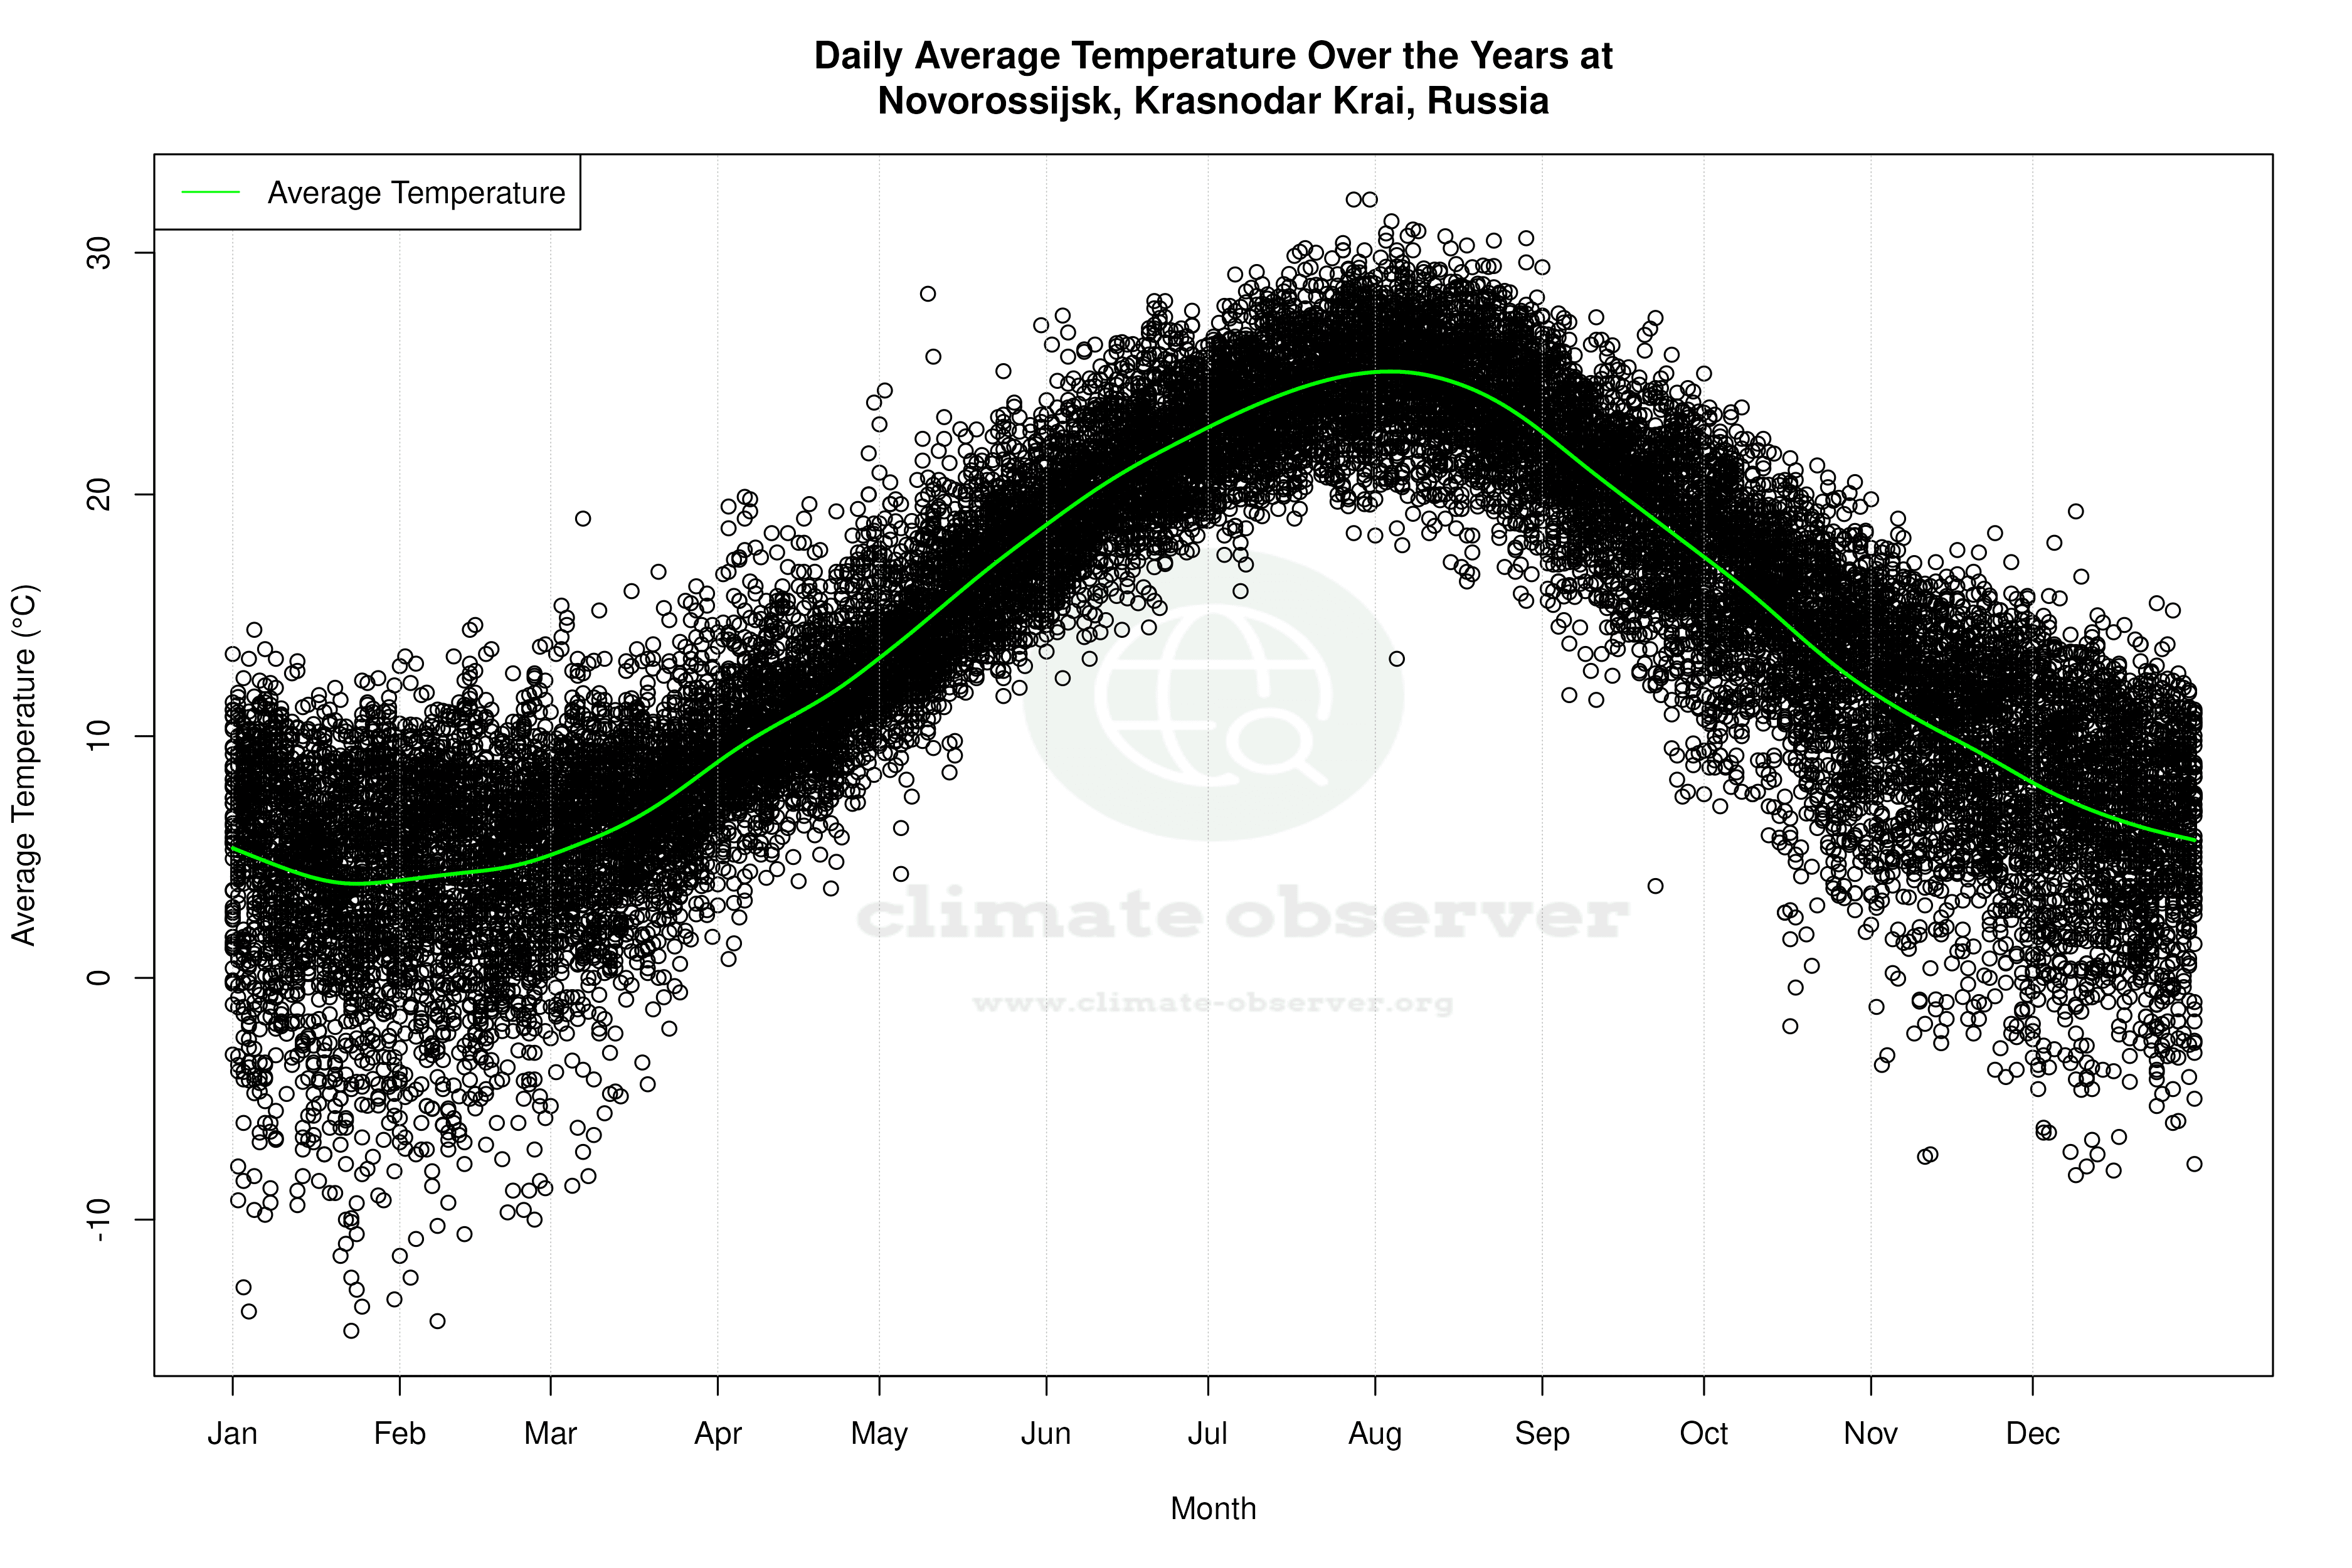
Situated on the northeastern coast of the Black Sea, Novorossiysk falls under the Cfa category of the Köppen climate classification, indicating a humid subtropical climate. The city's geographical position, flanked by the Caucasus Mountains, influences its weather patterns, leading to mild winters and warm summers. Over the past decade, the city has experienced a warming trend, with high temperatures increasing by 0.14°C (0.25°F) and low temperatures by 0.14°C (0.25°F). Over the longer term, the all-time trends reveal a more pronounced warming, with highs rising by 0.16°C (0.29°F) and lows by a substantial 0.64°C (1.15°F). This suggests a significant shift towards warmer conditions, especially during the cooler months.
Precipitation Patterns and Distribution
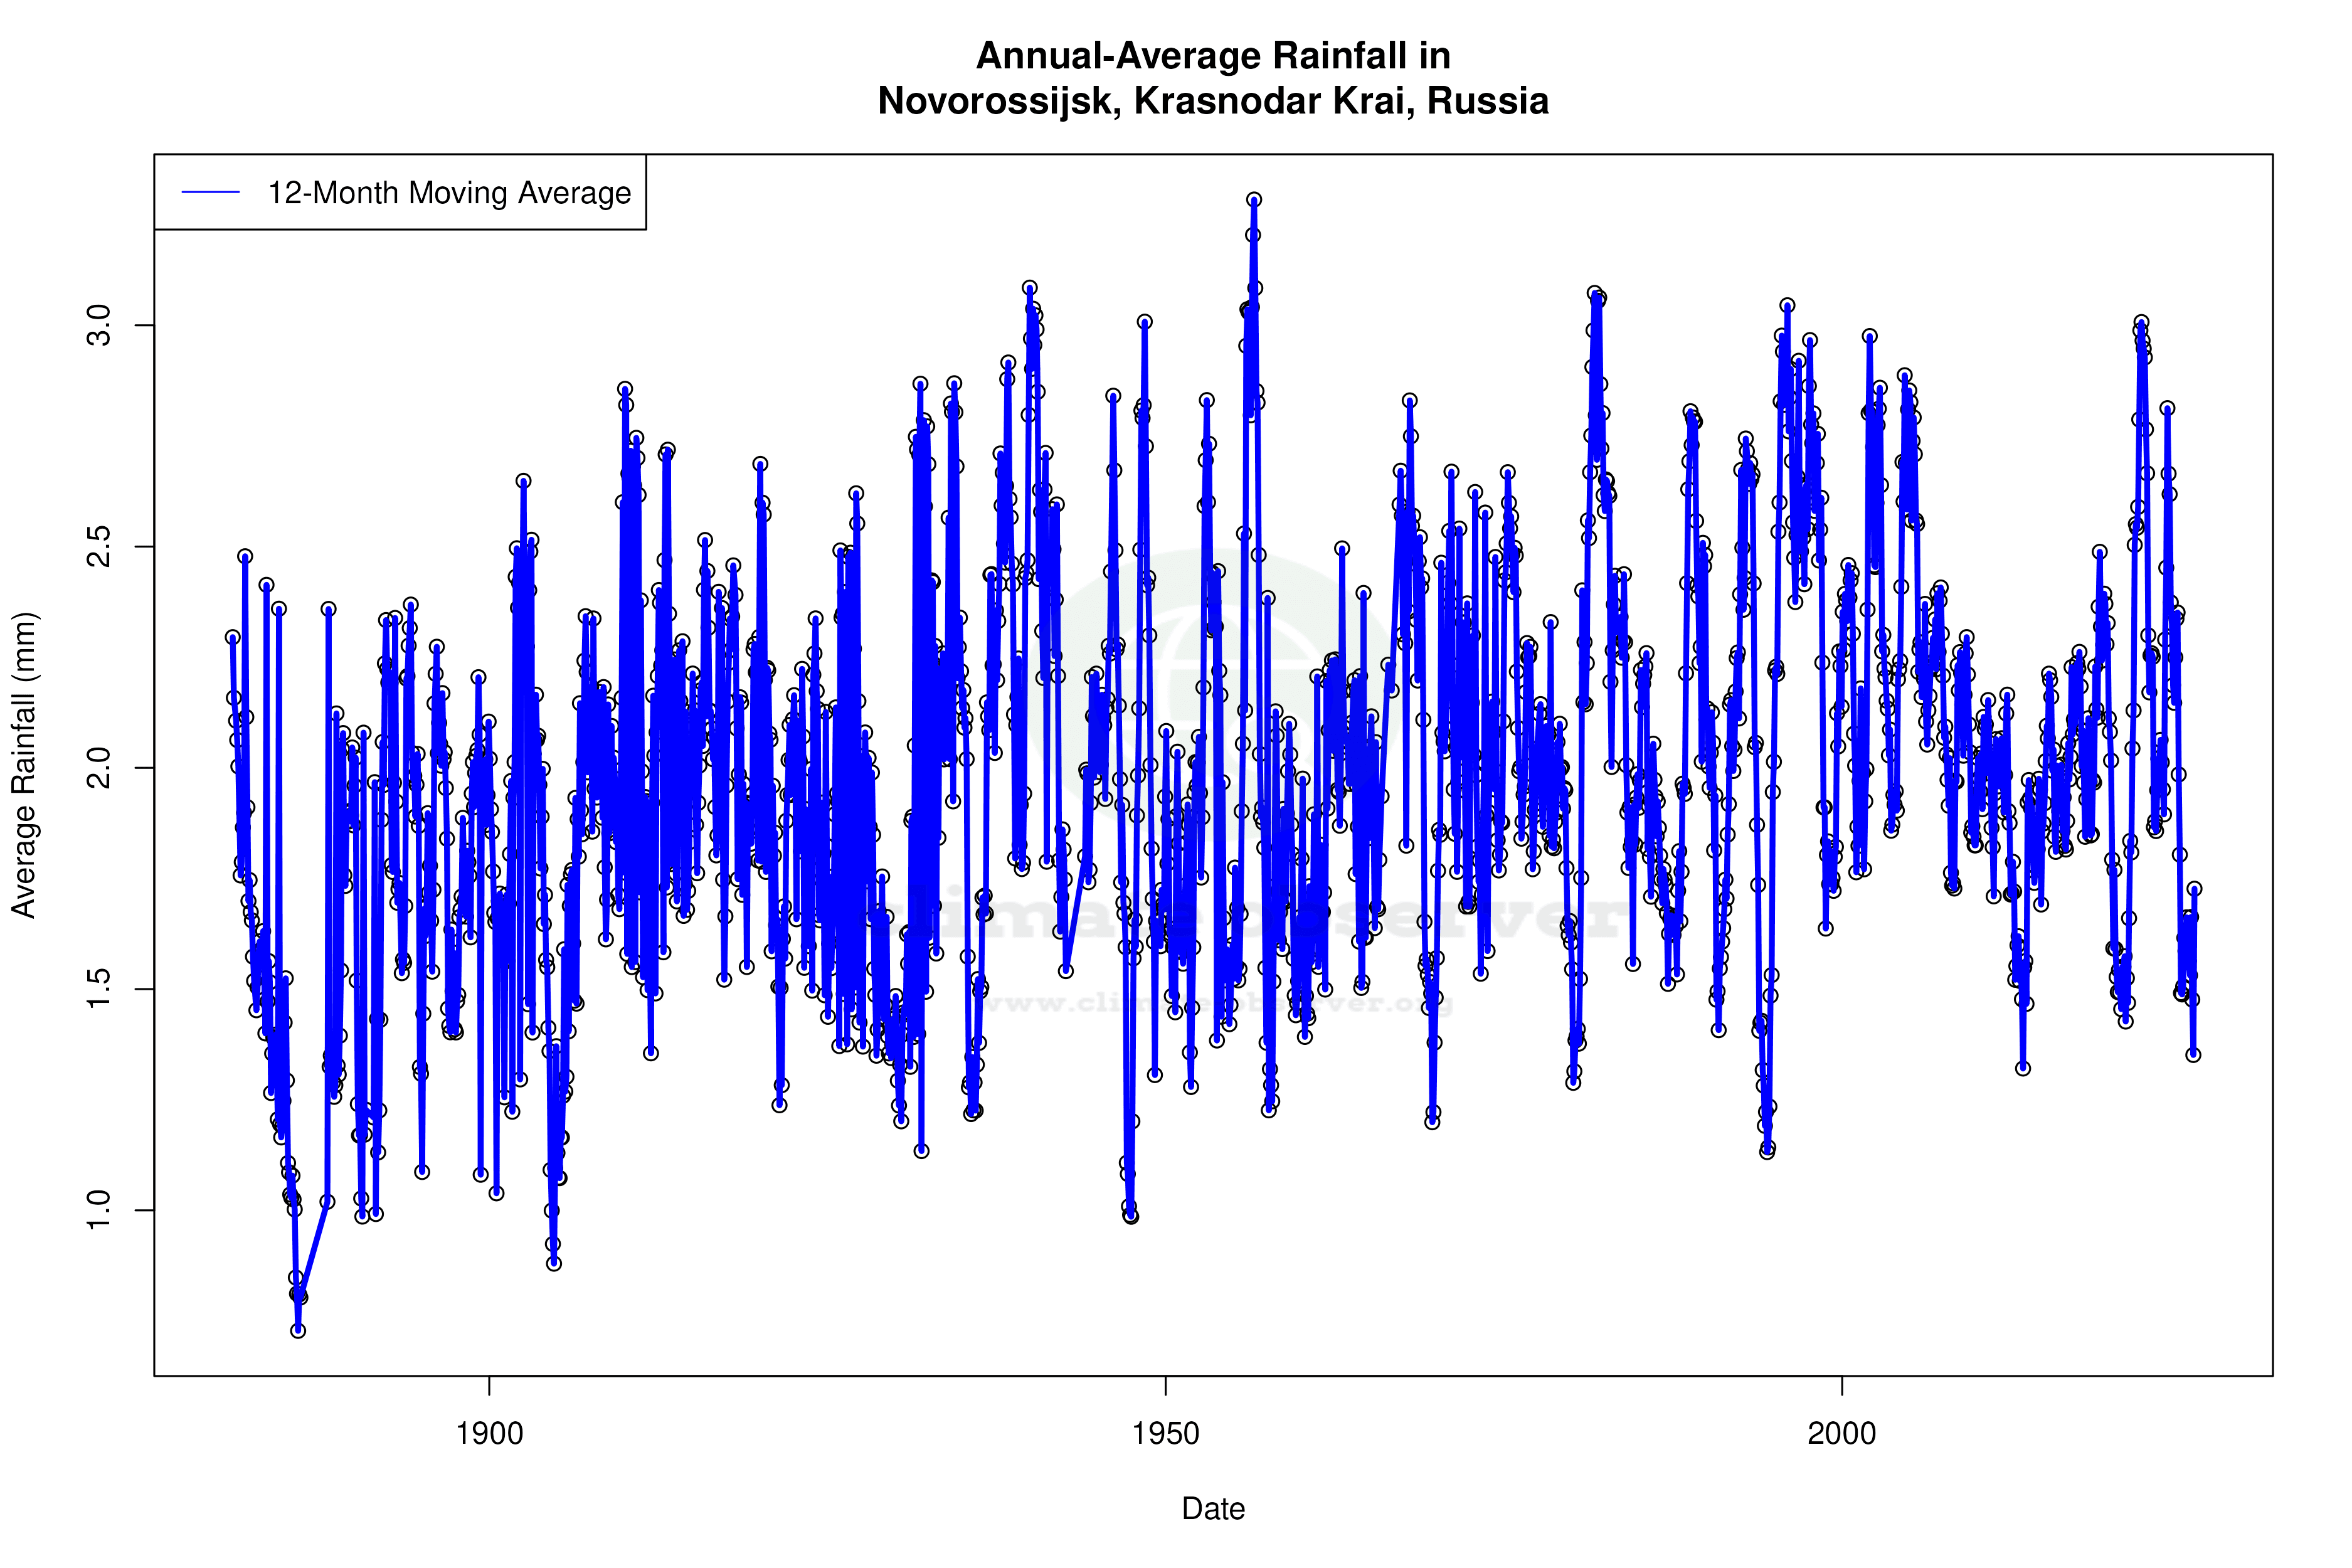
The Precipitation Concentration Index (PCI), which measures how rainfall is distributed over time, shows a slight decrease from a baseline of 12.18 to a current value of 11.61. This indicates a more even distribution of precipitation, reducing the likelihood of intense rainfall events concentrated in short periods. Such a change can lead to more stable water resources and less risk of flooding, aligning with regional efforts to adapt to changing climate conditions.
Extreme Weather Records
Novorossiysk's climate history includes notable temperature extremes, with record highs reaching 39.0°C (102.2°F) and record lows plummeting to -17.0°C (1.4°F). These extremes highlight the city's vulnerability to both heatwaves and cold snaps, phenomena that could become more frequent or intense with ongoing climate change. Understanding these records is crucial for planning and resilience strategies, particularly in the context of Russia's broader climate adaptation initiatives.
Regional Climate Goals and Implications
Russia's climate goals focus on reducing greenhouse gas emissions and enhancing resilience to climate impacts. The observed warming trends in Novorossiysk underscore the importance of these goals. As temperatures continue to rise, the city may face challenges related to heat stress, water resource management, and infrastructure resilience. The more even distribution of precipitation, as indicated by the PCI, offers a silver lining, potentially easing some of the pressures associated with extreme weather events. However, continued monitoring and adaptive strategies will be essential to address the multifaceted impacts of climate change in this region.
Station Statistics
10-Year Trend
High: +0.11 °F/decade
Low: +0.62 °F/decade
Rain: -0.005 in/decade
25-Year Trend
High: +0.71 °F/decade
Low: +0.83 °F/decade
Rain: -0.004 in/decade
50-Year Trend
High: +0.48 °F/decade
Low: +1.49 °F/decade
Rain: -0.001 in/decade
All-Time Trend
High: +0.46 °F/decade
Low: +1.49 °F/decade
Rain: +0.001 in/decade
Percentage Above-Average Days
Last 12 Months: 48.8%
This Year: 49.8%
Precipitation Concentration Index (PCI) ℹ️
Last 12 Months: 12.0
Historical Average: 11.4
Percentile Rank of Last 12 Months ℹ️
High: 78th percentile
Low: 85th percentile
Rain: 34th percentile
Change in Variance ℹ️
High: -11.1%
Low: -8.2%
Intraday: -71.9%
Data Coverage
54.6%
First Year of Data
1938
Station Location
Historical Weather Records
| Max High | Avg High | Min High | Max Avg | Avg Avg | Min Avg | Max Low | Avg Low | Min Low | Max Precipitation | Avg Precipitation | Max Snow | Avg Snow | |
|---|---|---|---|---|---|---|---|---|---|---|---|---|---|
| Record | 102.20 °F | — | 12.02 °F | 89.96 °F | — | 5.72 °F | 82.72 °F | — | 1.40 °F | 3.89 in | — | — | — |
| January | 73.04 °F | 43.80 °F | 12.02 °F | 57.92 °F | 39.82 °F | 5.72 °F | 52.41 °F | 36.78 °F | 5.00 °F | 2.83 in | 0.10 in | — | — |
| February | 69.80 °F | 43.84 °F | 14.36 °F | 58.28 °F | 40.03 °F | 6.44 °F | 53.60 °F | 36.54 °F | 1.40 °F | 3.33 in | 0.09 in | — | — |
| March | 74.12 °F | 47.78 °F | 21.02 °F | 66.20 °F | 44.07 °F | 16.52 °F | 57.20 °F | 40.32 °F | 10.04 °F | 3.89 in | 0.07 in | — | — |
| April | 82.40 °F | 55.55 °F | 34.75 °F | 74.84 °F | 51.77 °F | 33.40 °F | 68.72 °F | 47.63 °F | 23.00 °F | 2.13 in | 0.06 in | — | — |
| May | 89.06 °F | 64.30 °F | 46.63 °F | 82.94 °F | 60.67 °F | 39.74 °F | 71.24 °F | 56.47 °F | 32.00 °F | 2.32 in | 0.06 in | — | — |
| June | 100.40 °F | 73.36 °F | 58.84 °F | 82.40 °F | 69.53 °F | 54.32 °F | 77.18 °F | 65.36 °F | 35.60 °F | 3.27 in | 0.07 in | — | — |
| July | 102.20 °F | 79.56 °F | 65.79 °F | 89.96 °F | 75.45 °F | 60.80 °F | 81.21 °F | 70.85 °F | 46.40 °F | 3.77 in | 0.07 in | — | — |
| August | 96.98 °F | 80.65 °F | 64.22 °F | 88.34 °F | 75.95 °F | 55.76 °F | 82.72 °F | 71.39 °F | 50.00 °F | 3.73 in | 0.06 in | — | — |
| September | 93.20 °F | 72.90 °F | 51.80 °F | 84.92 °F | 67.99 °F | 38.84 °F | 78.31 °F | 63.80 °F | 35.60 °F | 3.44 in | 0.07 in | — | — |
| October | 84.56 °F | 63.27 °F | 30.20 °F | 77.00 °F | 58.44 °F | 28.40 °F | 70.97 °F | 54.44 °F | 10.40 °F | 3.35 in | 0.07 in | — | — |
| November | 75.20 °F | 54.21 °F | 19.94 °F | 67.64 °F | 50.13 °F | 18.68 °F | 62.91 °F | 46.34 °F | 11.84 °F | 2.96 in | 0.10 in | — | — |
| December | 68.00 °F | 47.45 °F | 20.97 °F | 66.74 °F | 43.98 °F | 17.31 °F | 57.38 °F | 40.61 °F | 10.40 °F | 2.91 in | 0.12 in | — | — |
Data Visualisations
Remove WatermarksCurrent Year Climate Trends vs Historical


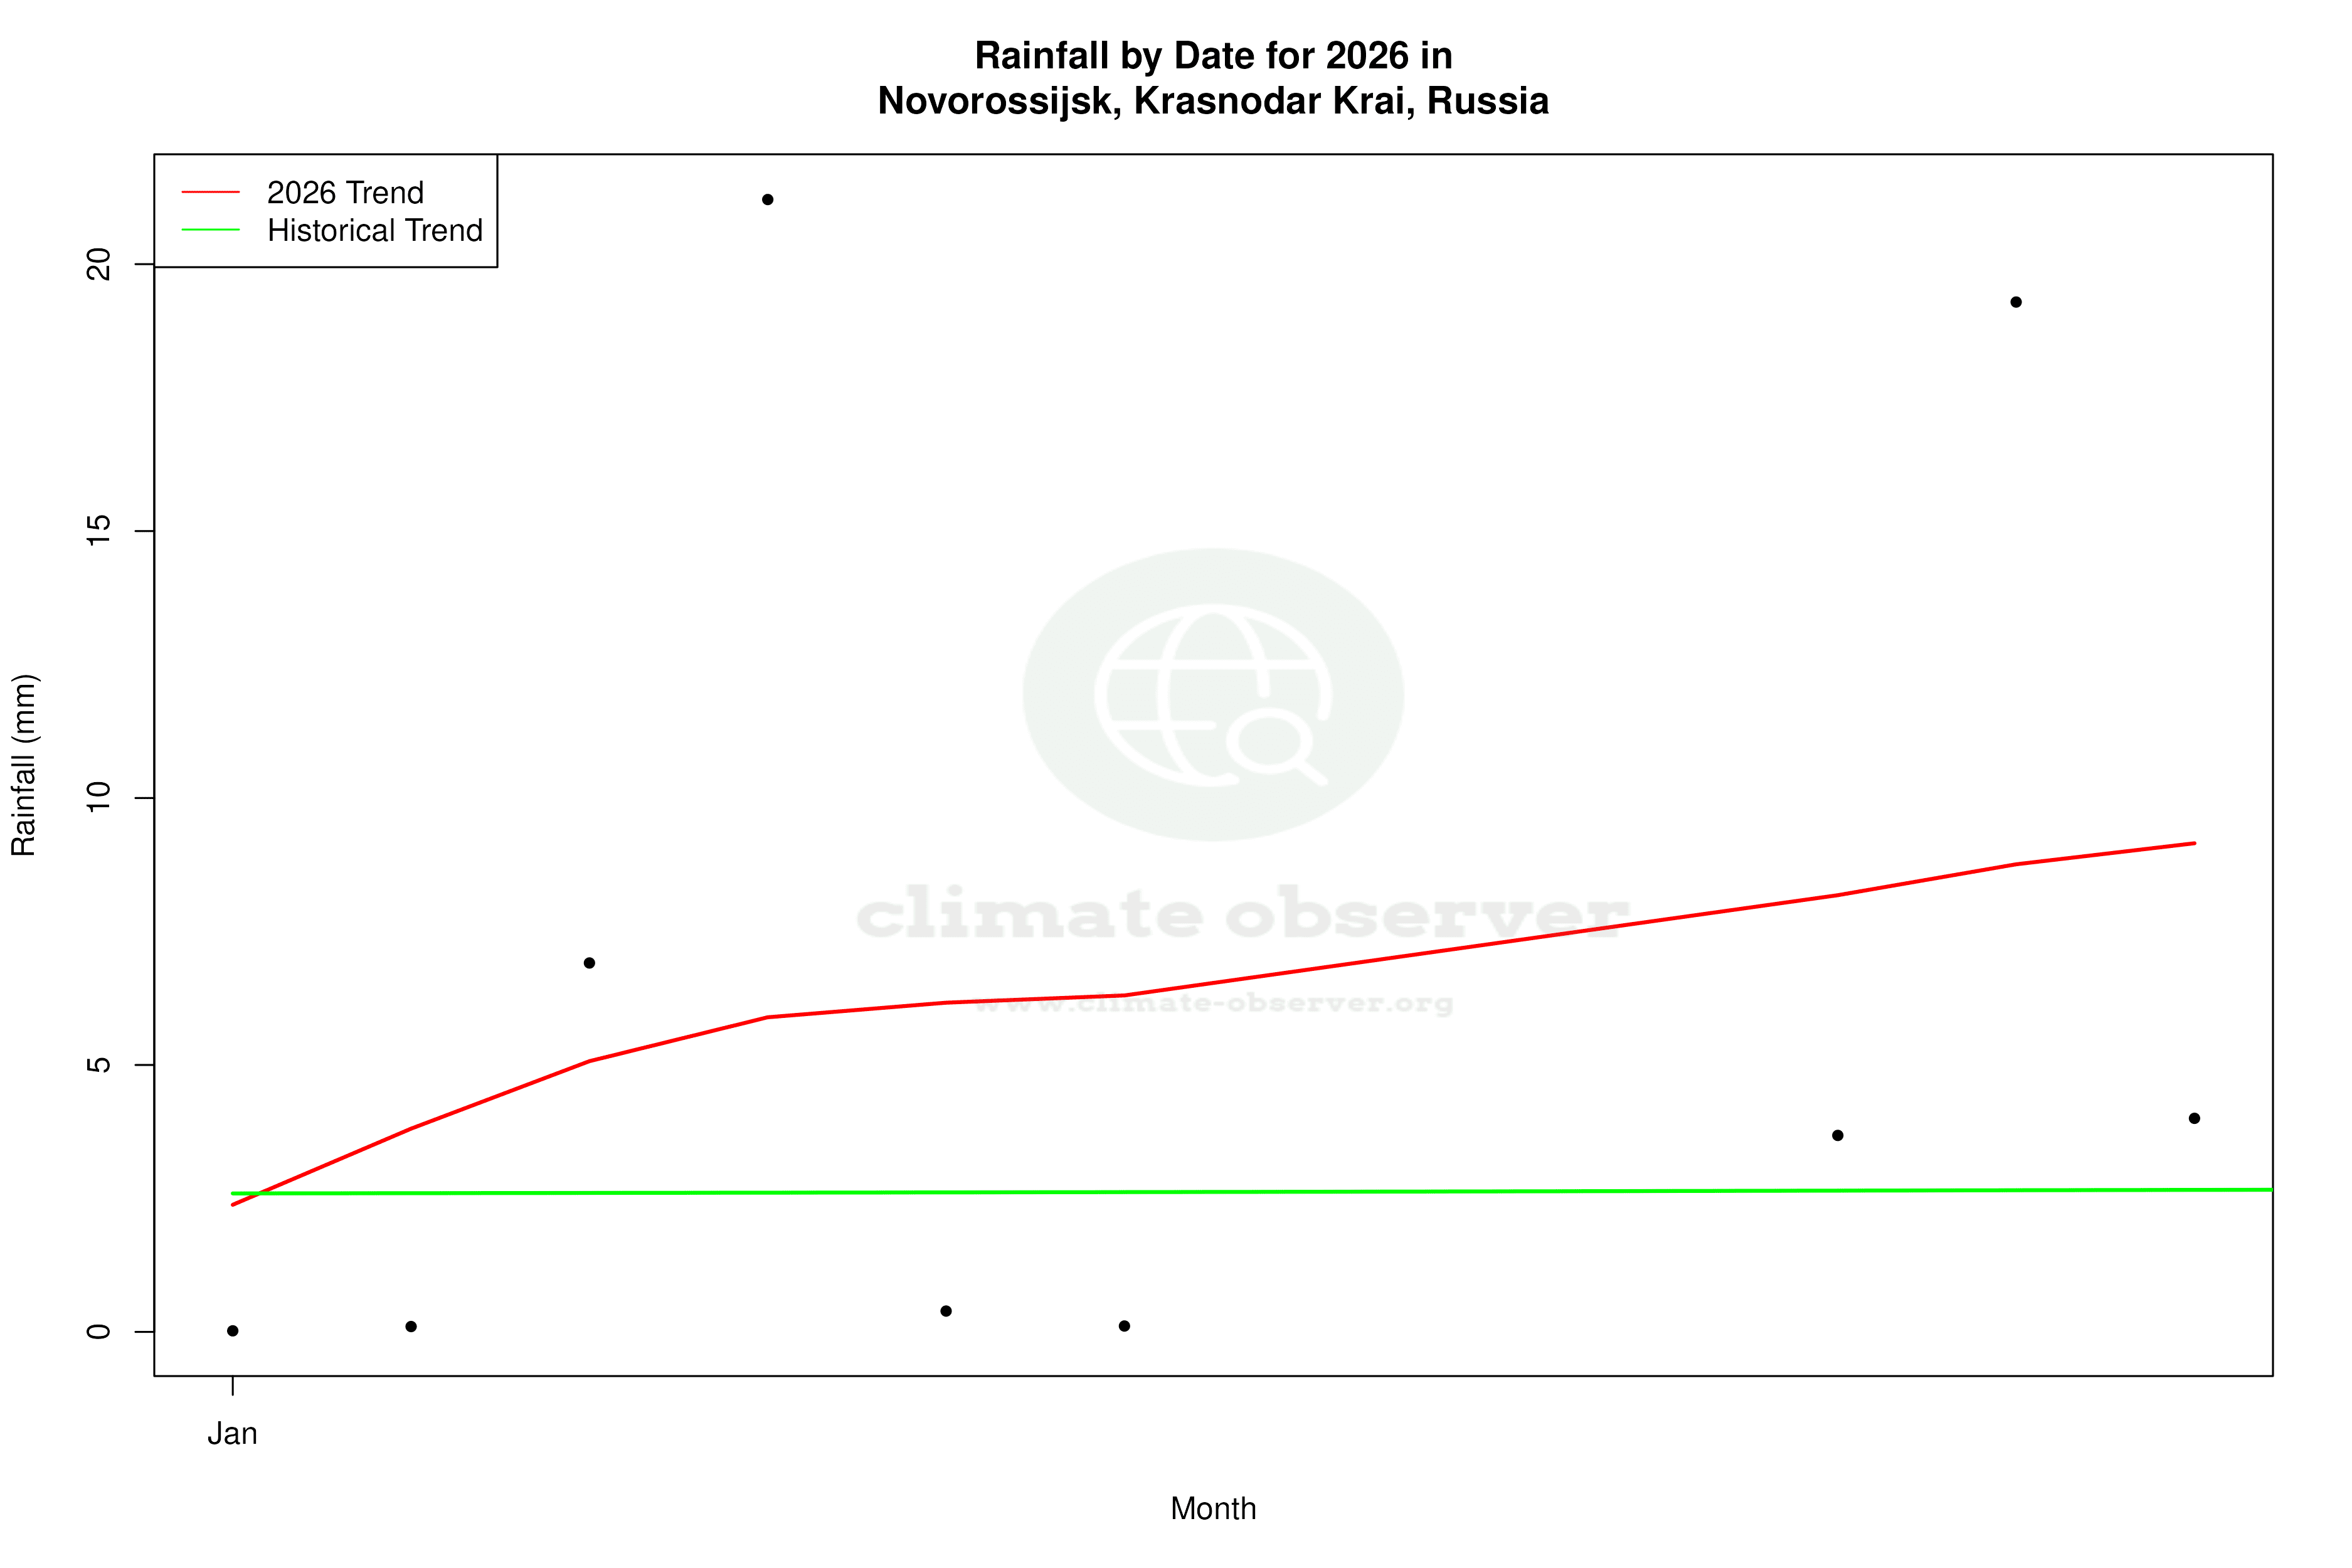


Max Temperature this Year | 1 of 6
Climate 12-Month Moving Averages
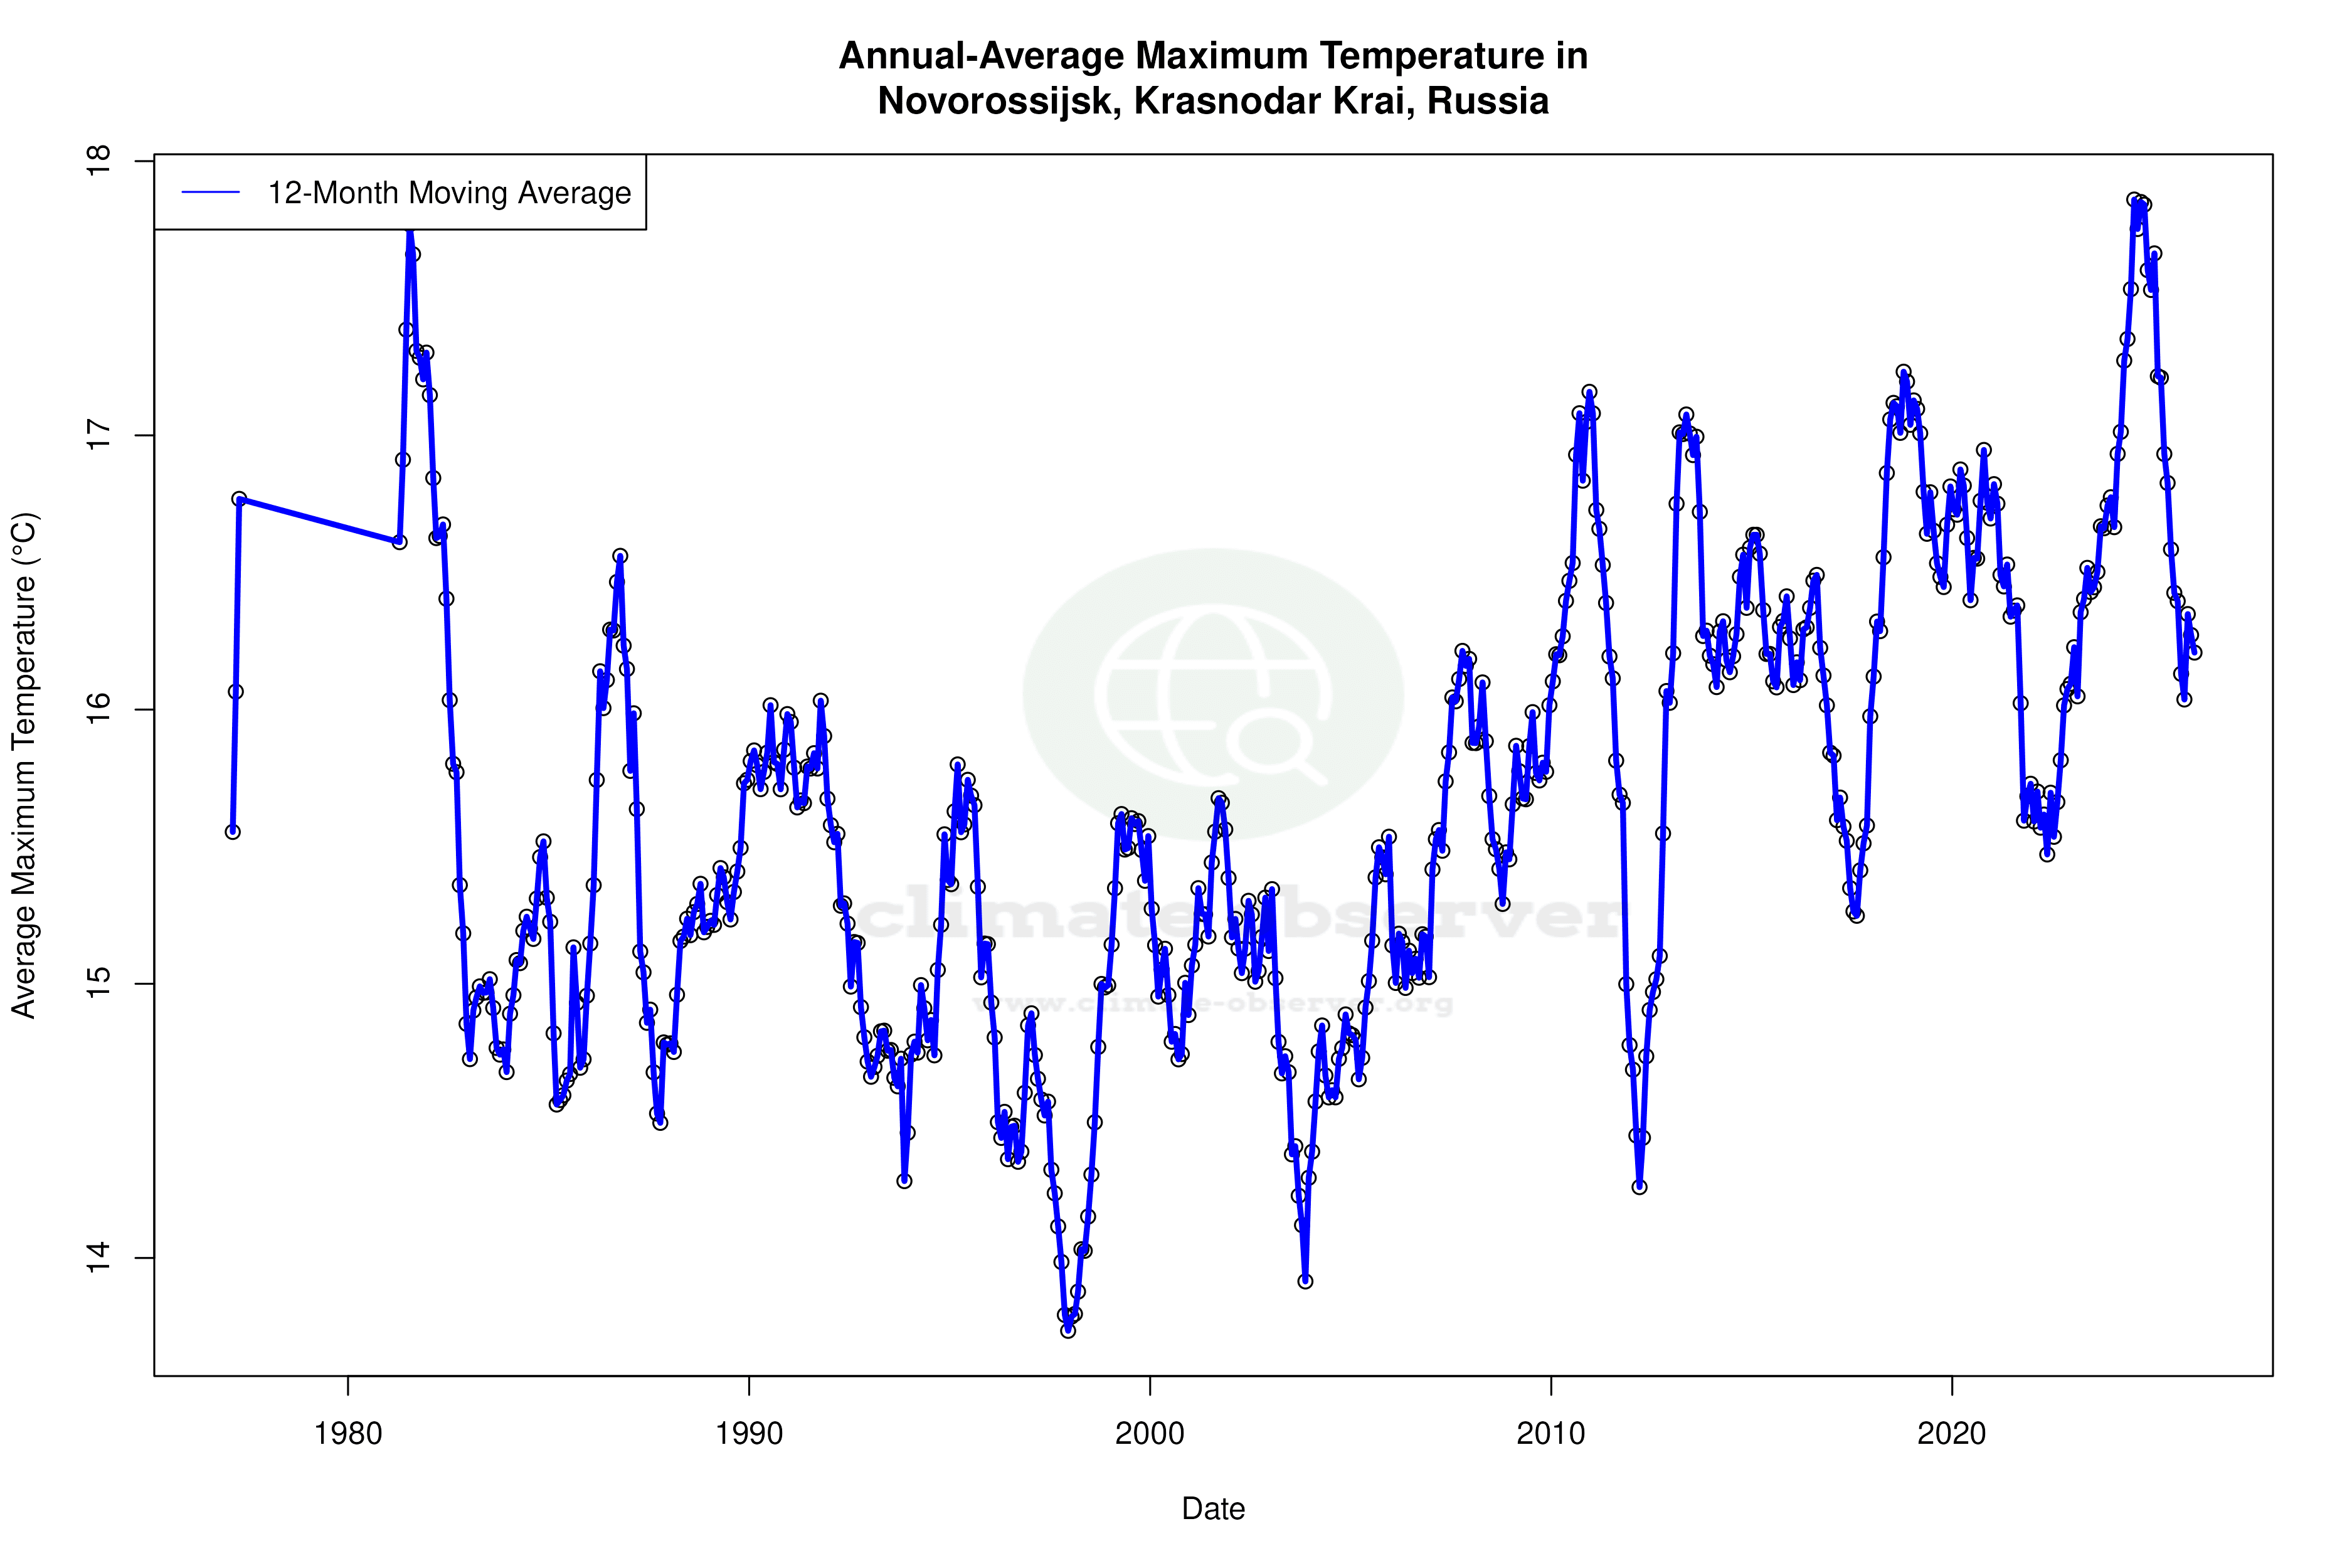


Max Temperature 12-Month MA | 1 of 6
Daily Data Points and Averages Throughout the Year
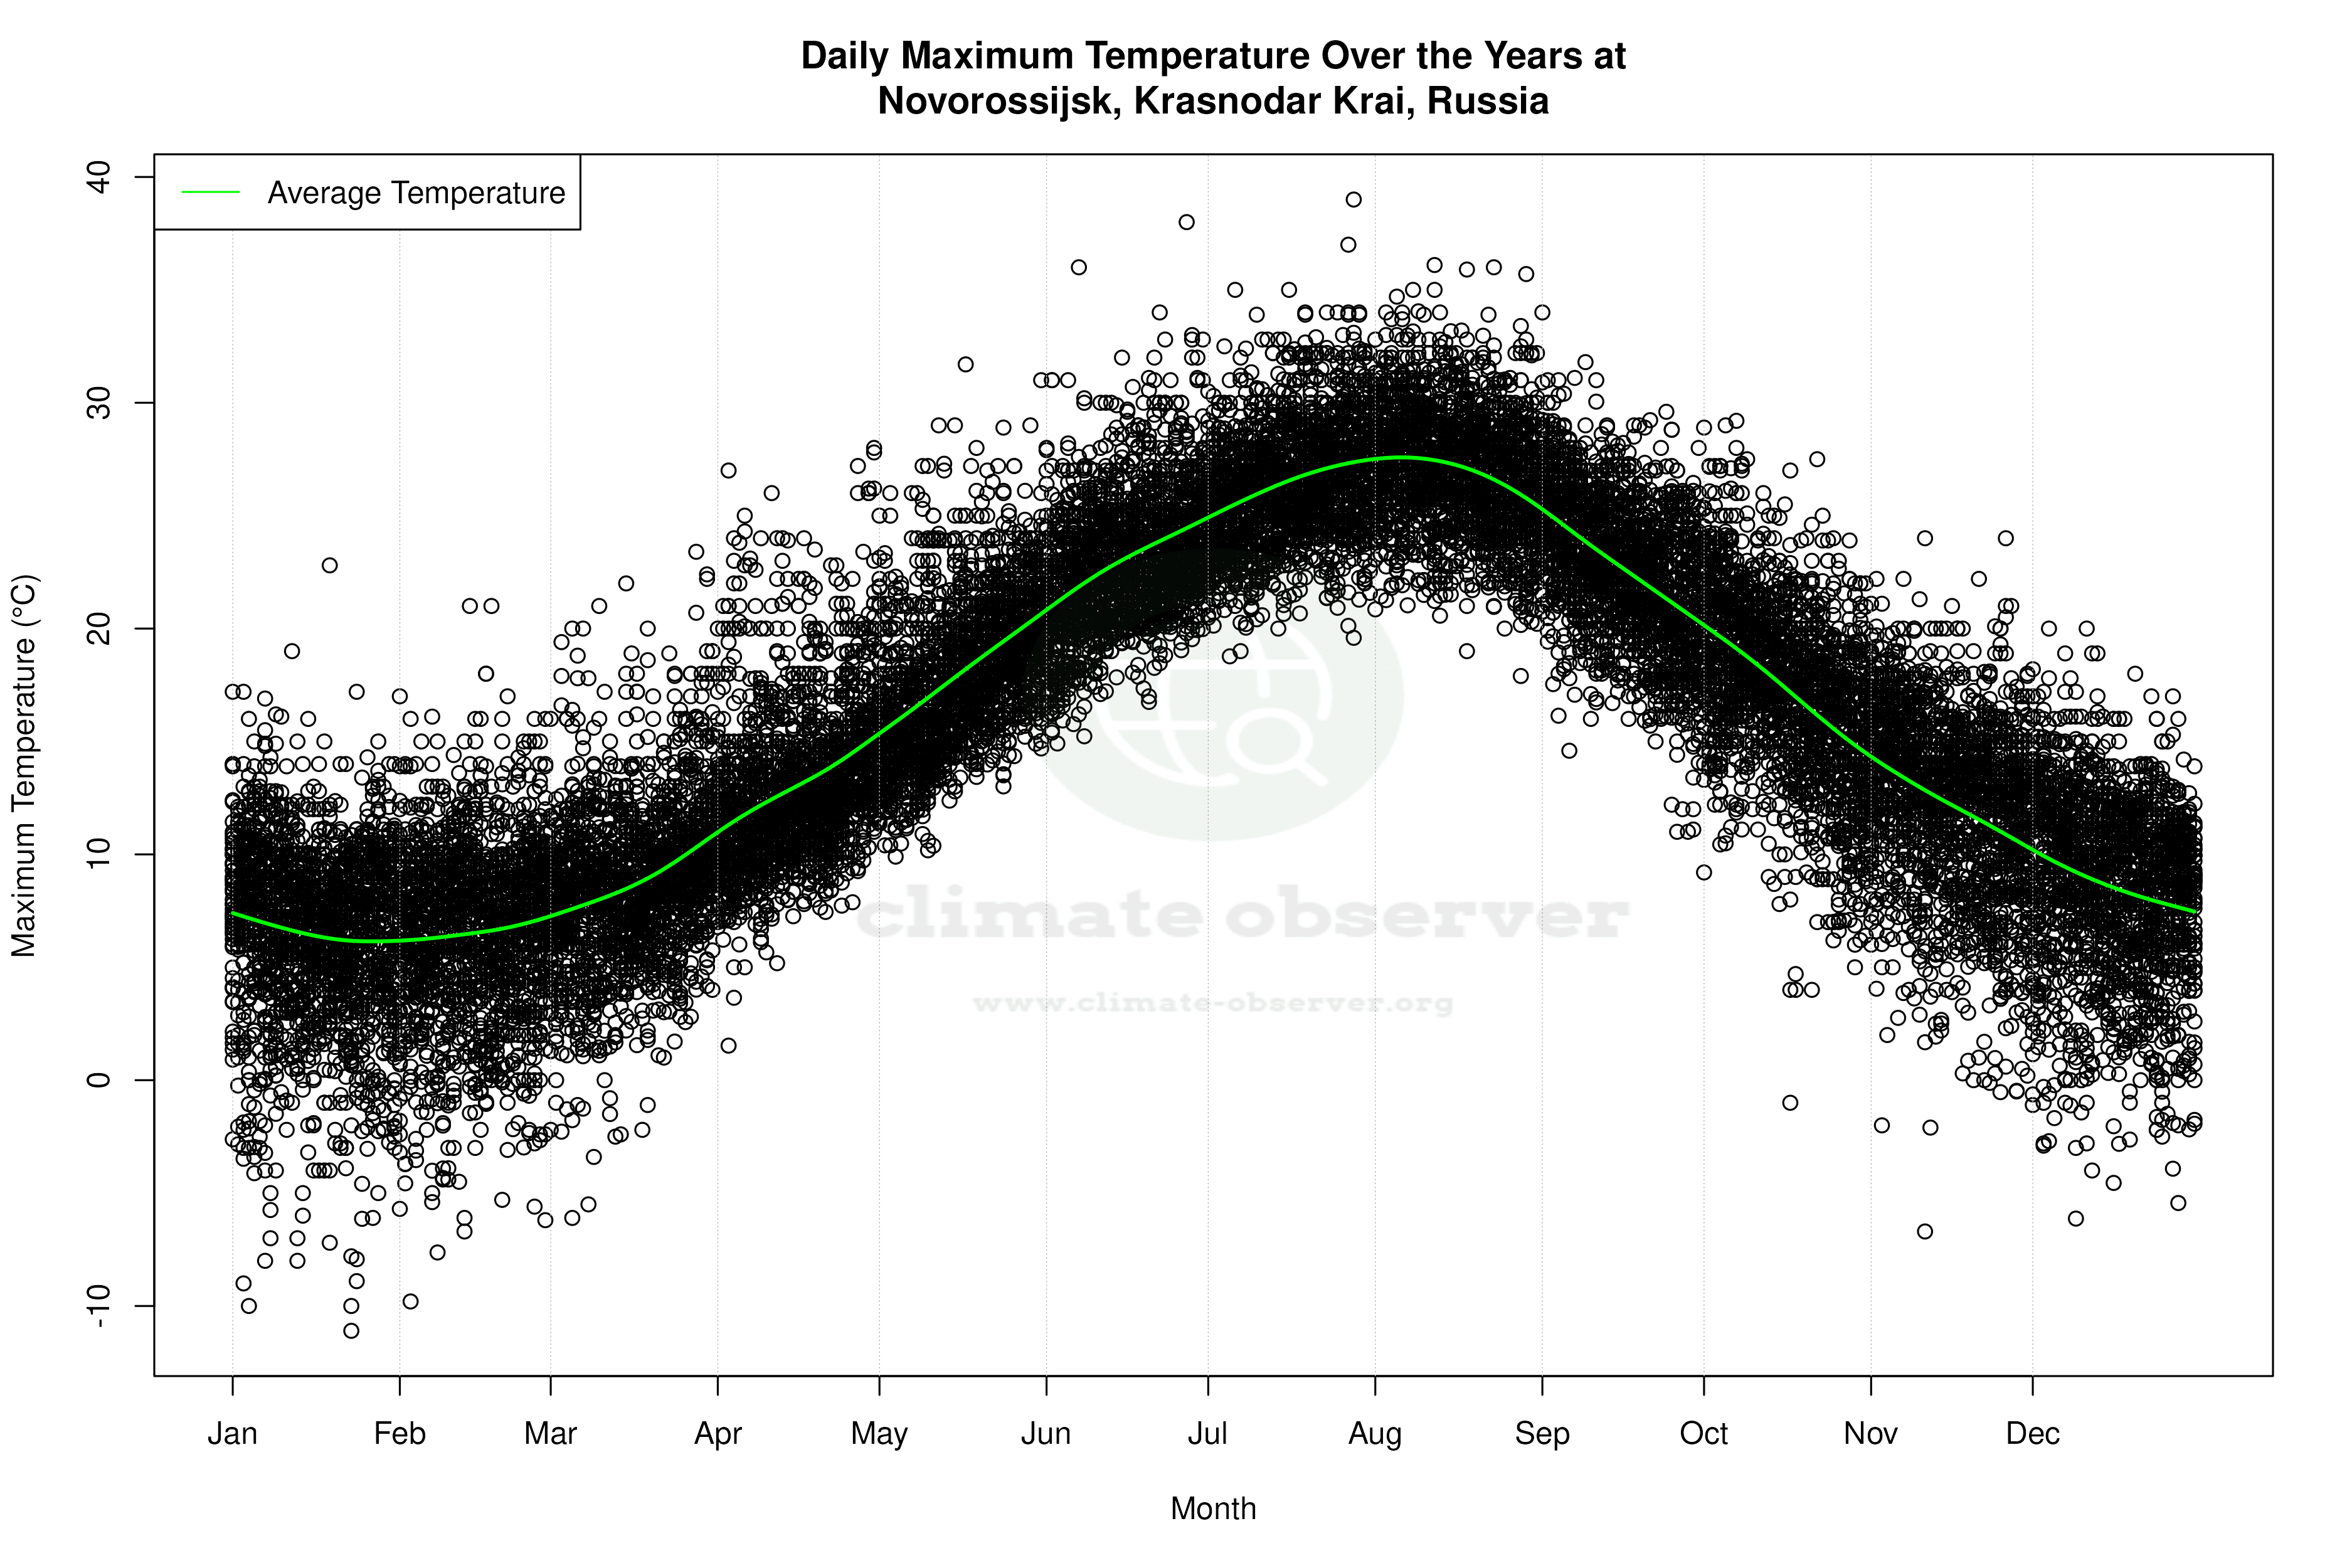


Average Max Temperature Throughout Year | 1 of 5
