Climate for Station: Al-Madinah, Al Madinah Region, Saudi Arabia
Loading live weather...
Climate Analysis & Overview
Al-Madinah experiences a nuanced climate characterised by a warming trend in high temperatures and a cooling trend in lows over the last decade. The precipitation pattern has shifted towards a more even distribution, potentially affecting local water resources and agriculture.
Desert Climate Dynamics
Al-Madinah, located at 24.55°N, 39.7°E, is classified under the BWh category of the Köppen climate classification, indicating a hot desert climate. This region is marked by extreme temperatures and minimal precipitation. The local geography, with its arid landscape and absence of significant water bodies, plays a crucial role in shaping its climate profile. The all-time temperature trends reveal a warming of 0.34°C (0.61°F) in high temperatures, suggesting an increase in heat intensity over the years. Conversely, the same period shows a cooling of 0.44°C (0.79°F) in low temperatures, indicating a more pronounced drop in nighttime temperatures.
Decadal Temperature Shifts
Over the past decade, Al-Madinah has experienced a more complex thermal pattern. High temperatures have shown a significant increase of 0.84°C (1.51°F), which may contribute to more frequent heatwaves during the summer months. In contrast, low temperatures have decreased by 0.23°C (0.41°F), highlighting a cooling trend during the cooler parts of the day. This divergence in temperature trends could be attributed to various factors, including urban heat effects and changes in atmospheric circulation patterns.
Precipitation Patterns and Implications
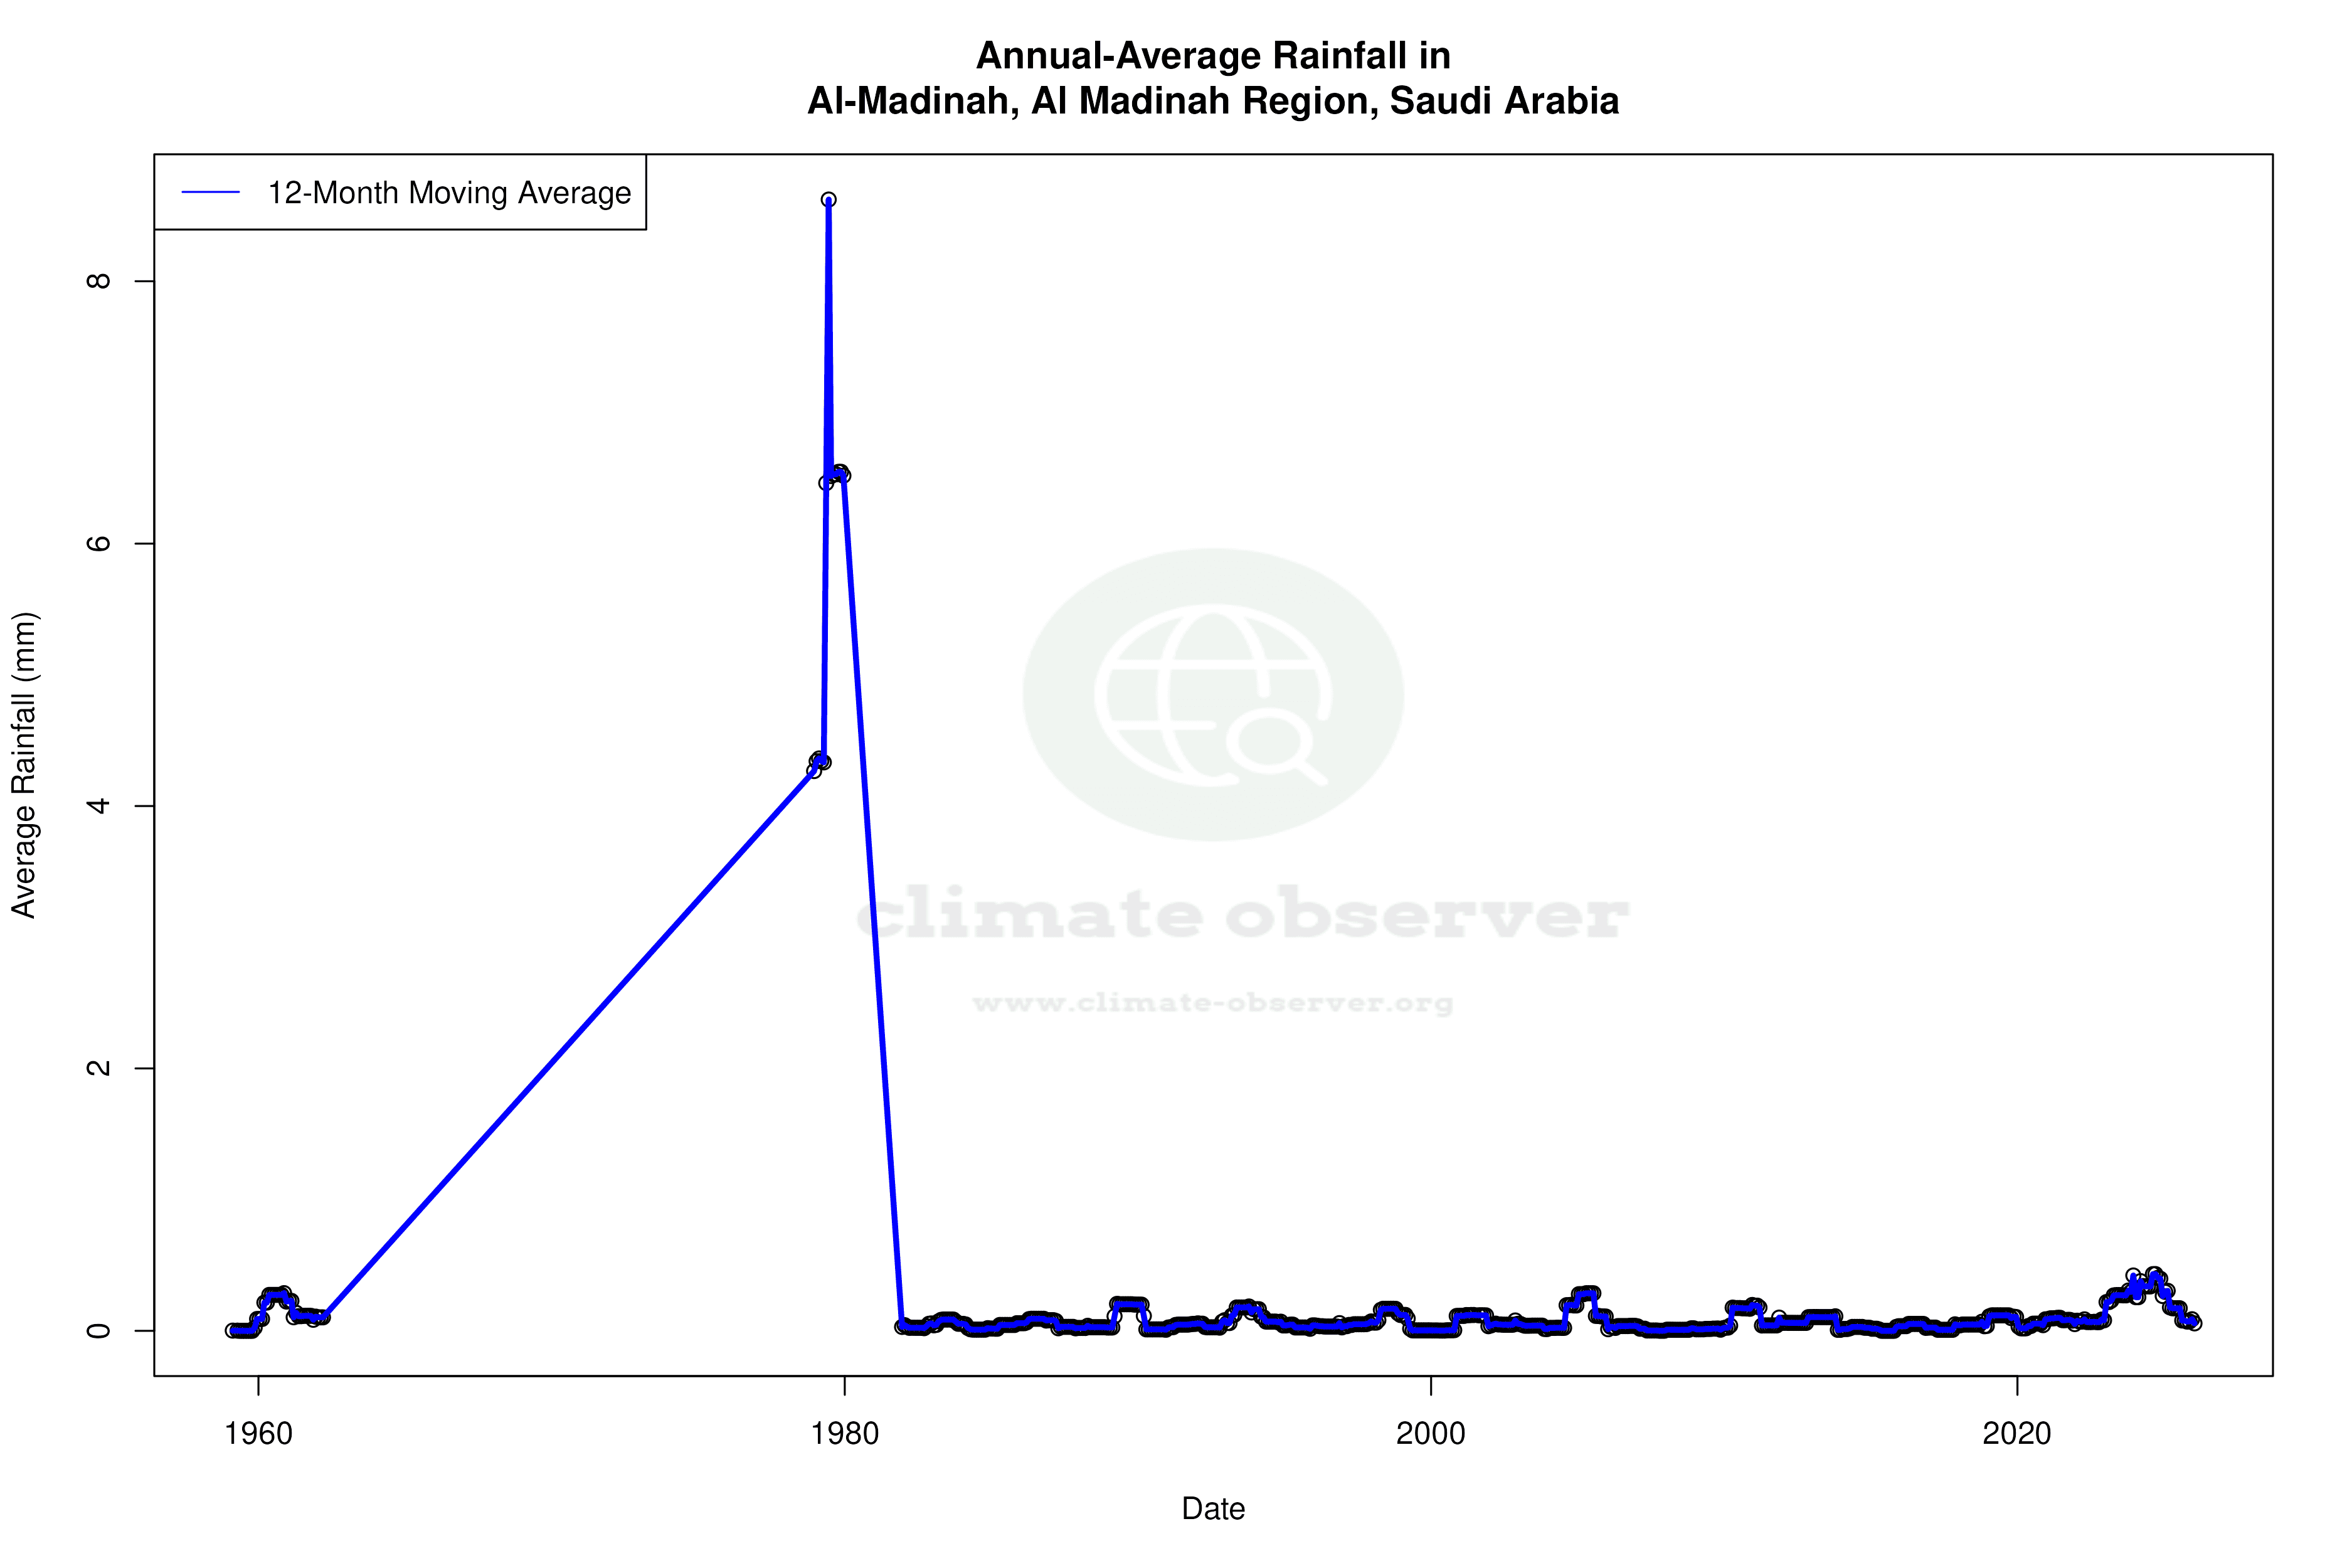
The Precipitation Concentration Index (PCI) for Al-Madinah has decreased from a baseline of 51.8 to a current value of 42.4, indicating a significant shift towards more evenly distributed rainfall events. In practical terms, a lower PCI suggests that rainfall is less concentrated in intense, sporadic events and more spread out over time. This change could have implications for local agriculture and water management, as more consistent rainfall may improve soil moisture levels and reduce the risk of flash floods.
Temperature Extremes
Al-Madinah's climate is also defined by its temperature extremes. The region has recorded an absolute maximum temperature of 49.0°C (120.2°F) and a minimum of -1.0°C (30.2°F). These extremes underscore the harsh and variable nature of the desert climate, where temperatures can fluctuate dramatically between day and night as well as between seasons.
Regional Climate Goals and Future Outlook
Saudi Arabia's commitment to addressing climate change is reflected in its Vision 2030 goals, which aim to enhance sustainability and environmental stewardship. Al-Madinah's evolving climate patterns, particularly the warming trend in high temperatures and the more evenly distributed precipitation, align with the broader regional efforts to adapt to and mitigate climate impacts. As these changes continue to unfold, they will likely influence local strategies for water resource management, agriculture, and urban planning.
Station Statistics
10-Year Trend
High: +0.03 °F/decade
Low: -1.72 °F/decade
Rain: +0.010 in/decade
25-Year Trend
High: +0.67 °F/decade
Low: +1.90 °F/decade
Rain: +0.002 in/decade
50-Year Trend
High: +0.72 °F/decade
Low: +1.17 °F/decade
Rain: -0.005 in/decade
All-Time Trend
High: +0.68 °F/decade
Low: +0.85 °F/decade
Rain: -0.003 in/decade
Percentage Above-Average Days
Last 12 Months: 50.0%
This Year: 60.4%
Precipitation Concentration Index (PCI) ℹ️
Last 12 Months: 33.2
Historical Average: 52.7
Percentile Rank of Last 12 Months ℹ️
High: 86th percentile
Low: 87th percentile
Rain: 79th percentile
Change in Variance ℹ️
High: +2.9%
Low: +5.9%
Intraday: -10.4%
Data Coverage
80.8%
First Year of Data
1958
Station Location
Historical Weather Records
| Max High | Avg High | Min High | Max Avg | Avg Avg | Min Avg | Max Low | Avg Low | Min Low | Max Precipitation | Avg Precipitation | Max Snow | Avg Snow | |
|---|---|---|---|---|---|---|---|---|---|---|---|---|---|
| Record | 120.20 °F | — | 53.96 °F | 109.04 °F | — | 42.80 °F | 100.40 °F | — | 30.20 °F | 30.63 in | — | — | — |
| January | 91.40 °F | 75.62 °F | 54.50 °F | 80.06 °F | 65.00 °F | 42.80 °F | 71.60 °F | 53.67 °F | 33.80 °F | 1.38 in | 0.01 in | — | — |
| February | 97.88 °F | 80.06 °F | 53.96 °F | 90.50 °F | 69.06 °F | 48.38 °F | 78.80 °F | 56.92 °F | 37.40 °F | 0.28 in | 0.00 in | — | — |
| March | 104.00 °F | 86.91 °F | 60.08 °F | 91.04 °F | 75.65 °F | 55.22 °F | 79.52 °F | 63.02 °F | 37.94 °F | 1.58 in | 0.01 in | — | — |
| April | 109.40 °F | 95.37 °F | 70.70 °F | 95.18 °F | 83.55 °F | 61.16 °F | 86.00 °F | 70.51 °F | 46.40 °F | 1.53 in | 0.01 in | — | — |
| May | 114.80 °F | 103.18 °F | 78.80 °F | 102.74 °F | 91.61 °F | 69.08 °F | 92.84 °F | 78.08 °F | 57.20 °F | 30.63 in | 0.06 in | — | — |
| June | 118.58 °F | 108.93 °F | 98.60 °F | 108.50 °F | 97.71 °F | 86.54 °F | 96.80 °F | 83.53 °F | 68.32 °F | 30.63 in | 0.02 in | — | — |
| July | 120.20 °F | 108.85 °F | 96.80 °F | 108.32 °F | 97.85 °F | 86.54 °F | 100.40 °F | 84.80 °F | 68.00 °F | 30.63 in | 0.02 in | — | — |
| August | 120.20 °F | 109.87 °F | 98.06 °F | 109.04 °F | 98.51 °F | 84.20 °F | 97.88 °F | 85.84 °F | 68.00 °F | 1.43 in | 0.00 in | — | — |
| September | 115.52 °F | 107.56 °F | 93.92 °F | 105.08 °F | 96.13 °F | 82.76 °F | 95.18 °F | 82.60 °F | 68.88 °F | 0.04 in | 0.00 in | — | — |
| October | 109.76 °F | 98.60 °F | 75.92 °F | 99.50 °F | 86.84 °F | 66.20 °F | 89.60 °F | 73.44 °F | 53.60 °F | 0.45 in | 0.00 in | — | — |
| November | 102.20 °F | 86.45 °F | 61.52 °F | 87.80 °F | 75.63 °F | 54.50 °F | 79.52 °F | 64.10 °F | 41.00 °F | 1.51 in | 0.01 in | — | — |
| December | 102.20 °F | 78.50 °F | 57.20 °F | 80.06 °F | 67.80 °F | 48.02 °F | 73.40 °F | 56.70 °F | 30.20 °F | 1.46 in | 0.01 in | — | — |
Data Visualisations
Remove WatermarksCurrent Year Climate Trends vs Historical


Max Temperature this Year | 1 of 6
Climate 12-Month Moving Averages


Max Temperature 12-Month MA | 1 of 6
Daily Data Points and Averages Throughout the Year


Average Max Temperature Throughout Year | 1 of 5
