Climate for Station: Riyadh Obs. O.a.p., Riyadh Region, Saudi Arabia
Loading live weather...
Climate Analysis & Overview
Riyadh's climate exhibits distinct warming trends, with a notable increase in temperature extremes over the past decade. Precipitation patterns have become significantly more concentrated, suggesting a shift towards more intense weather events. These changes align with broader regional climate goals to understand and mitigate climate impacts.
Desert Climate Dynamics
Riyadh, located in the heart of Saudi Arabia, falls under the BWh classification of the Köppen climate system, indicative of a hot desert climate. This classification is characterised by extremely high temperatures and minimal precipitation. The city's geography, situated on a plateau, influences its climate by providing little respite from the intense heat. Over the past decade, Riyadh has experienced a marked warming trend, with average daily highs increasing by 1.30°C (2.34°F). This is significantly higher than the all-time trend of 0.22°C (0.39°F), indicating a recent acceleration in temperature rise. Similarly, the lows have increased by 0.45°C (0.81°F) over the last ten years, compared to an all-time warming of 0.17°C (0.30°F), suggesting milder nights.
Temperature Extremes and Records
Riyadh's temperature records underscore the harshness of its climate. The highest recorded temperature stands at a scorching 49.0°C (120.2°F), while the lowest dips to a chilly -2.2°C (28.0°F). These extremes highlight the city's wide thermal range, a common feature in desert climates. The recent warming trends suggest that such extremes may become more frequent, posing challenges for both human and ecological systems.
Precipitation Patterns and Concentration
The Precipitation Concentration Index (PCI) for Riyadh has increased from a baseline of 45.3 to a current value of 49.0. This significant rise indicates that rainfall is becoming more concentrated in fewer events, leading to intense downpours rather than evenly distributed precipitation. Such concentrated rainfall can exacerbate flooding risks and strain urban infrastructure. Understanding these shifts is crucial for Riyadh's climate resilience strategies, especially as the city aims to align with Saudi Arabia's broader climate adaptation goals.
Regional Climate Goals and Implications
Saudi Arabia's climate initiatives focus on reducing the impacts of climate change and enhancing sustainability. The observed trends in Riyadh's climate data provide valuable insights into these efforts. The recent warming and changing precipitation patterns highlight the need for adaptive measures to cope with more extreme weather conditions. These trends also underline the importance of integrating climate data into urban planning and policy-making to ensure the city's long-term resilience and sustainability.
Station Statistics
10-Year Trend
High: +3.10 °F/decade
Low: +1.85 °F/decade
Rain: +0.005 in/decade
25-Year Trend
High: +0.42 °F/decade
Low: -0.17 °F/decade
Rain: +0.001 in/decade
50-Year Trend
High: +0.73 °F/decade
Low: +0.61 °F/decade
Rain: -0.026 in/decade
All-Time Trend
High: +0.73 °F/decade
Low: +0.61 °F/decade
Rain: -0.026 in/decade
Percentage Above-Average Days
Last 12 Months: 52.8%
This Year: 65.8%
Precipitation Concentration Index (PCI) ℹ️
Last 12 Months: 32.8
Historical Average: 41.7
Percentile Rank of Last 12 Months ℹ️
High: 77th percentile
Low: 50th percentile
Rain: 53rd percentile
Change in Variance ℹ️
High: -4.0%
Low: -6.5%
Intraday: +10.2%
Data Coverage
75.6%
First Year of Data
1958
Station Location
Historical Weather Records
| Max High | Avg High | Min High | Max Avg | Avg Avg | Min Avg | Max Low | Avg Low | Min Low | Max Precipitation | Avg Precipitation | Max Snow | Avg Snow | |
|---|---|---|---|---|---|---|---|---|---|---|---|---|---|
| Record | 120.20 °F | — | 45.14 °F | 109.76 °F | — | 37.76 °F | 98.60 °F | — | 28.04 °F | 30.63 in | — | — | — |
| January | 91.40 °F | 69.35 °F | 45.14 °F | 76.46 °F | 58.55 °F | 37.76 °F | 65.48 °F | 47.92 °F | 28.04 °F | 30.63 in | 0.08 in | — | — |
| February | 94.64 °F | 74.61 °F | 49.10 °F | 84.74 °F | 63.16 °F | 41.00 °F | 68.00 °F | 51.71 °F | 29.66 °F | 30.63 in | 0.06 in | — | — |
| March | 101.84 °F | 82.32 °F | 55.22 °F | 91.94 °F | 70.91 °F | 46.94 °F | 77.00 °F | 59.15 °F | 39.56 °F | 2.49 in | 0.02 in | — | — |
| April | 107.60 °F | 92.20 °F | 63.50 °F | 94.82 °F | 80.51 °F | 59.18 °F | 84.20 °F | 68.26 °F | 48.02 °F | 2.36 in | 0.02 in | — | — |
| May | 120.20 °F | 102.80 °F | 78.44 °F | 105.26 °F | 90.75 °F | 70.70 °F | 90.50 °F | 77.61 °F | 60.80 °F | 30.63 in | 0.11 in | — | — |
| June | 116.96 °F | 108.50 °F | 98.60 °F | 109.58 °F | 96.03 °F | 80.60 °F | 95.00 °F | 81.47 °F | 68.00 °F | 30.63 in | 0.02 in | — | — |
| July | 118.40 °F | 110.49 °F | 98.60 °F | 109.76 °F | 98.03 °F | 83.30 °F | 98.60 °F | 83.89 °F | 69.80 °F | 30.63 in | 0.02 in | — | — |
| August | 118.40 °F | 110.04 °F | 100.76 °F | 109.22 °F | 97.62 °F | 87.08 °F | 96.80 °F | 83.34 °F | 69.80 °F | 0.09 in | 0.00 in | — | — |
| September | 113.36 °F | 105.13 °F | 93.56 °F | 107.96 °F | 92.30 °F | 78.62 °F | 91.40 °F | 77.85 °F | 60.98 °F | 0.05 in | 0.00 in | — | — |
| October | 109.94 °F | 95.53 °F | 74.84 °F | 94.82 °F | 82.56 °F | 64.76 °F | 82.40 °F | 69.12 °F | 53.60 °F | 30.63 in | 0.02 in | — | — |
| November | 96.80 °F | 81.86 °F | 55.40 °F | 90.14 °F | 70.36 °F | 46.58 °F | 75.20 °F | 59.14 °F | 41.00 °F | 30.63 in | 0.05 in | — | — |
| December | 88.70 °F | 72.21 °F | 46.40 °F | 75.20 °F | 61.15 °F | 41.90 °F | 68.00 °F | 50.75 °F | 33.80 °F | 30.63 in | 0.03 in | — | — |
Data Visualisations
Remove WatermarksCurrent Year Climate Trends vs Historical


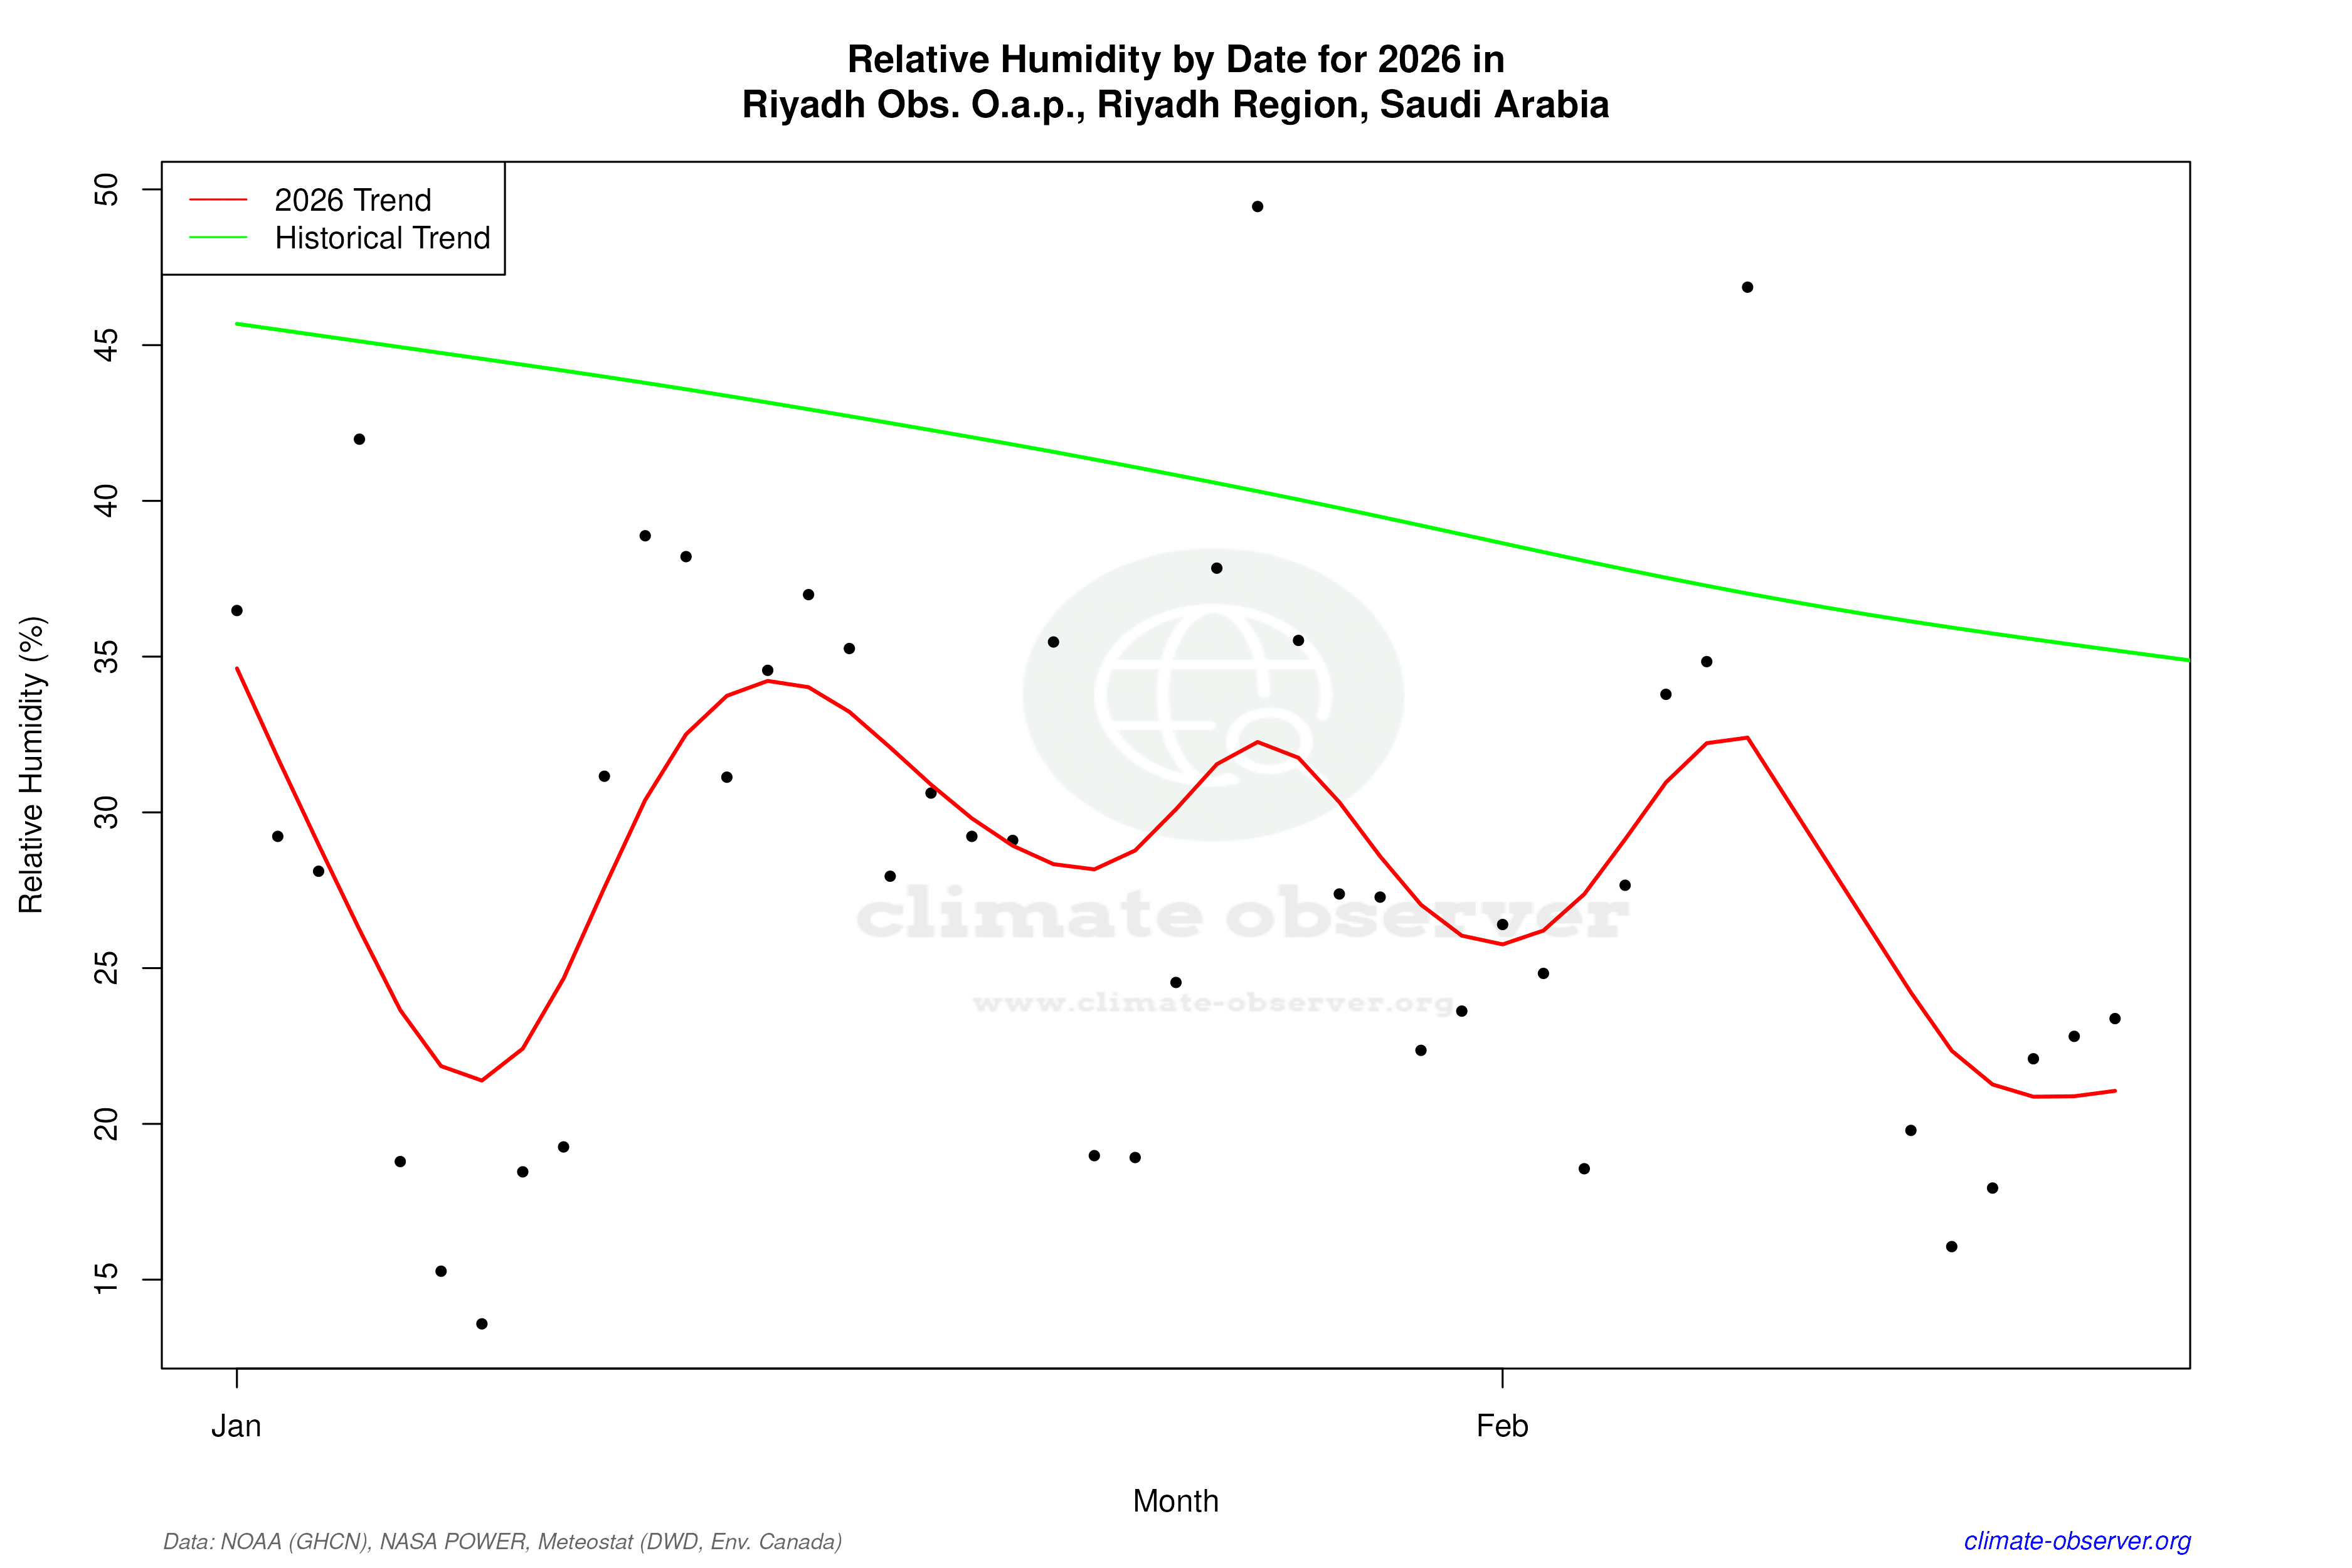

Max Temperature this Year | 1 of 6
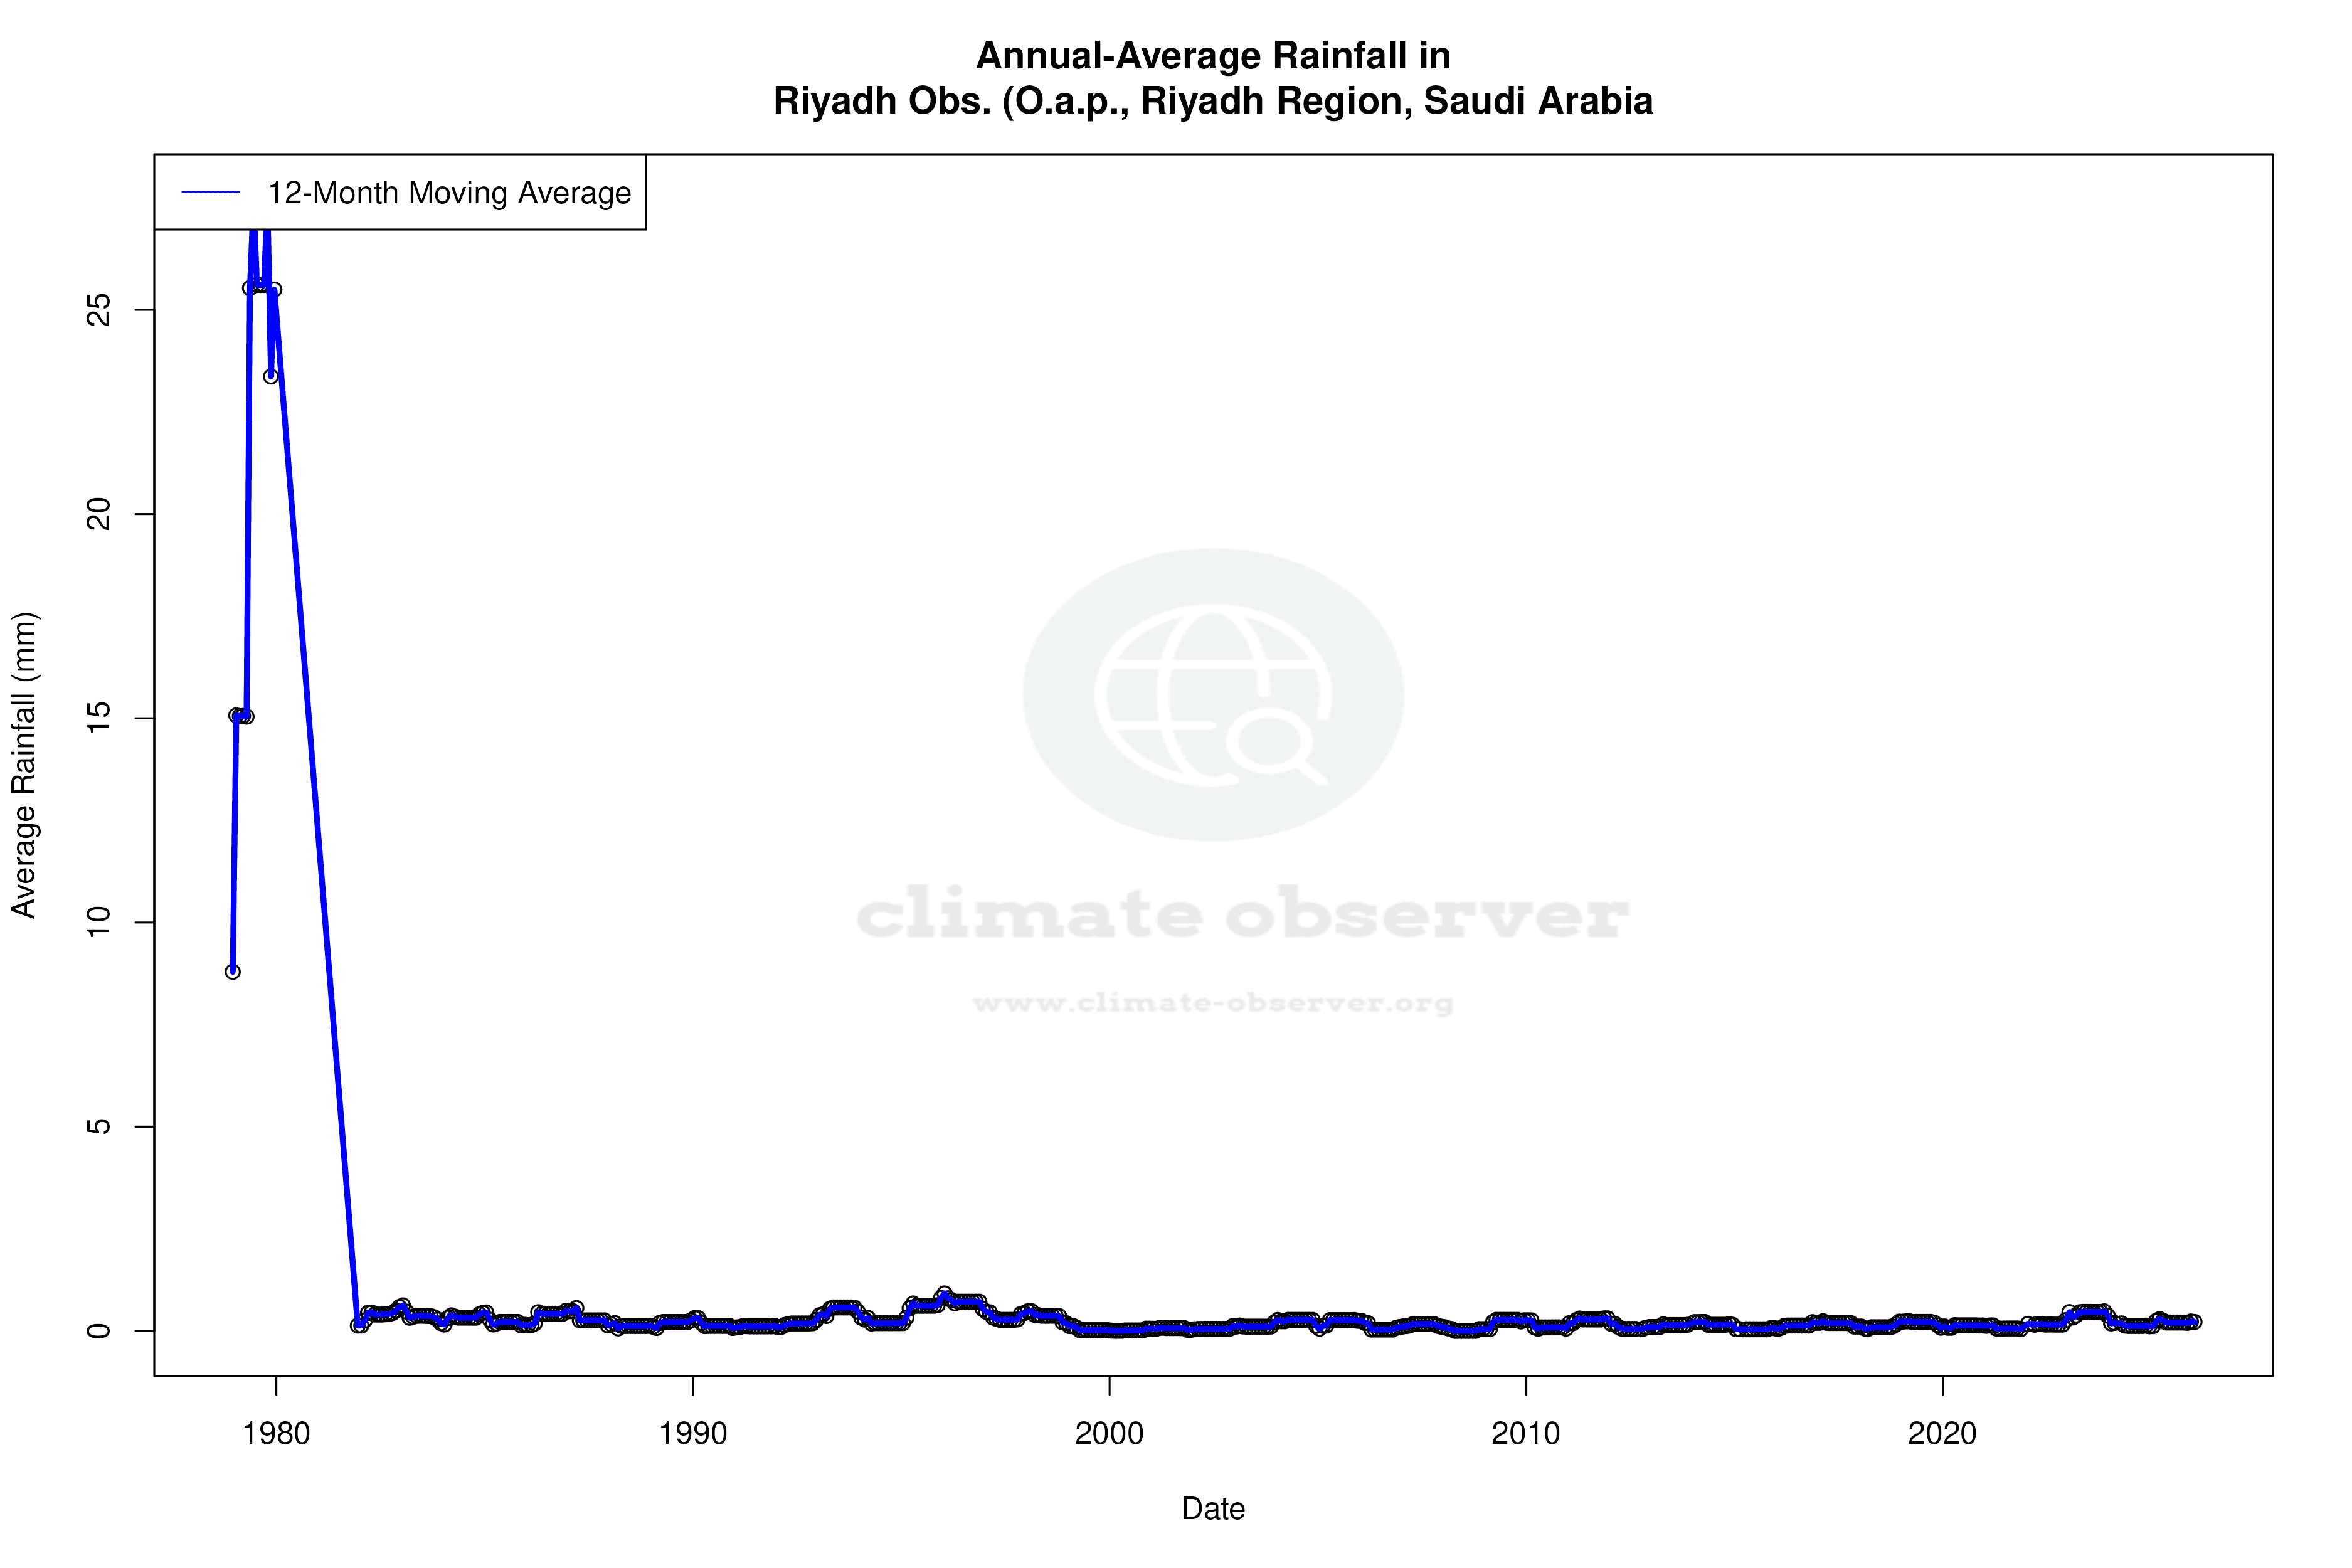
Climate 12-Month Moving Averages


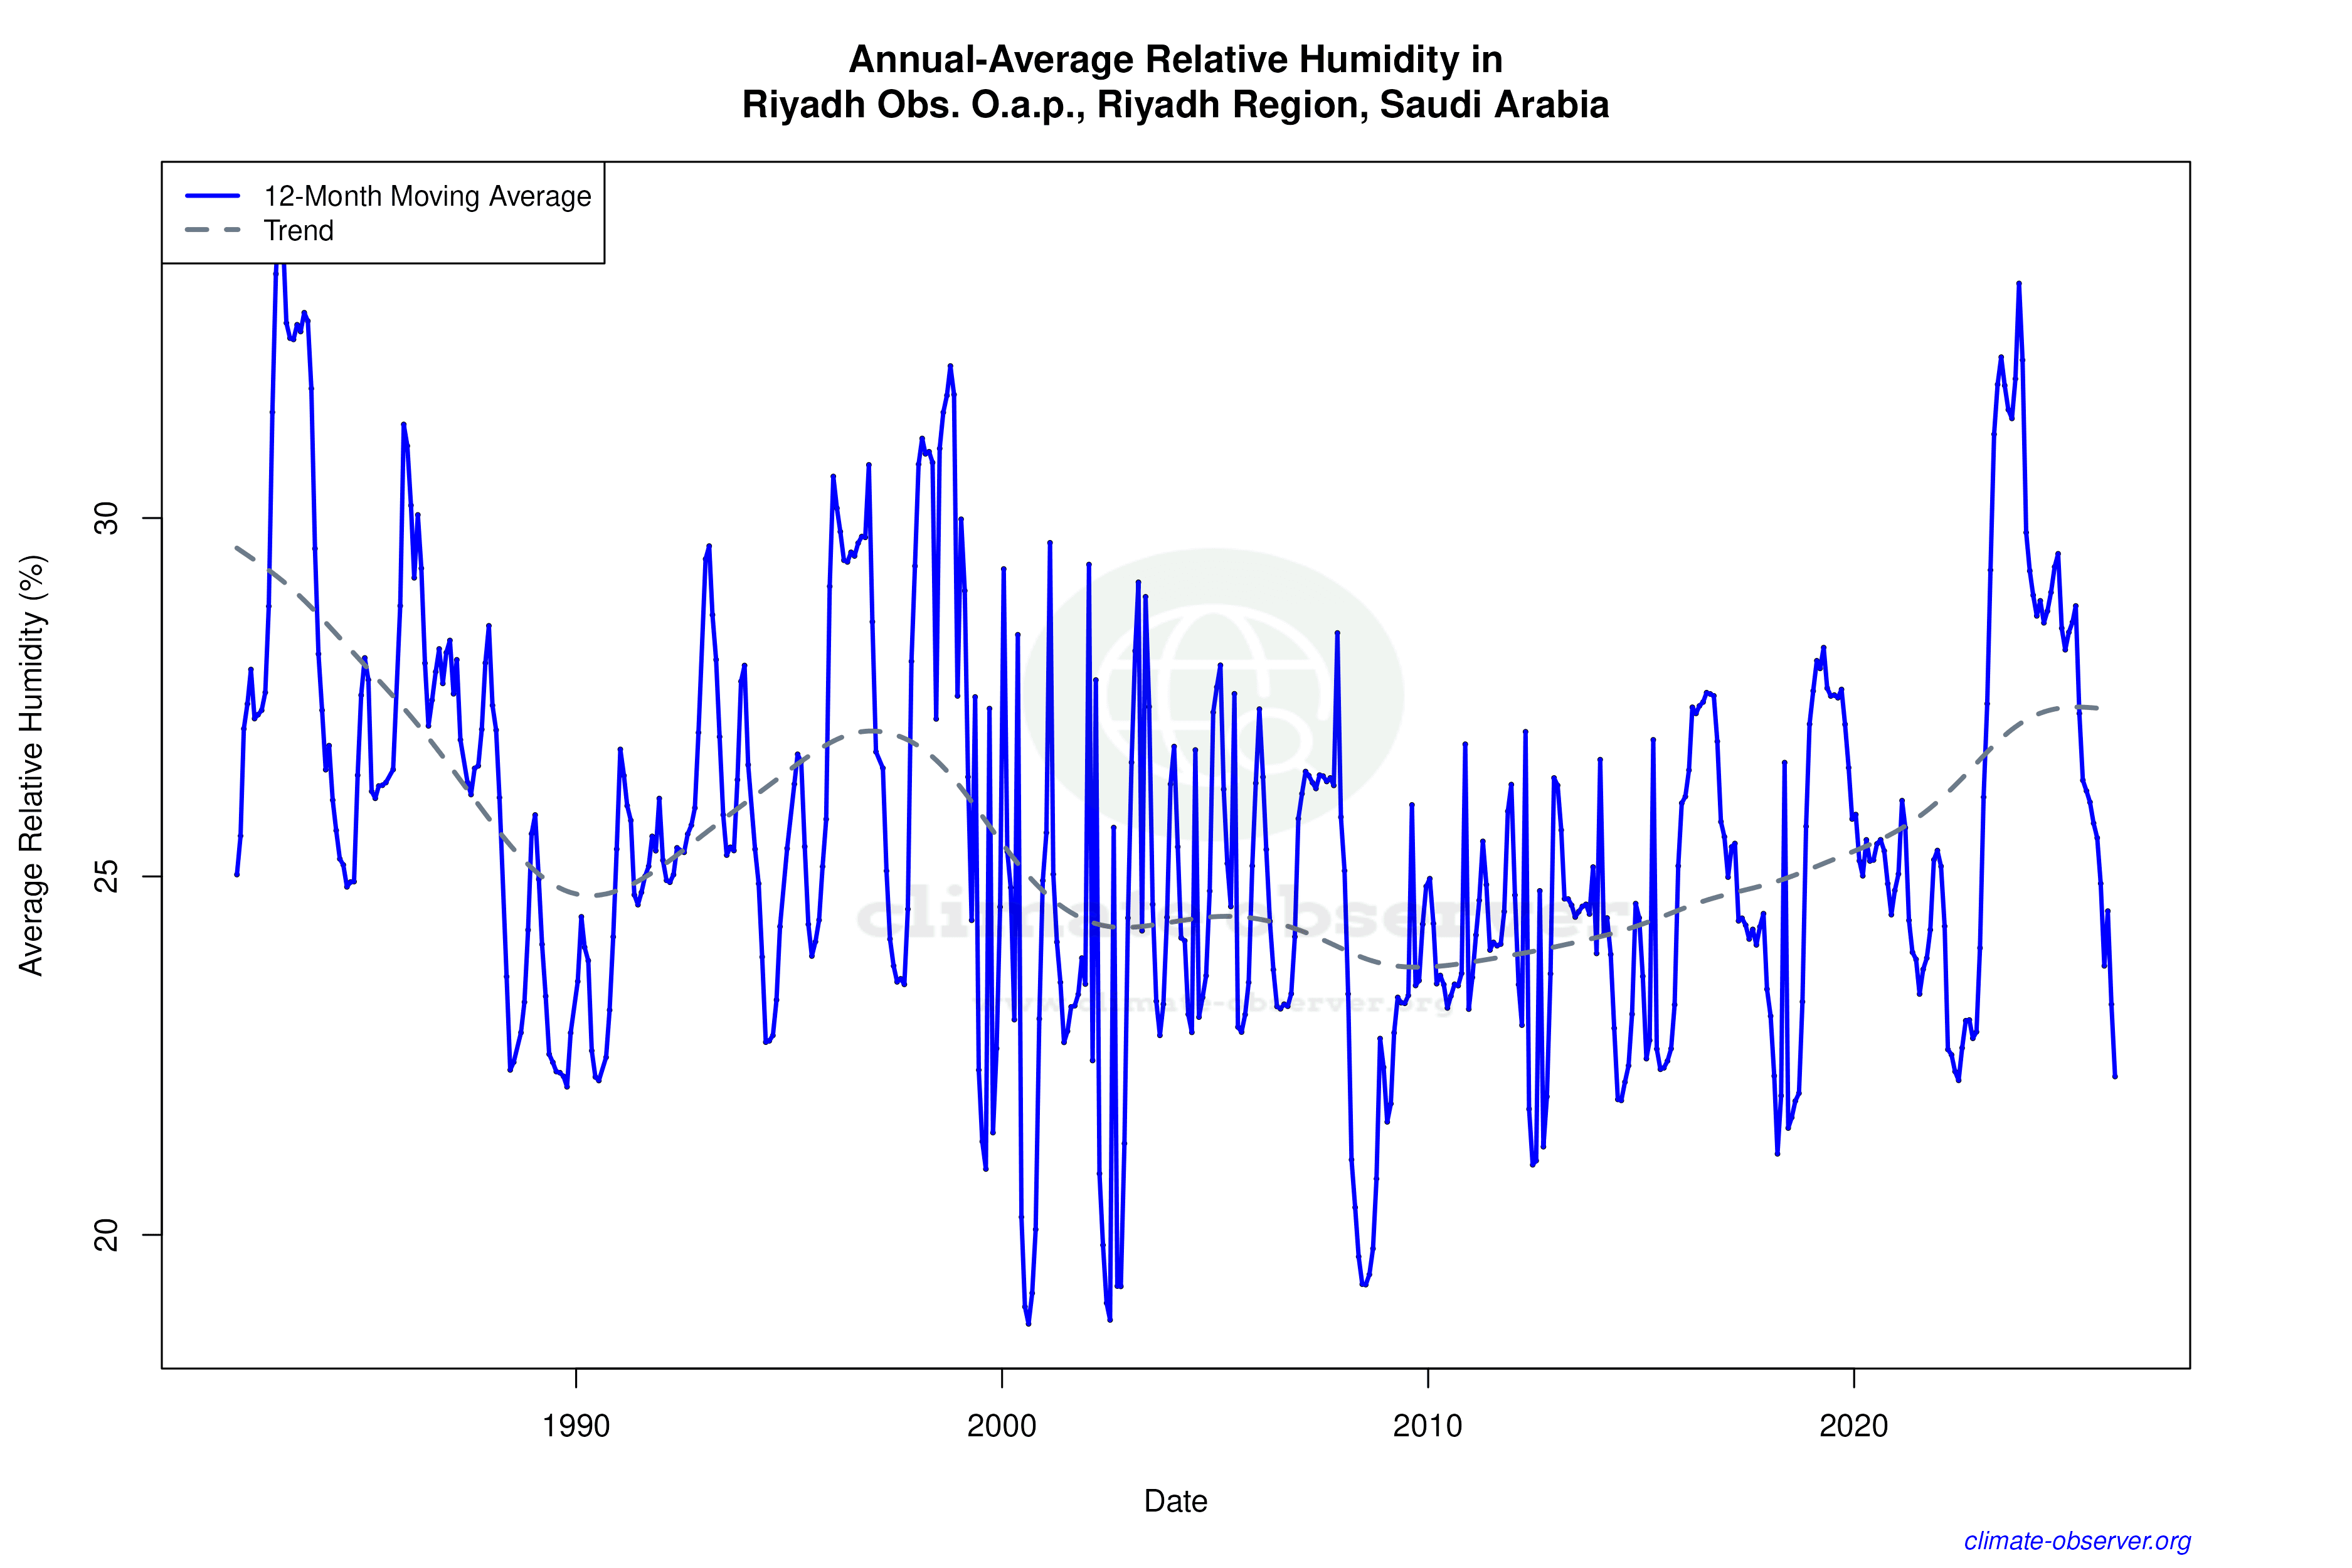

Max Temperature 12-Month MA | 1 of 6
Daily Data Points and Averages Throughout the Year


Average Max Temperature Throughout Year | 1 of 5
