Climate for Station: Hail, Hail Region, Saudi Arabia
Loading live weather...
Climate Analysis & Overview
Hail, located in Saudi Arabia, is experiencing a complex climate narrative. While the all-time temperature trends indicate a warming of 0.49°C (0.88°F) for highs, recent 10-year data reveals a cooling trend of -0.81°C (-1.46°F). Meanwhile, lows are rising, with a significant 1.42°C (2.56°F) increase over the past decade. Precipitation is becoming more evenly distributed, as evidenced by a decrease in the Precipitation Concentration Index (PCI) from 42.47 to 27.63.
Desert Climate Dynamics
Hail is situated in a region characterised by a desert climate, specifically classified as BWh under the Köppen climate classification. This classification indicates a hot desert climate with extremely arid conditions. The geography of Hail, nestled between mountain ranges and expansive desert plains, plays a critical role in shaping its climate. The surrounding topography can influence temperature variations and precipitation patterns, contributing to the area's unique climate profile.
Temperature Trends: A Tale of Two Directions
The all-time temperature trends in Hail reveal a warming pattern, with highs increasing by 0.49°C (0.88°F). However, the past decade tells a different story, with a notable cooling of -0.81°C (-1.46°F) in high temperatures. This dichotomy suggests a complex interplay of local and possibly global climatic factors. Meanwhile, the lows have shown a consistent warming trend, with an all-time rise of 0.69°C (1.24°F) and a more pronounced increase of 1.42°C (2.56°F) over the past ten years. These contrasting trends highlight the dynamic nature of Hail's climate.
Precipitation Patterns: A Shift Towards Even Distribution
The Precipitation Concentration Index (PCI) is a measure of how precipitation is distributed over time. A decrease in PCI from 42.47 to 27.63 indicates that precipitation in Hail is becoming more evenly distributed throughout the year. This shift suggests a reduction in the concentration of rainfall events, which could have implications for local water resources and agriculture. A more even distribution of precipitation can mitigate the risks associated with intense, sporadic rainfall events, such as flash floods.
Extreme Temperature Records
Hail has experienced extreme temperatures, with a recorded maximum of 46.0°C (114.8°F) and a minimum of -10.0°C (14.0°F). These extremes underscore the variability and harshness of the desert climate. Such temperature records are critical for understanding the potential impacts of climate change on the region, as they provide a benchmark for future climatic shifts.
Climate Goals and Regional Context
Saudi Arabia's regional climate goals aim to address and adapt to the challenges posed by climate change. Recent weather events, such as heatwaves and shifting precipitation patterns, underscore the importance of these initiatives. Hail's climate data provides valuable insights into the broader regional trends, informing strategies for sustainable development and climate resilience.
Station Statistics
10-Year Trend
High: -1.44 °F/decade
Low: +2.26 °F/decade
Rain: +0.018 in/decade
25-Year Trend
High: +0.19 °F/decade
Low: +1.84 °F/decade
Rain: +0.004 in/decade
50-Year Trend
High: +0.94 °F/decade
Low: +1.30 °F/decade
Rain: +0.001 in/decade
All-Time Trend
High: +0.94 °F/decade
Low: +1.30 °F/decade
Rain: +0.001 in/decade
Percentage Above-Average Days
Last 12 Months: 53.0%
This Year: 62.4%
Precipitation Concentration Index (PCI) ℹ️
Last 12 Months: 26.5
Historical Average: 40.6
Percentile Rank of Last 12 Months ℹ️
High: 40th percentile
Low: 81st percentile
Rain: 95th percentile
Change in Variance ℹ️
High: +1.1%
Low: +5.7%
Intraday: -10.2%
Data Coverage
91.3%
First Year of Data
1973
Station Location
Historical Weather Records
| Max High | Avg High | Min High | Max Avg | Avg Avg | Min Avg | Max Low | Avg Low | Min Low | Max Precipitation | Avg Precipitation | Max Snow | Avg Snow | |
|---|---|---|---|---|---|---|---|---|---|---|---|---|---|
| Record | 114.80 °F | — | 39.20 °F | 103.46 °F | — | 30.74 °F | 92.12 °F | — | 14.00 °F | 5.04 in | — | — | — |
| January | 84.20 °F | 63.71 °F | 39.20 °F | 71.24 °F | 51.61 °F | 30.74 °F | 64.40 °F | 39.26 °F | 14.00 °F | 3.29 in | 0.01 in | — | — |
| February | 88.52 °F | 68.07 °F | 42.80 °F | 84.20 °F | 55.87 °F | 33.44 °F | 60.80 °F | 42.49 °F | 19.04 °F | 2.30 in | 0.01 in | — | — |
| March | 96.80 °F | 75.11 °F | 50.00 °F | 85.82 °F | 63.08 °F | 41.54 °F | 70.88 °F | 49.47 °F | 24.80 °F | 2.25 in | 0.01 in | — | — |
| April | 101.30 °F | 85.05 °F | 61.52 °F | 92.30 °F | 72.81 °F | 51.62 °F | 75.74 °F | 58.85 °F | 37.76 °F | 1.24 in | 0.01 in | — | — |
| May | 108.72 °F | 94.30 °F | 72.50 °F | 98.96 °F | 82.52 °F | 63.14 °F | 82.40 °F | 67.72 °F | 50.00 °F | 0.39 in | 0.00 in | — | — |
| June | 111.56 °F | 101.08 °F | 89.60 °F | 103.10 °F | 89.26 °F | 76.46 °F | 88.16 °F | 72.72 °F | 59.00 °F | 0.21 in | 0.00 in | — | — |
| July | 111.92 °F | 102.99 °F | 90.68 °F | 103.46 °F | 91.60 °F | 78.98 °F | 90.32 °F | 74.77 °F | 59.00 °F | 0.00 in | 0.00 in | — | — |
| August | 114.80 °F | 103.71 °F | 91.40 °F | 102.74 °F | 91.89 °F | 77.00 °F | 92.12 °F | 75.14 °F | 59.00 °F | 0.15 in | 0.00 in | — | — |
| September | 111.20 °F | 100.32 °F | 84.56 °F | 99.14 °F | 87.33 °F | 73.22 °F | 87.80 °F | 70.48 °F | 55.40 °F | 0.08 in | 0.00 in | — | — |
| October | 103.10 °F | 90.38 °F | 60.44 °F | 91.40 °F | 76.89 °F | 55.04 °F | 82.40 °F | 61.50 °F | 43.88 °F | 5.04 in | 0.01 in | — | — |
| November | 96.80 °F | 75.47 °F | 48.92 °F | 83.84 °F | 63.35 °F | 43.70 °F | 66.20 °F | 50.75 °F | 29.66 °F | 0.81 in | 0.01 in | — | — |
| December | 84.20 °F | 66.86 °F | 42.80 °F | 73.58 °F | 54.46 °F | 36.68 °F | 60.44 °F | 42.27 °F | 21.92 °F | 0.93 in | 0.01 in | — | — |
Data Visualisations
Remove WatermarksCurrent Year Climate Trends vs Historical


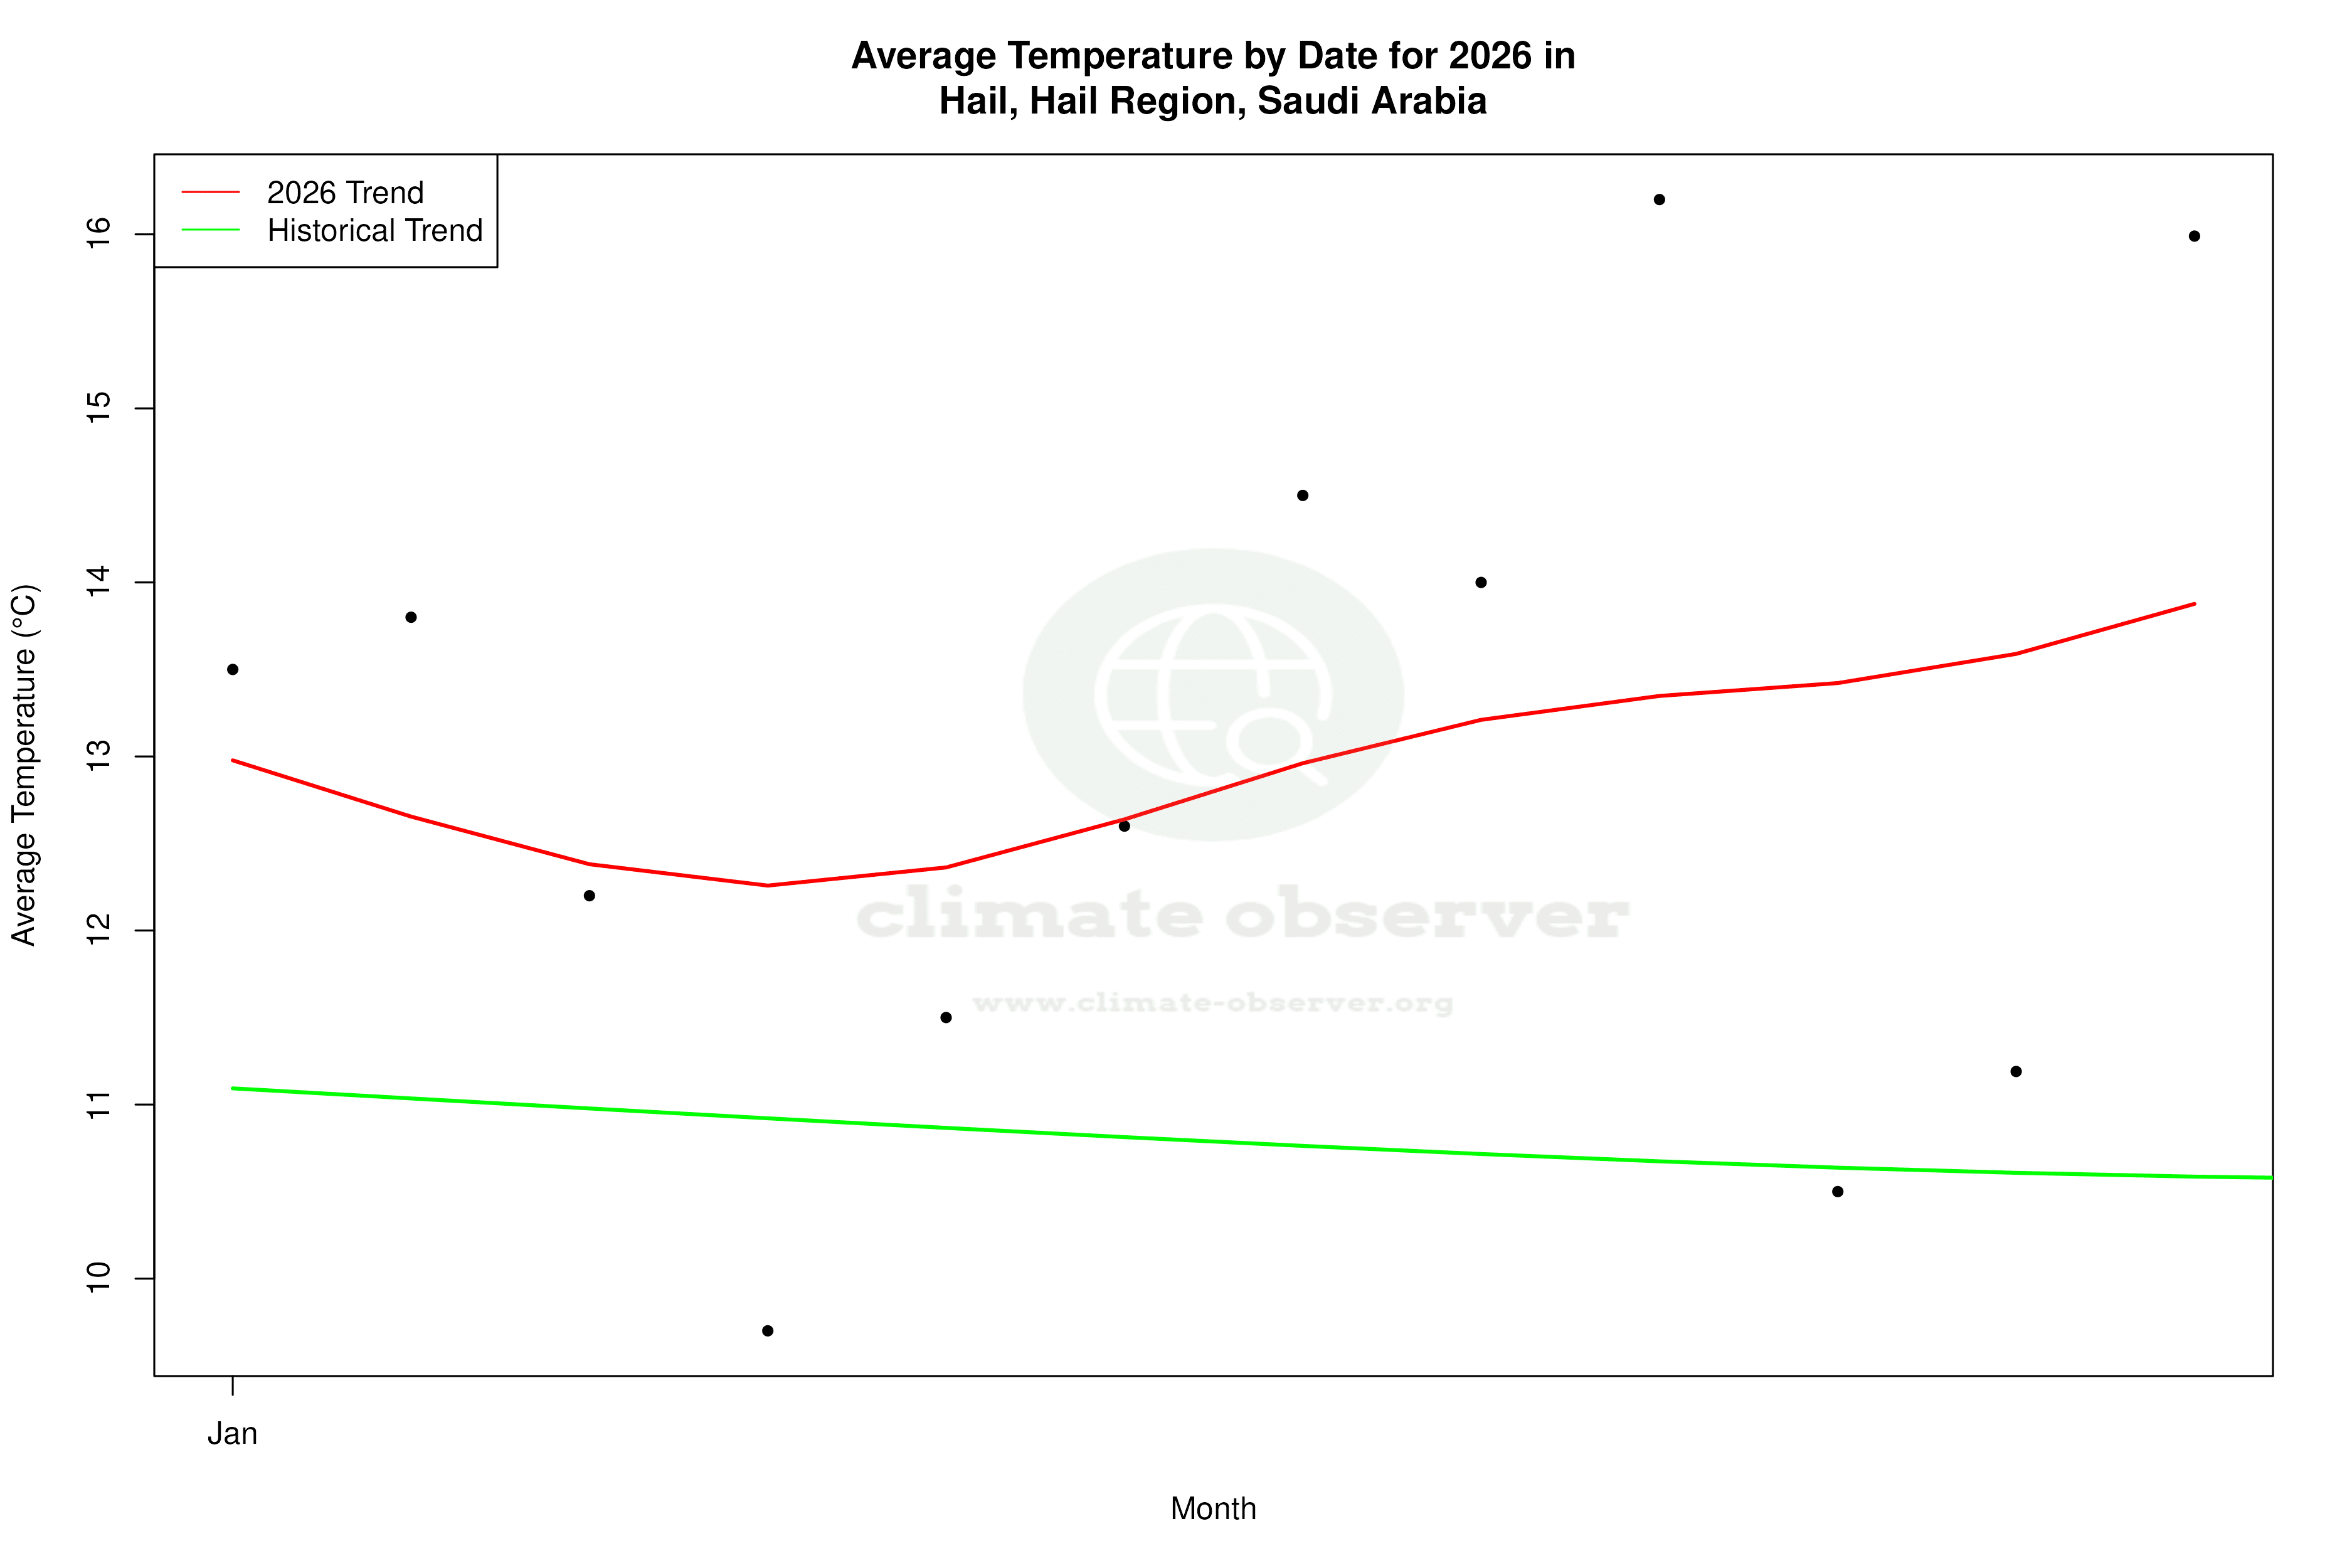


Max Temperature this Year | 1 of 6
Climate 12-Month Moving Averages


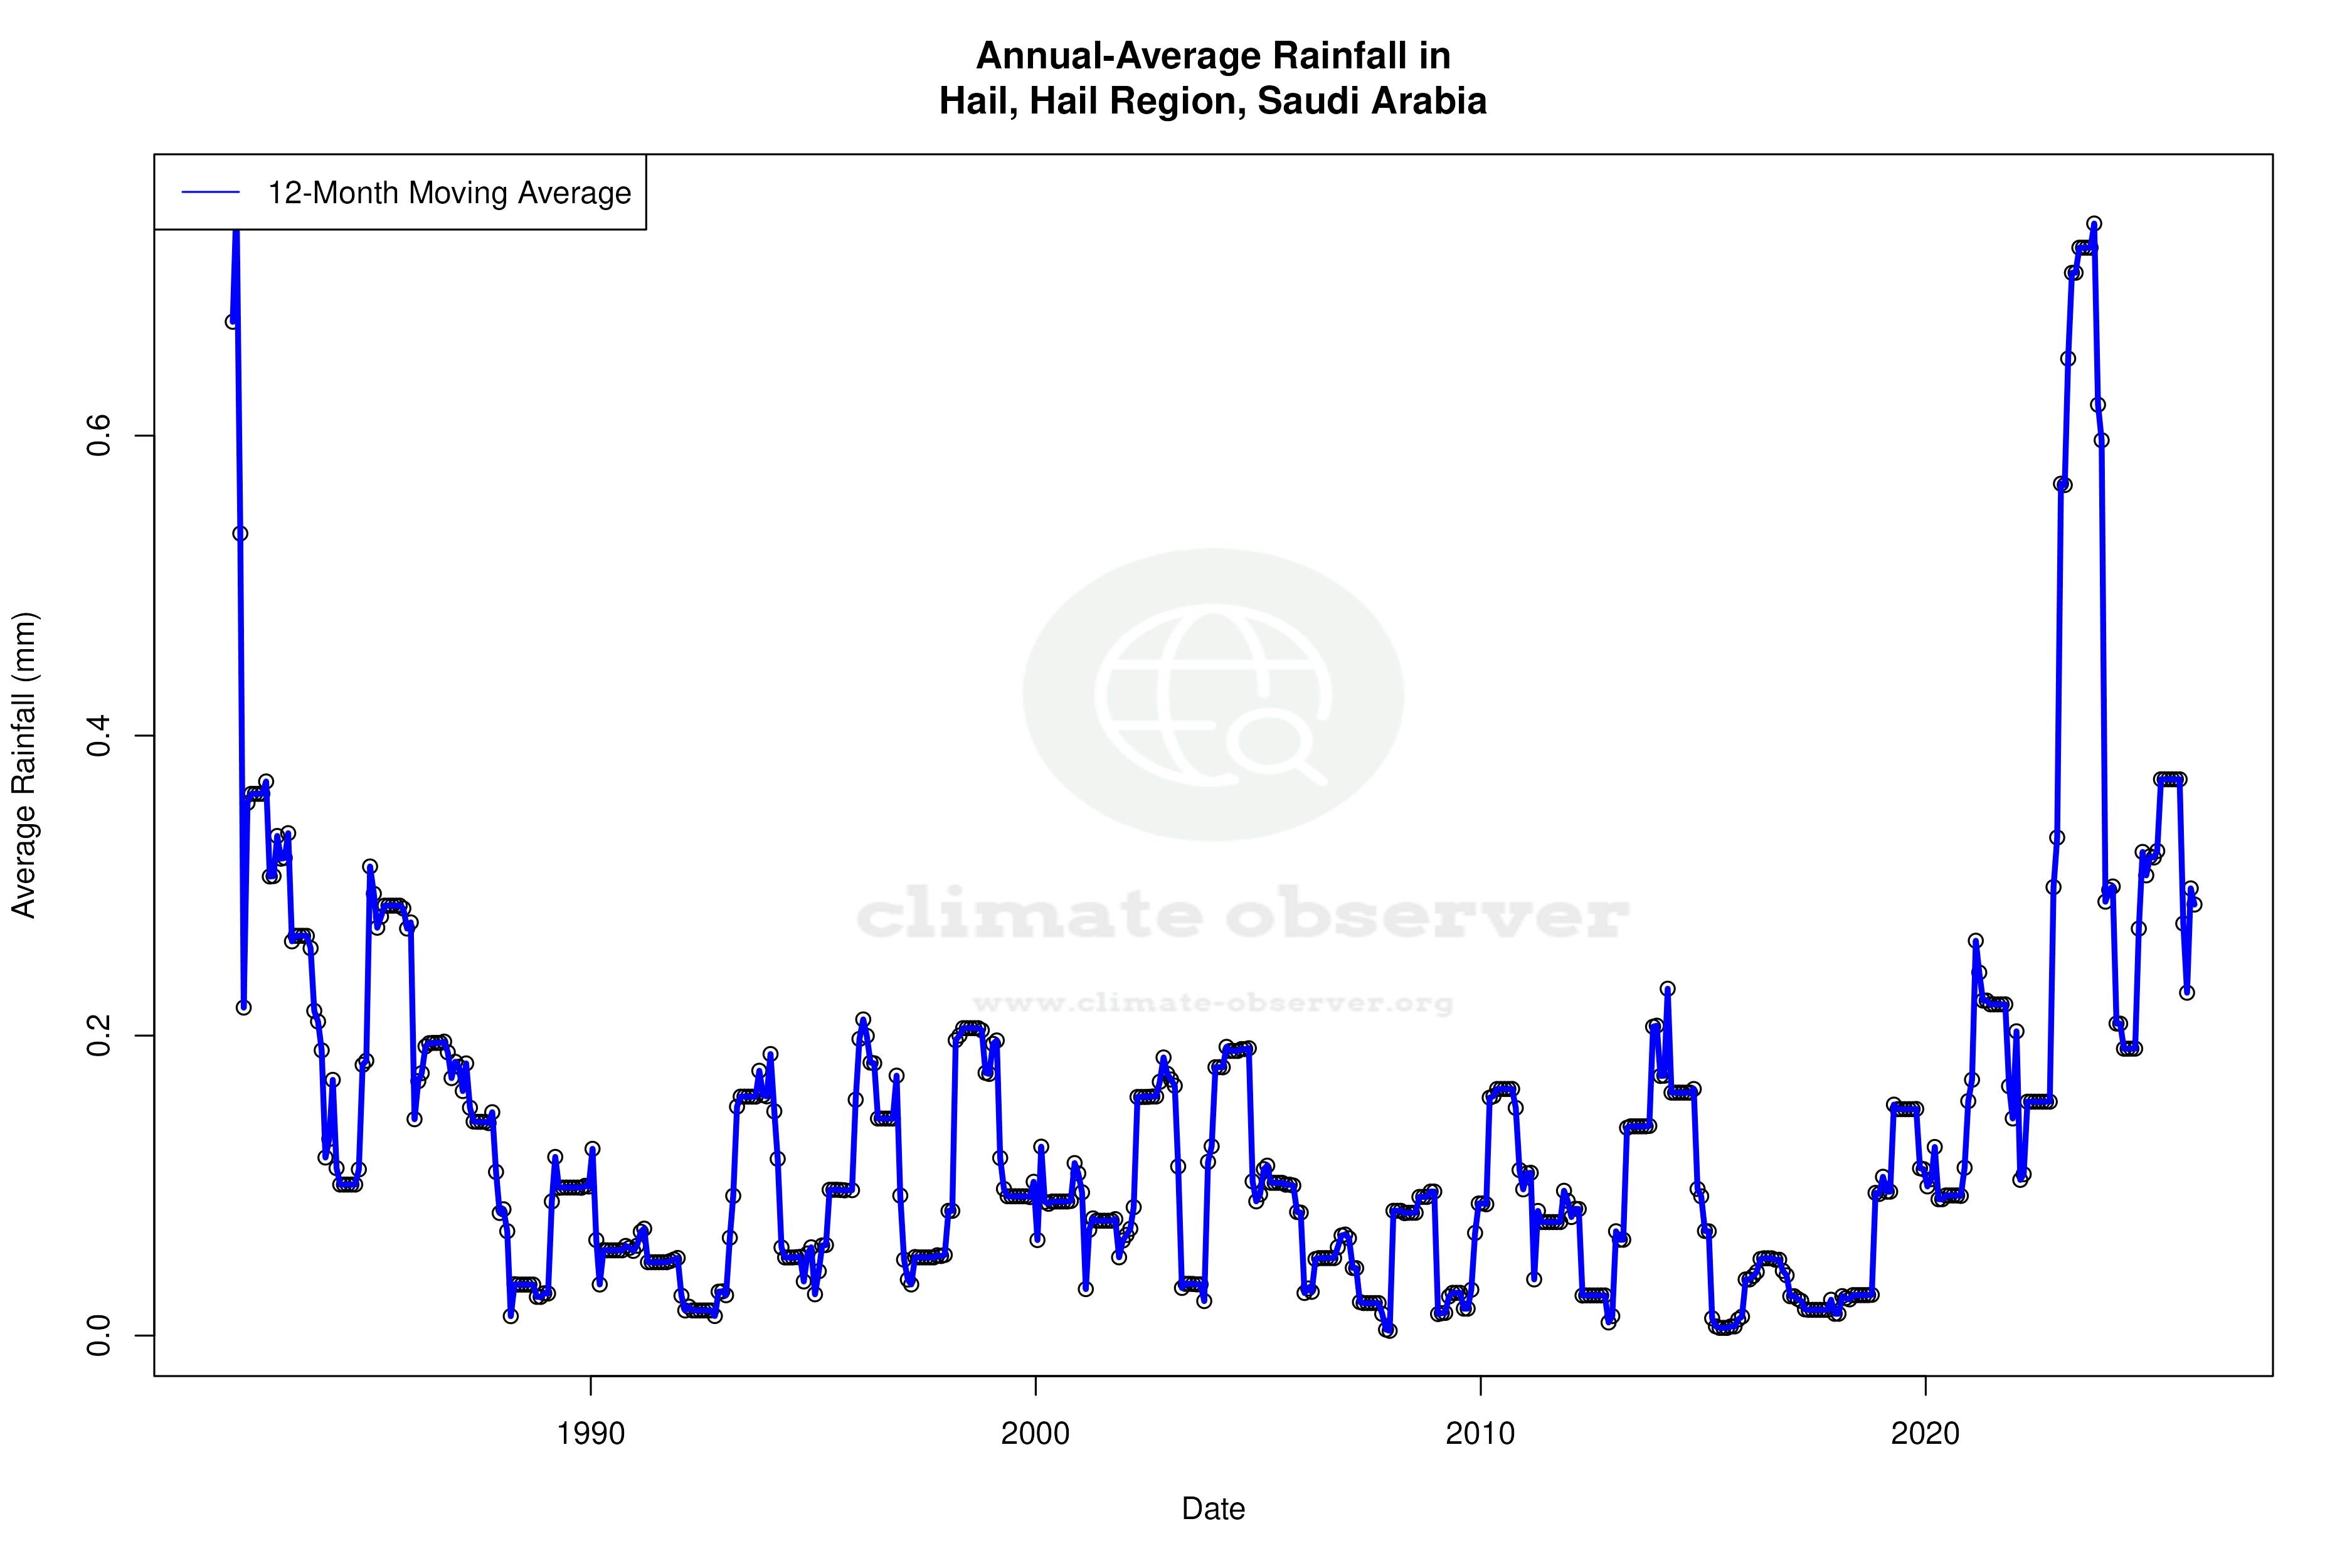


Max Temperature 12-Month MA | 1 of 6
Daily Data Points and Averages Throughout the Year
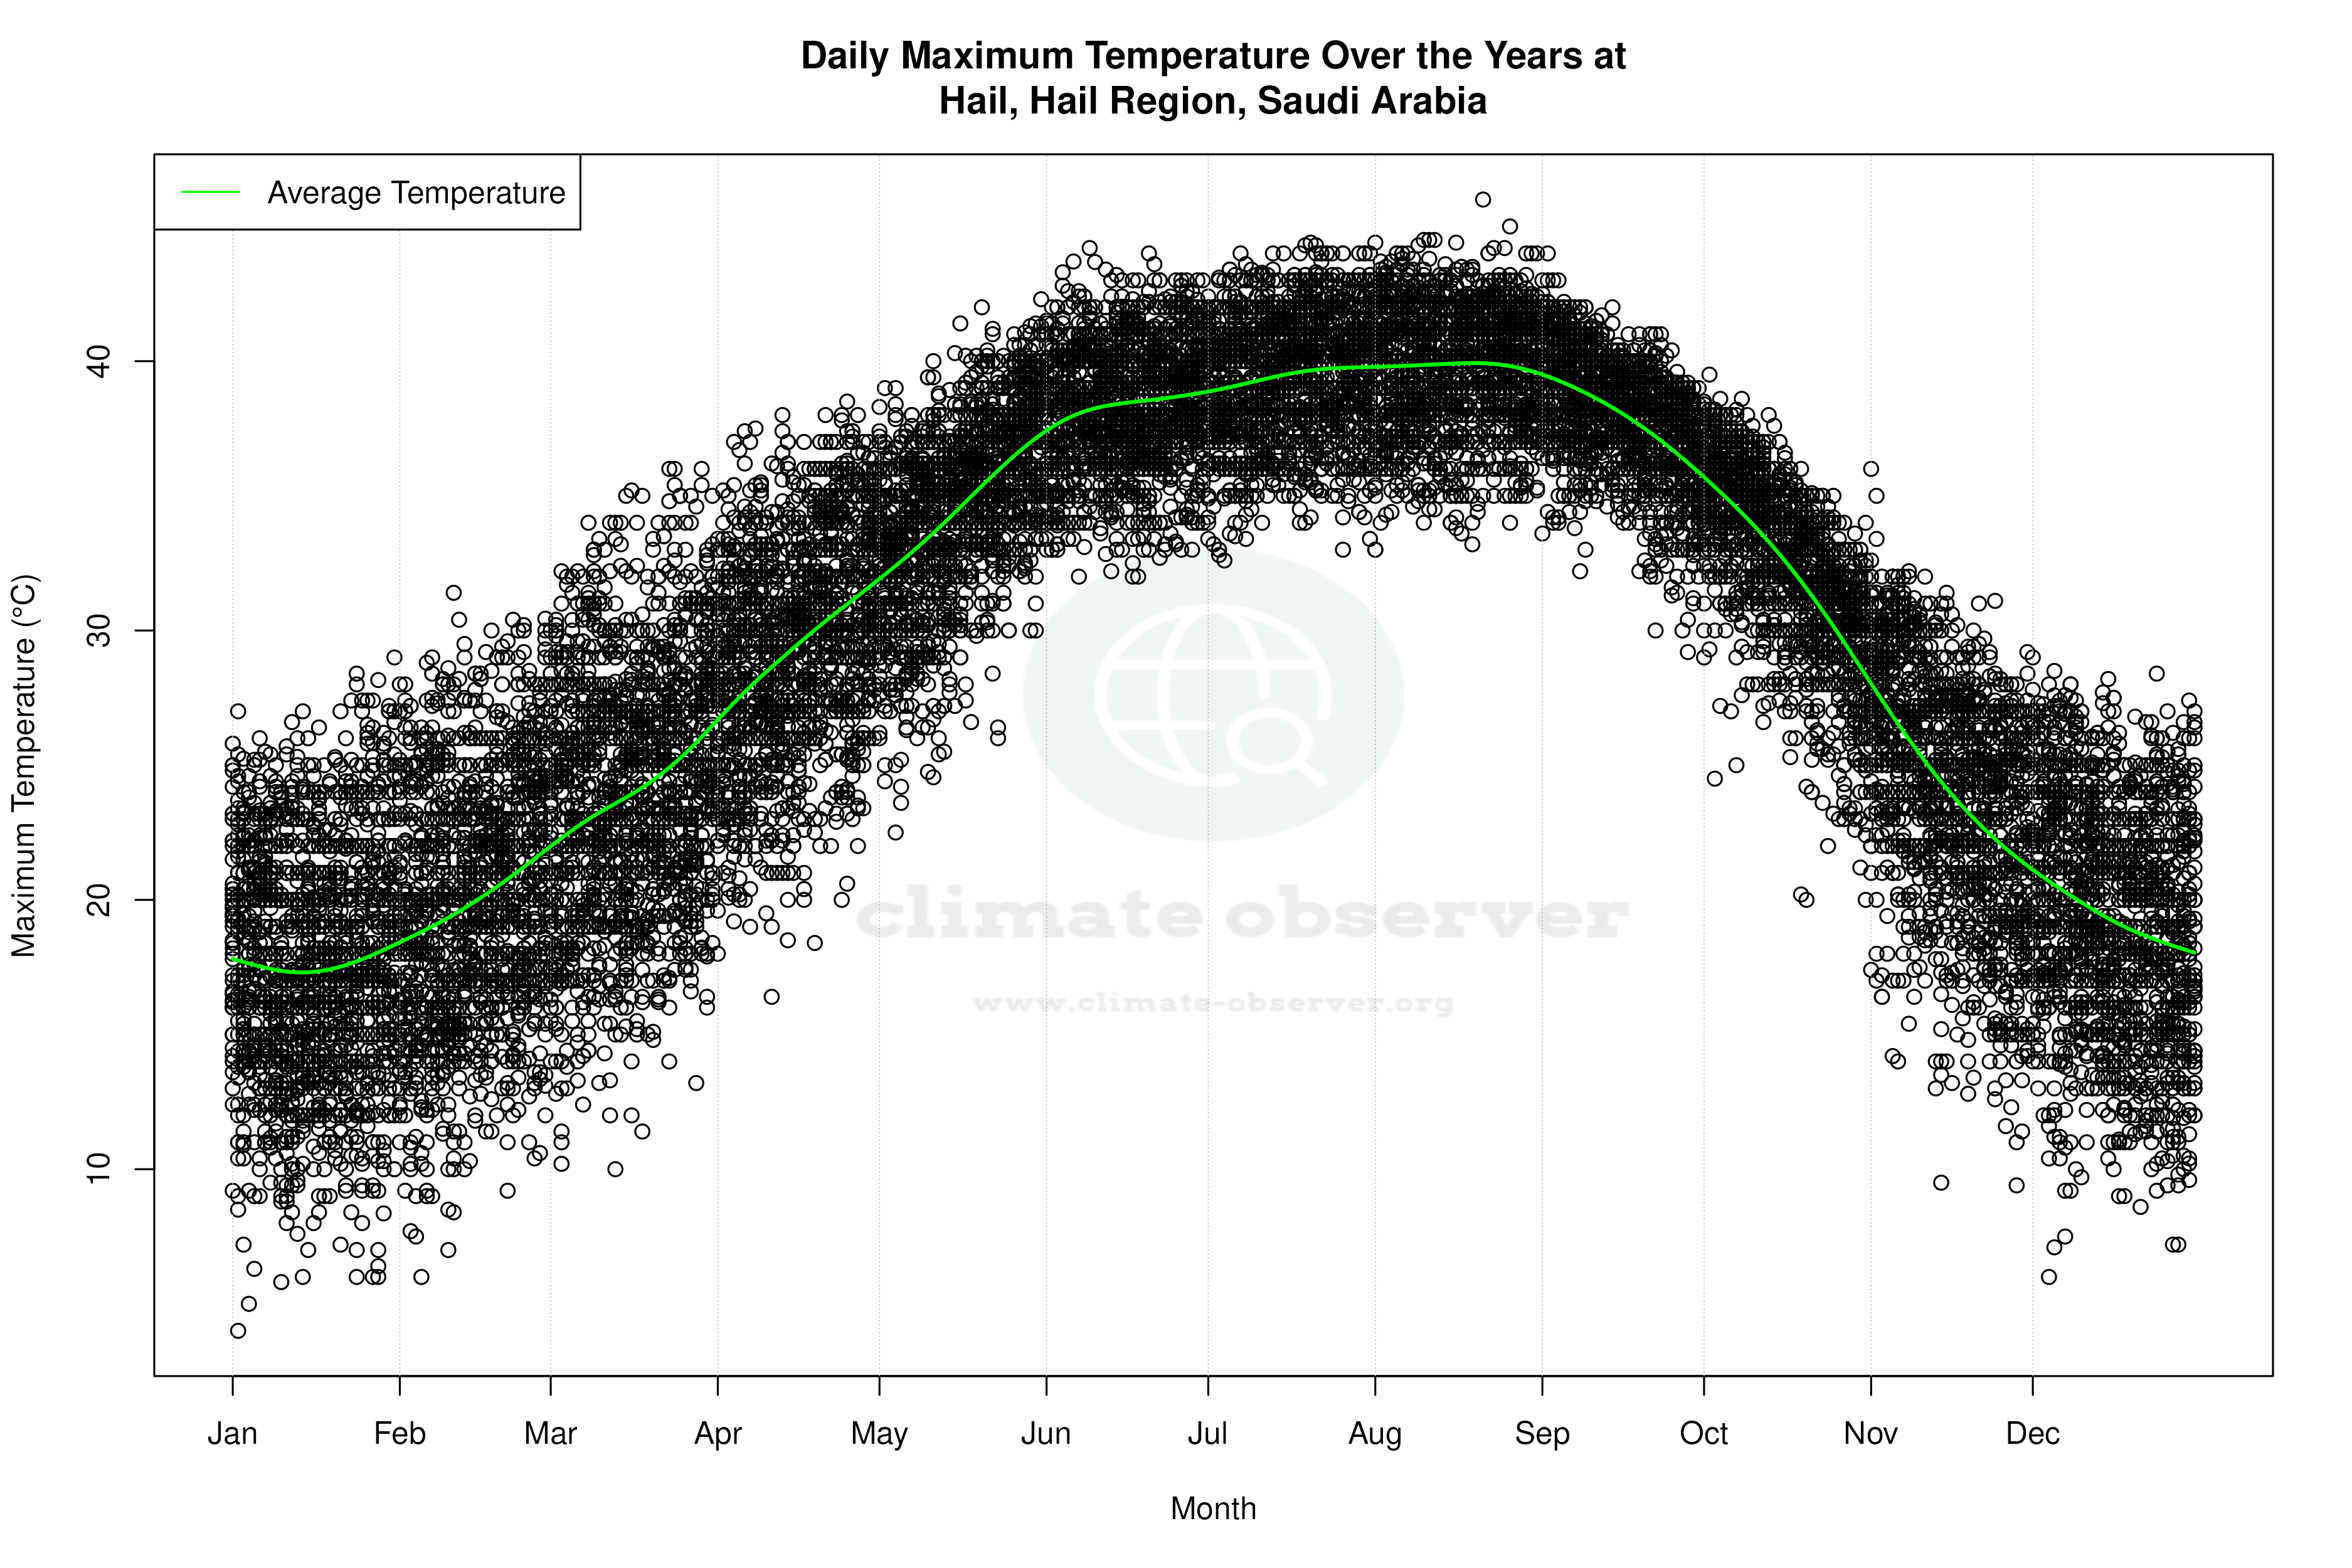


Average Max Temperature Throughout Year | 1 of 5
