Climate for Station: Seychelles Internat, Grand Anse (Mahe), Seychelles
Loading live weather...
Climate Analysis & Overview
Seychelles International Airport is experiencing a warming trend, with both high and low temperatures rising over time. The precipitation pattern is becoming slightly more concentrated, suggesting shifts in rainfall distribution. These changes align with broader regional climate goals aimed at understanding and adapting to climate variability.
Tropical Maritime Climate Influences
Located at -4.67° latitude and 55.52° longitude, Seychelles International Airport sits within a tropical maritime climate zone, characterised by warm temperatures and significant humidity year-round. The Indian Ocean's proximity moderates temperature extremes, while the island's geography, including its coastal positioning, influences local weather patterns. This setting results in a climate that is both stable and subject to the nuances of oceanic influences.
Temperature Trends: A Warming Narrative
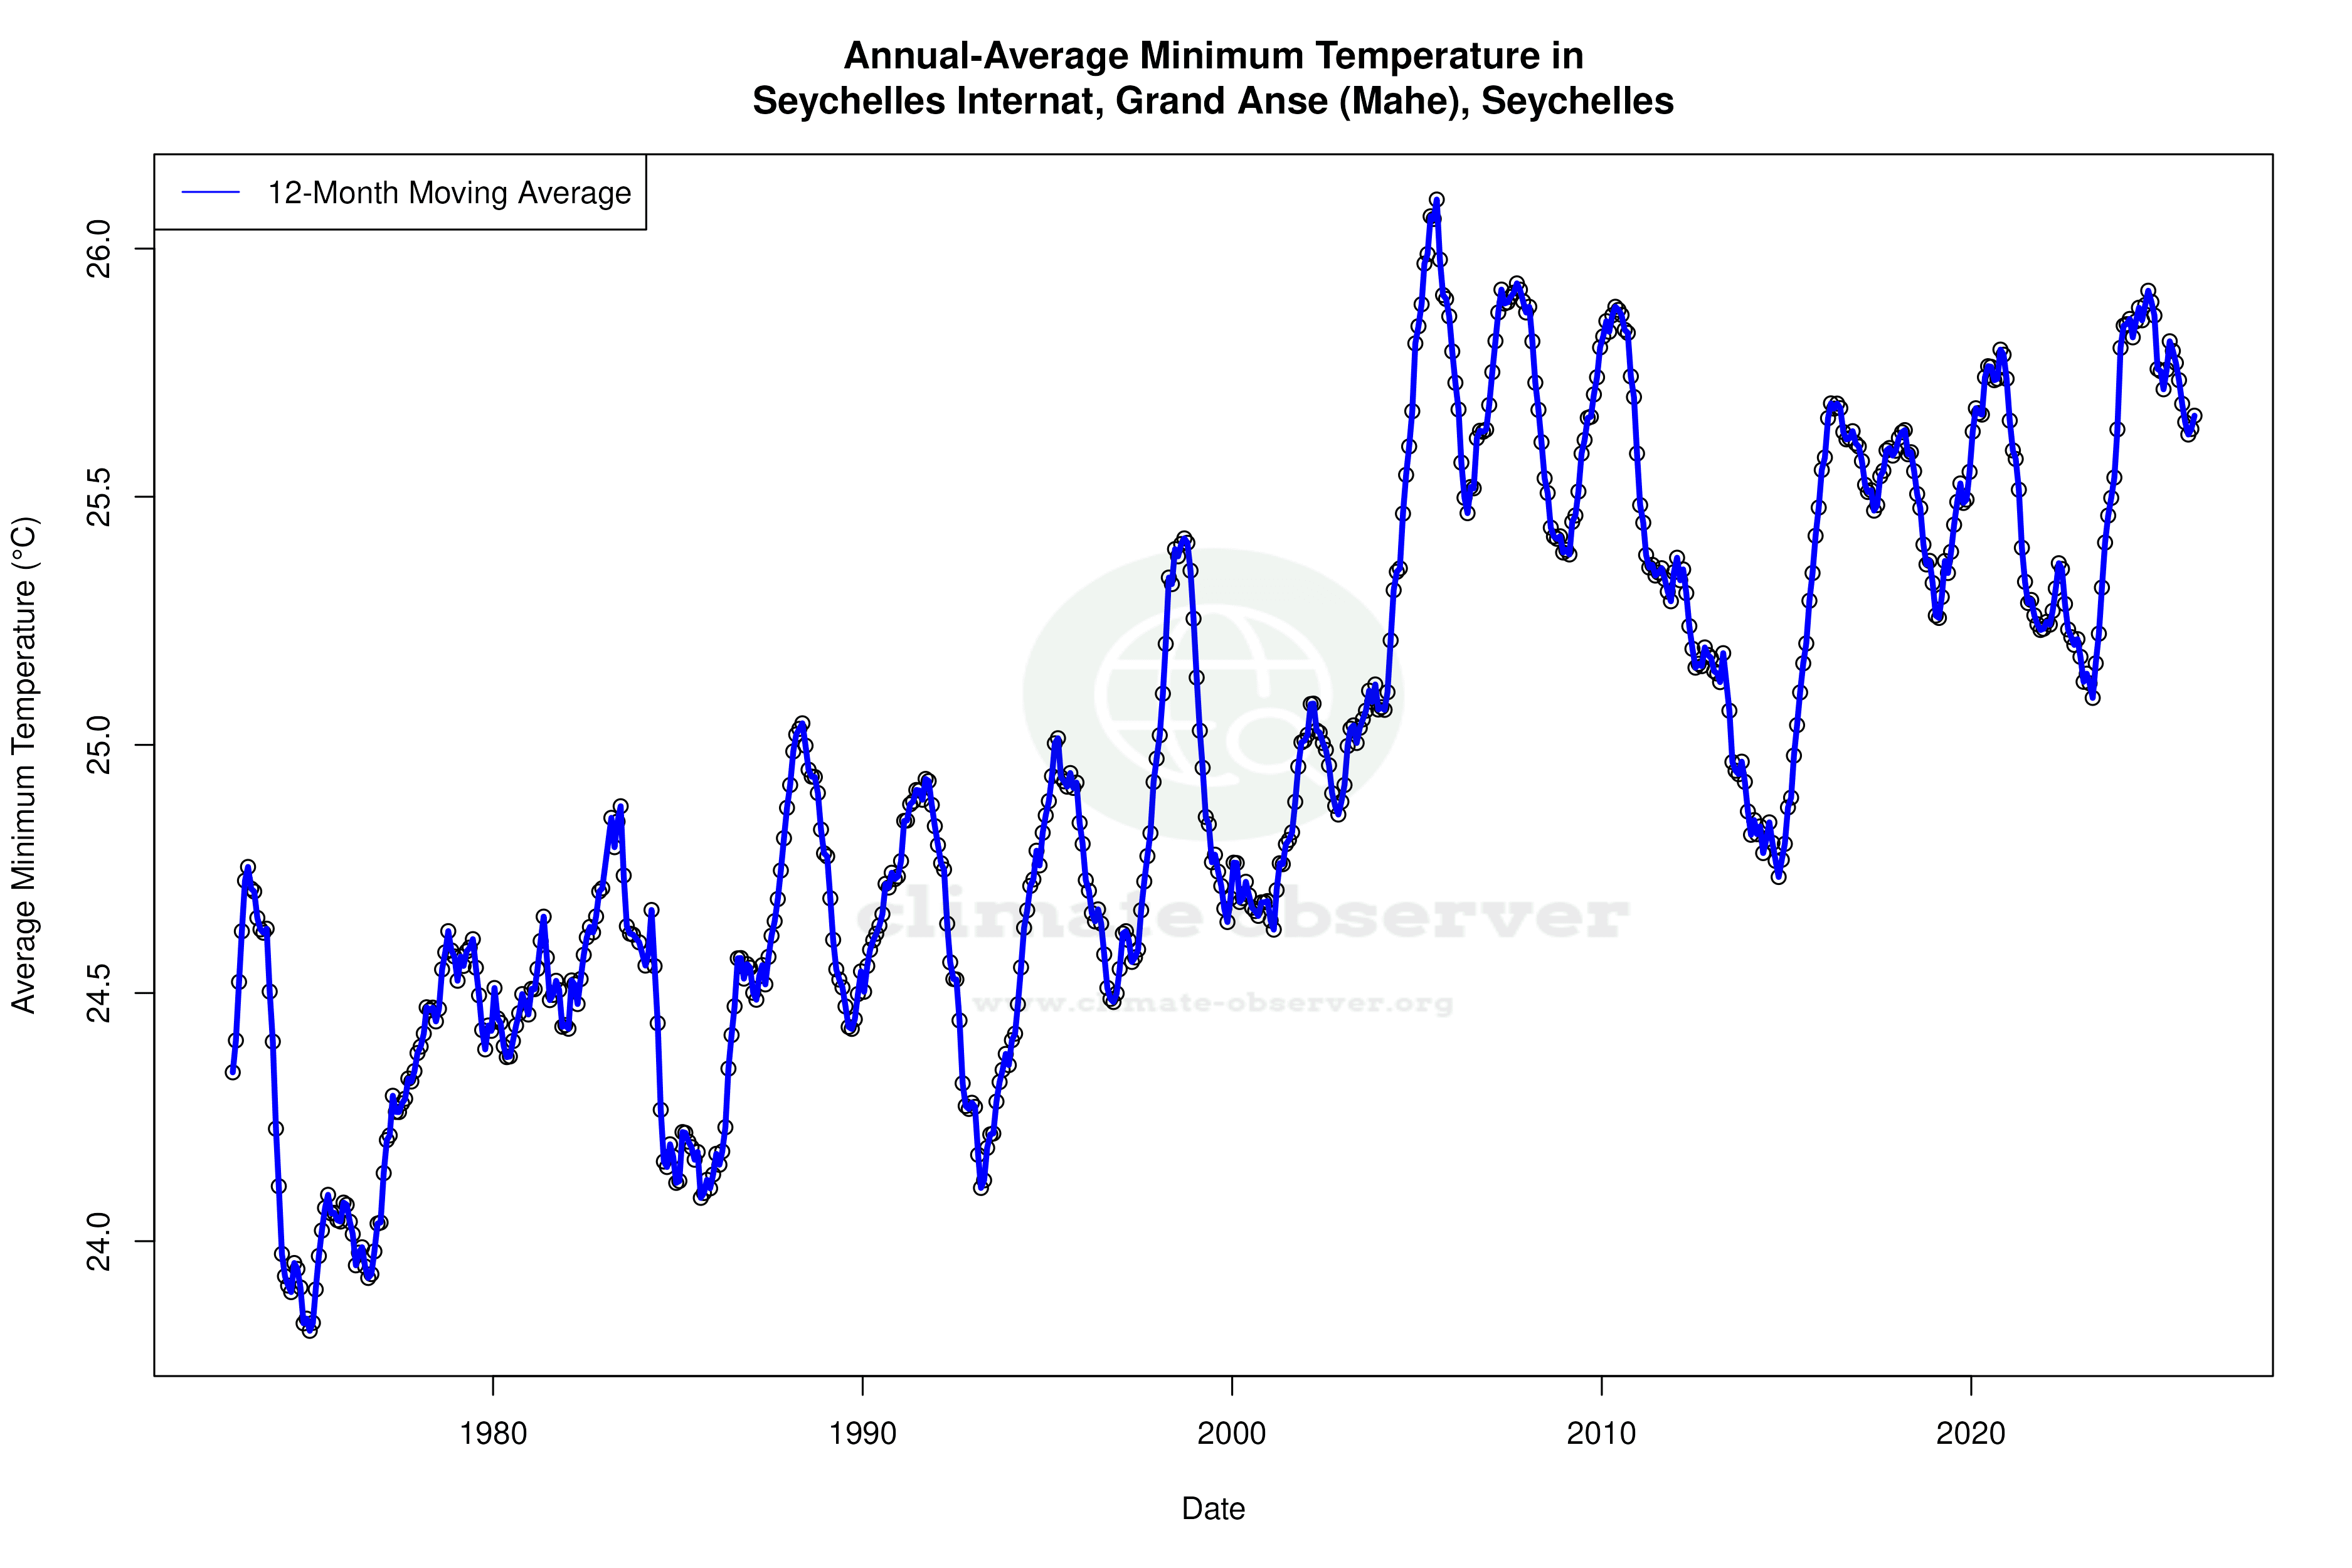
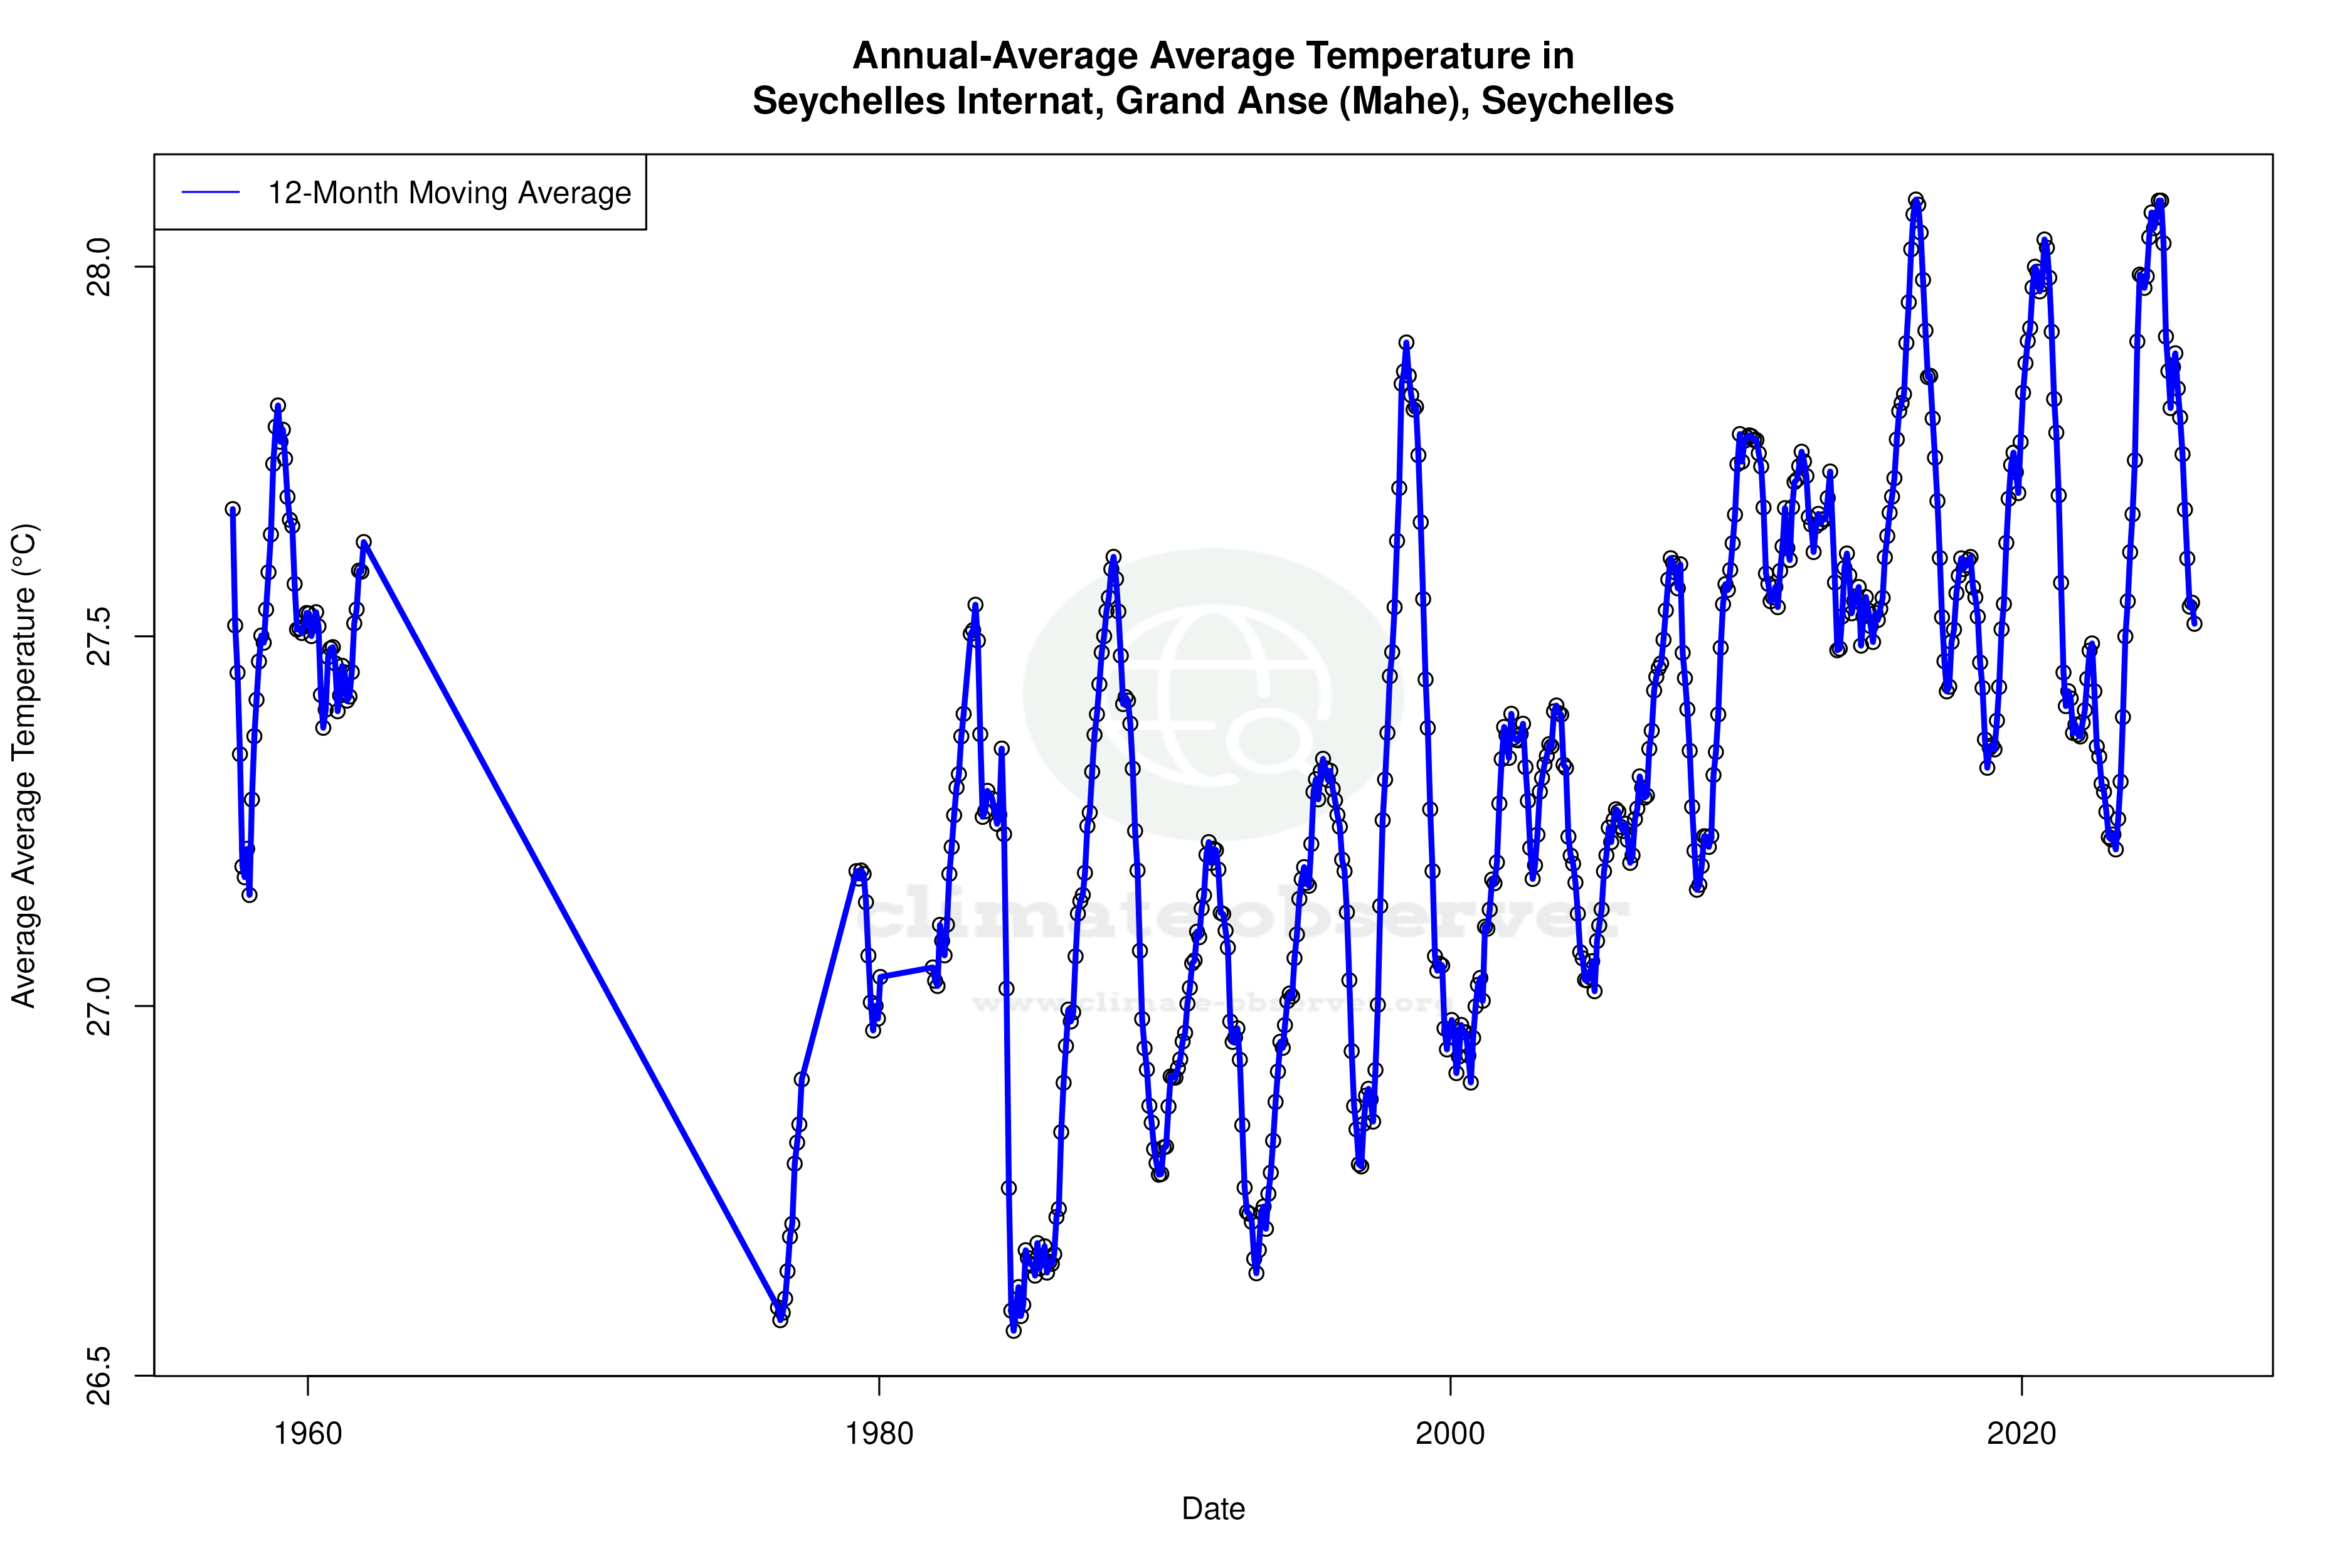
The all-time temperature trends reveal a consistent warming pattern. Highs have increased by 0.08°C (0.14°F), while lows have risen more significantly by 0.30°C (0.53°F). This warming trend is more pronounced in the lows, indicating a narrowing of the diurnal temperature range. Over the past decade, the highs show a modest increase of 0.01°C (0.02°F), while the lows have risen by 0.09°C (0.16°F). These figures suggest a persistent warming trend, with the lows experiencing a more accelerated rise.
Precipitation Patterns: Slight Concentration Increase
The Precipitation Concentration Index (PCI) has shifted from a baseline of 12.96 to a current value of 13.88. This indicates a slight increase in precipitation concentration, meaning rainfall events are becoming more intense but less frequent. While this change is not drastic, it reflects a subtle shift in how precipitation is distributed throughout the year. Such changes can impact water management strategies and agricultural planning, aligning with regional efforts to adapt to evolving climate patterns.
Temperature Extremes: Record Observations
The station has recorded a maximum temperature of 35.0°C (95.0°F) and a minimum of 19.2°C (66.6°F). These extremes highlight the range of temperatures experienced in this tropical locale, although the moderation by the surrounding ocean ensures that such extremes are relatively rare. Understanding these records is crucial for assessing the potential impacts of future climate variability on infrastructure and ecosystems.
Regional Climate Goals and Adaptation
As Seychelles continues to navigate the challenges posed by climate change, understanding localised climate trends is vital. The observed warming trends and shifts in precipitation patterns are essential data points for regional climate adaptation strategies. These insights support ongoing efforts to enhance resilience against climate impacts, ensuring sustainable development in the face of environmental changes.
Station Statistics
10-Year Trend
High: -0.24 °F/decade
Low: +0.38 °F/decade
Rain: +0.096 in/decade
25-Year Trend
High: +0.43 °F/decade
Low: +0.17 °F/decade
Rain: -0.015 in/decade
50-Year Trend
High: +0.14 °F/decade
Low: +0.53 °F/decade
Rain: -0.005 in/decade
All-Time Trend
High: +0.14 °F/decade
Low: +0.54 °F/decade
Rain: -0.006 in/decade
Percentage Above-Average Days
Last 12 Months: 25.8%
This Year: 10.2%
Precipitation Concentration Index (PCI) ℹ️
Last 12 Months: 13.0
Historical Average: 12.6
Percentile Rank of Last 12 Months ℹ️
High: 38th percentile
Low: 90th percentile
Rain: 6th percentile
Change in Variance ℹ️
High: -4.9%
Low: -14.5%
Intraday: -16.8%
Data Coverage
78.7%
First Year of Data
1957
Station Location
Historical Weather Records
| Max High | Avg High | Min High | Max Avg | Avg Avg | Min Avg | Max Low | Avg Low | Min Low | Max Precipitation | Avg Precipitation | Max Snow | Avg Snow | |
|---|---|---|---|---|---|---|---|---|---|---|---|---|---|
| Record | 95.00 °F | — | 76.98 °F | 88.52 °F | — | 73.04 °F | 84.42 °F | — | 66.56 °F | 9.65 in | — | — | — |
| January | 92.30 °F | 85.76 °F | 78.80 °F | 85.82 °F | 80.97 °F | 75.56 °F | 83.30 °F | 76.41 °F | 66.56 °F | 8.90 in | 0.47 in | — | — |
| February | 94.46 °F | 86.75 °F | 79.16 °F | 86.36 °F | 81.99 °F | 74.84 °F | 83.84 °F | 77.47 °F | 69.98 °F | 9.65 in | 0.33 in | — | — |
| March | 93.20 °F | 87.99 °F | 79.34 °F | 88.52 °F | 82.78 °F | 76.10 °F | 84.20 °F | 77.84 °F | 68.00 °F | 6.46 in | 0.24 in | — | — |
| April | 95.00 °F | 88.57 °F | 81.14 °F | 88.52 °F | 83.30 °F | 76.64 °F | 84.22 °F | 78.25 °F | 71.60 °F | 6.88 in | 0.26 in | — | — |
| May | 92.30 °F | 87.21 °F | 79.38 °F | 87.80 °F | 82.77 °F | 77.00 °F | 84.42 °F | 78.66 °F | 70.88 °F | 4.49 in | 0.18 in | — | — |
| June | 90.68 °F | 84.67 °F | 77.77 °F | 85.64 °F | 80.67 °F | 74.84 °F | 83.05 °F | 77.21 °F | 69.62 °F | 2.80 in | 0.12 in | — | — |
| July | 87.98 °F | 83.25 °F | 76.98 °F | 83.84 °F | 79.20 °F | 73.04 °F | 80.35 °F | 75.85 °F | 68.72 °F | 2.05 in | 0.09 in | — | — |
| August | 88.52 °F | 83.45 °F | 77.00 °F | 82.94 °F | 79.21 °F | 75.02 °F | 80.31 °F | 75.82 °F | 67.28 °F | 3.23 in | 0.12 in | — | — |
| September | 91.40 °F | 84.56 °F | 78.08 °F | 83.48 °F | 80.18 °F | 75.02 °F | 81.01 °F | 76.46 °F | 68.36 °F | 5.00 in | 0.19 in | — | — |
| October | 90.50 °F | 85.79 °F | 79.16 °F | 84.74 °F | 80.98 °F | 75.74 °F | 81.23 °F | 76.80 °F | 67.28 °F | 8.98 in | 0.23 in | — | — |
| November | 93.92 °F | 86.41 °F | 78.44 °F | 86.90 °F | 81.14 °F | 75.56 °F | 82.40 °F | 76.31 °F | 70.70 °F | 5.71 in | 0.25 in | — | — |
| December | 92.12 °F | 86.36 °F | 77.90 °F | 85.64 °F | 81.10 °F | 75.74 °F | 82.47 °F | 76.25 °F | 68.00 °F | 8.03 in | 0.37 in | — | — |
Data Visualisations
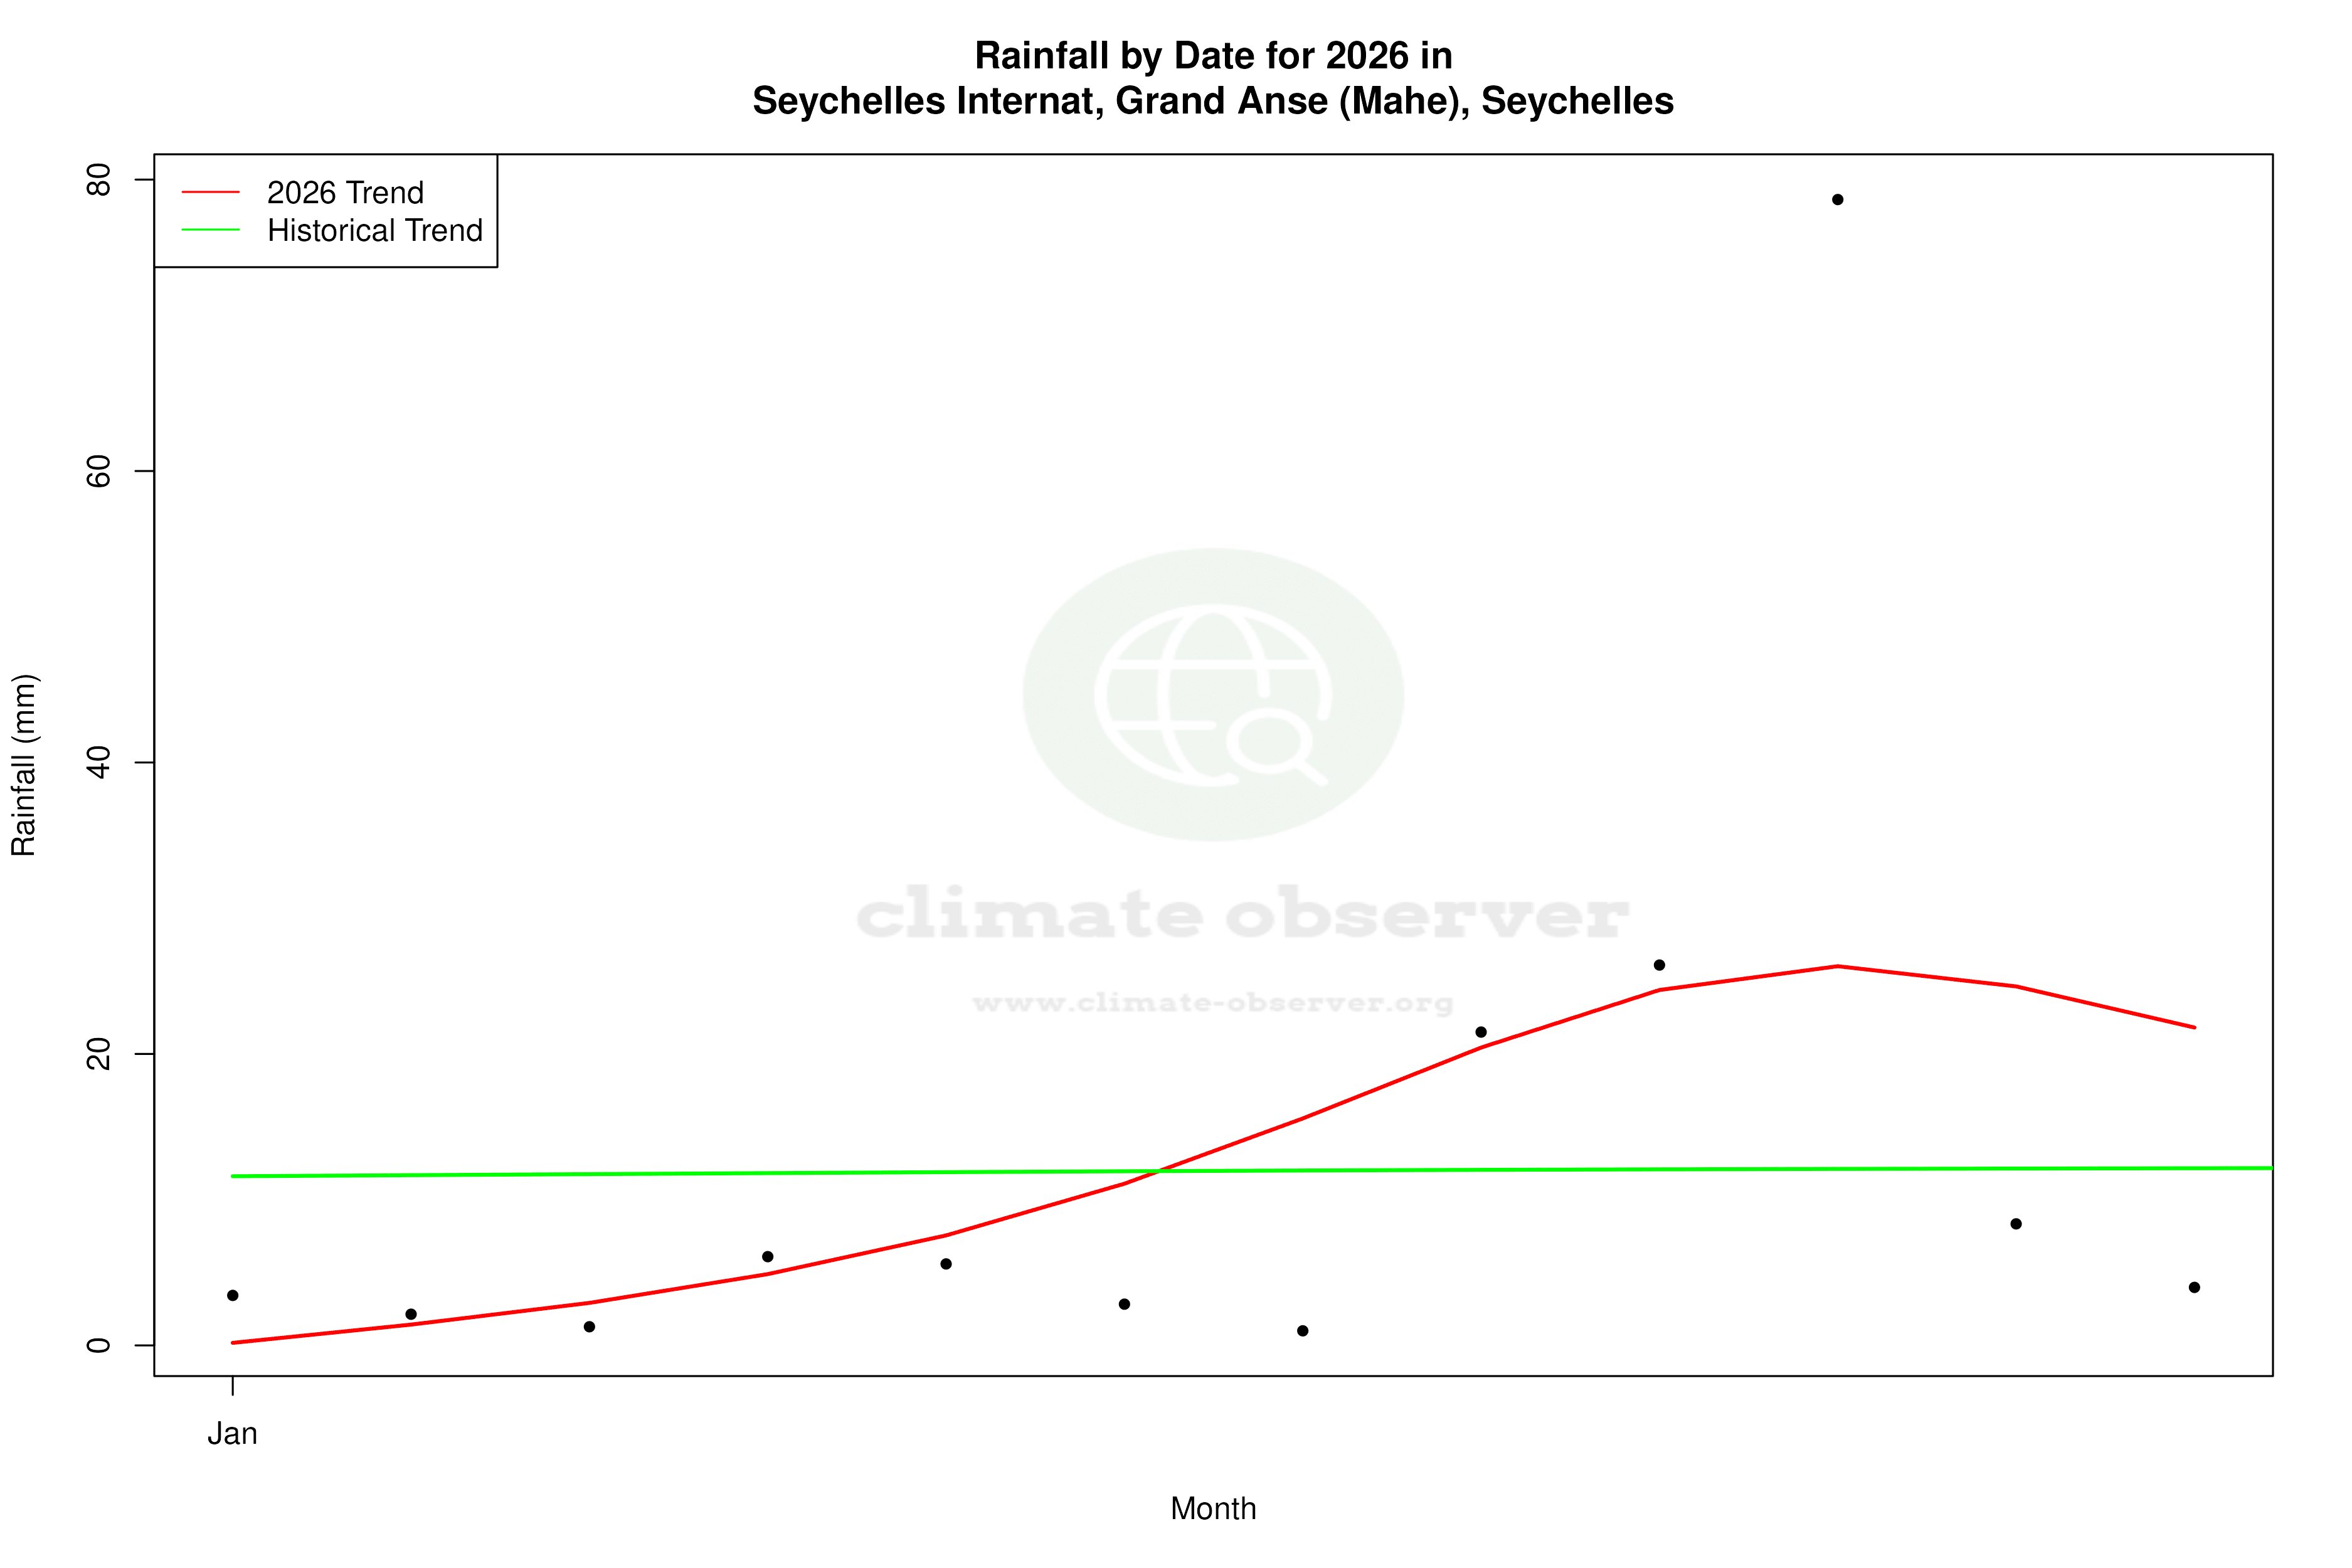
Remove WatermarksCurrent Year Climate Trends vs Historical
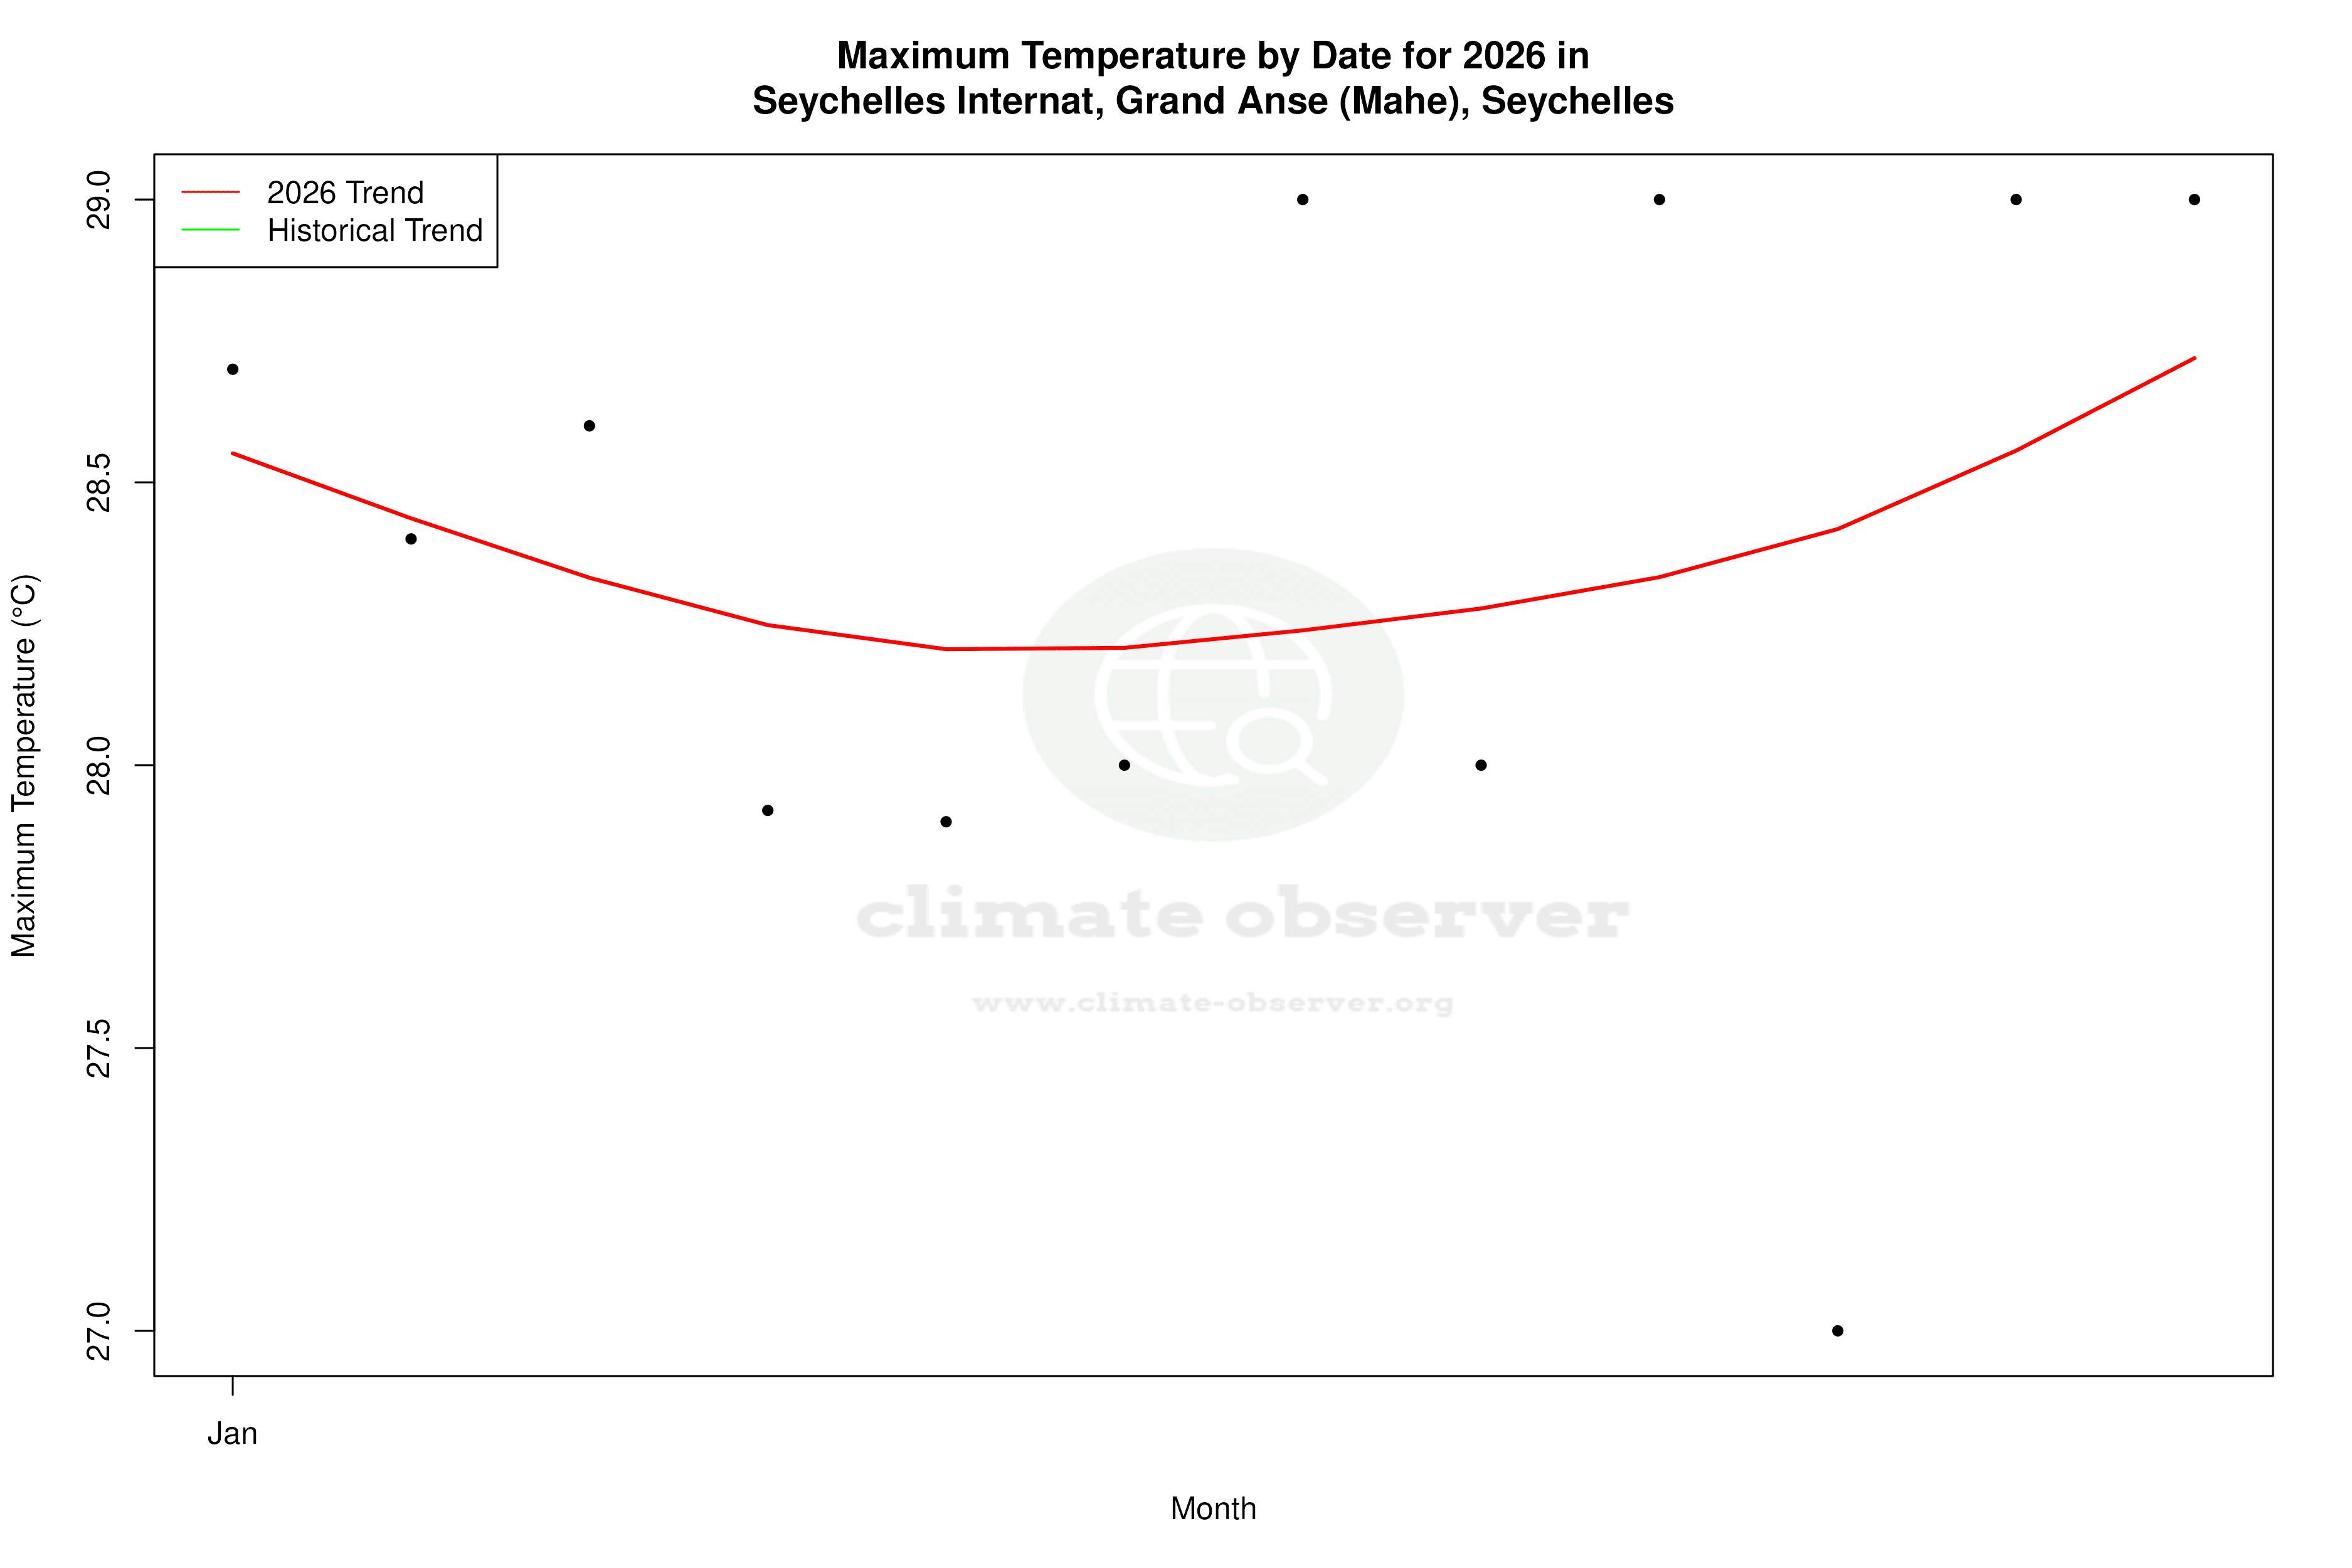


Max Temperature this Year | 1 of 6
Climate 12-Month Moving Averages
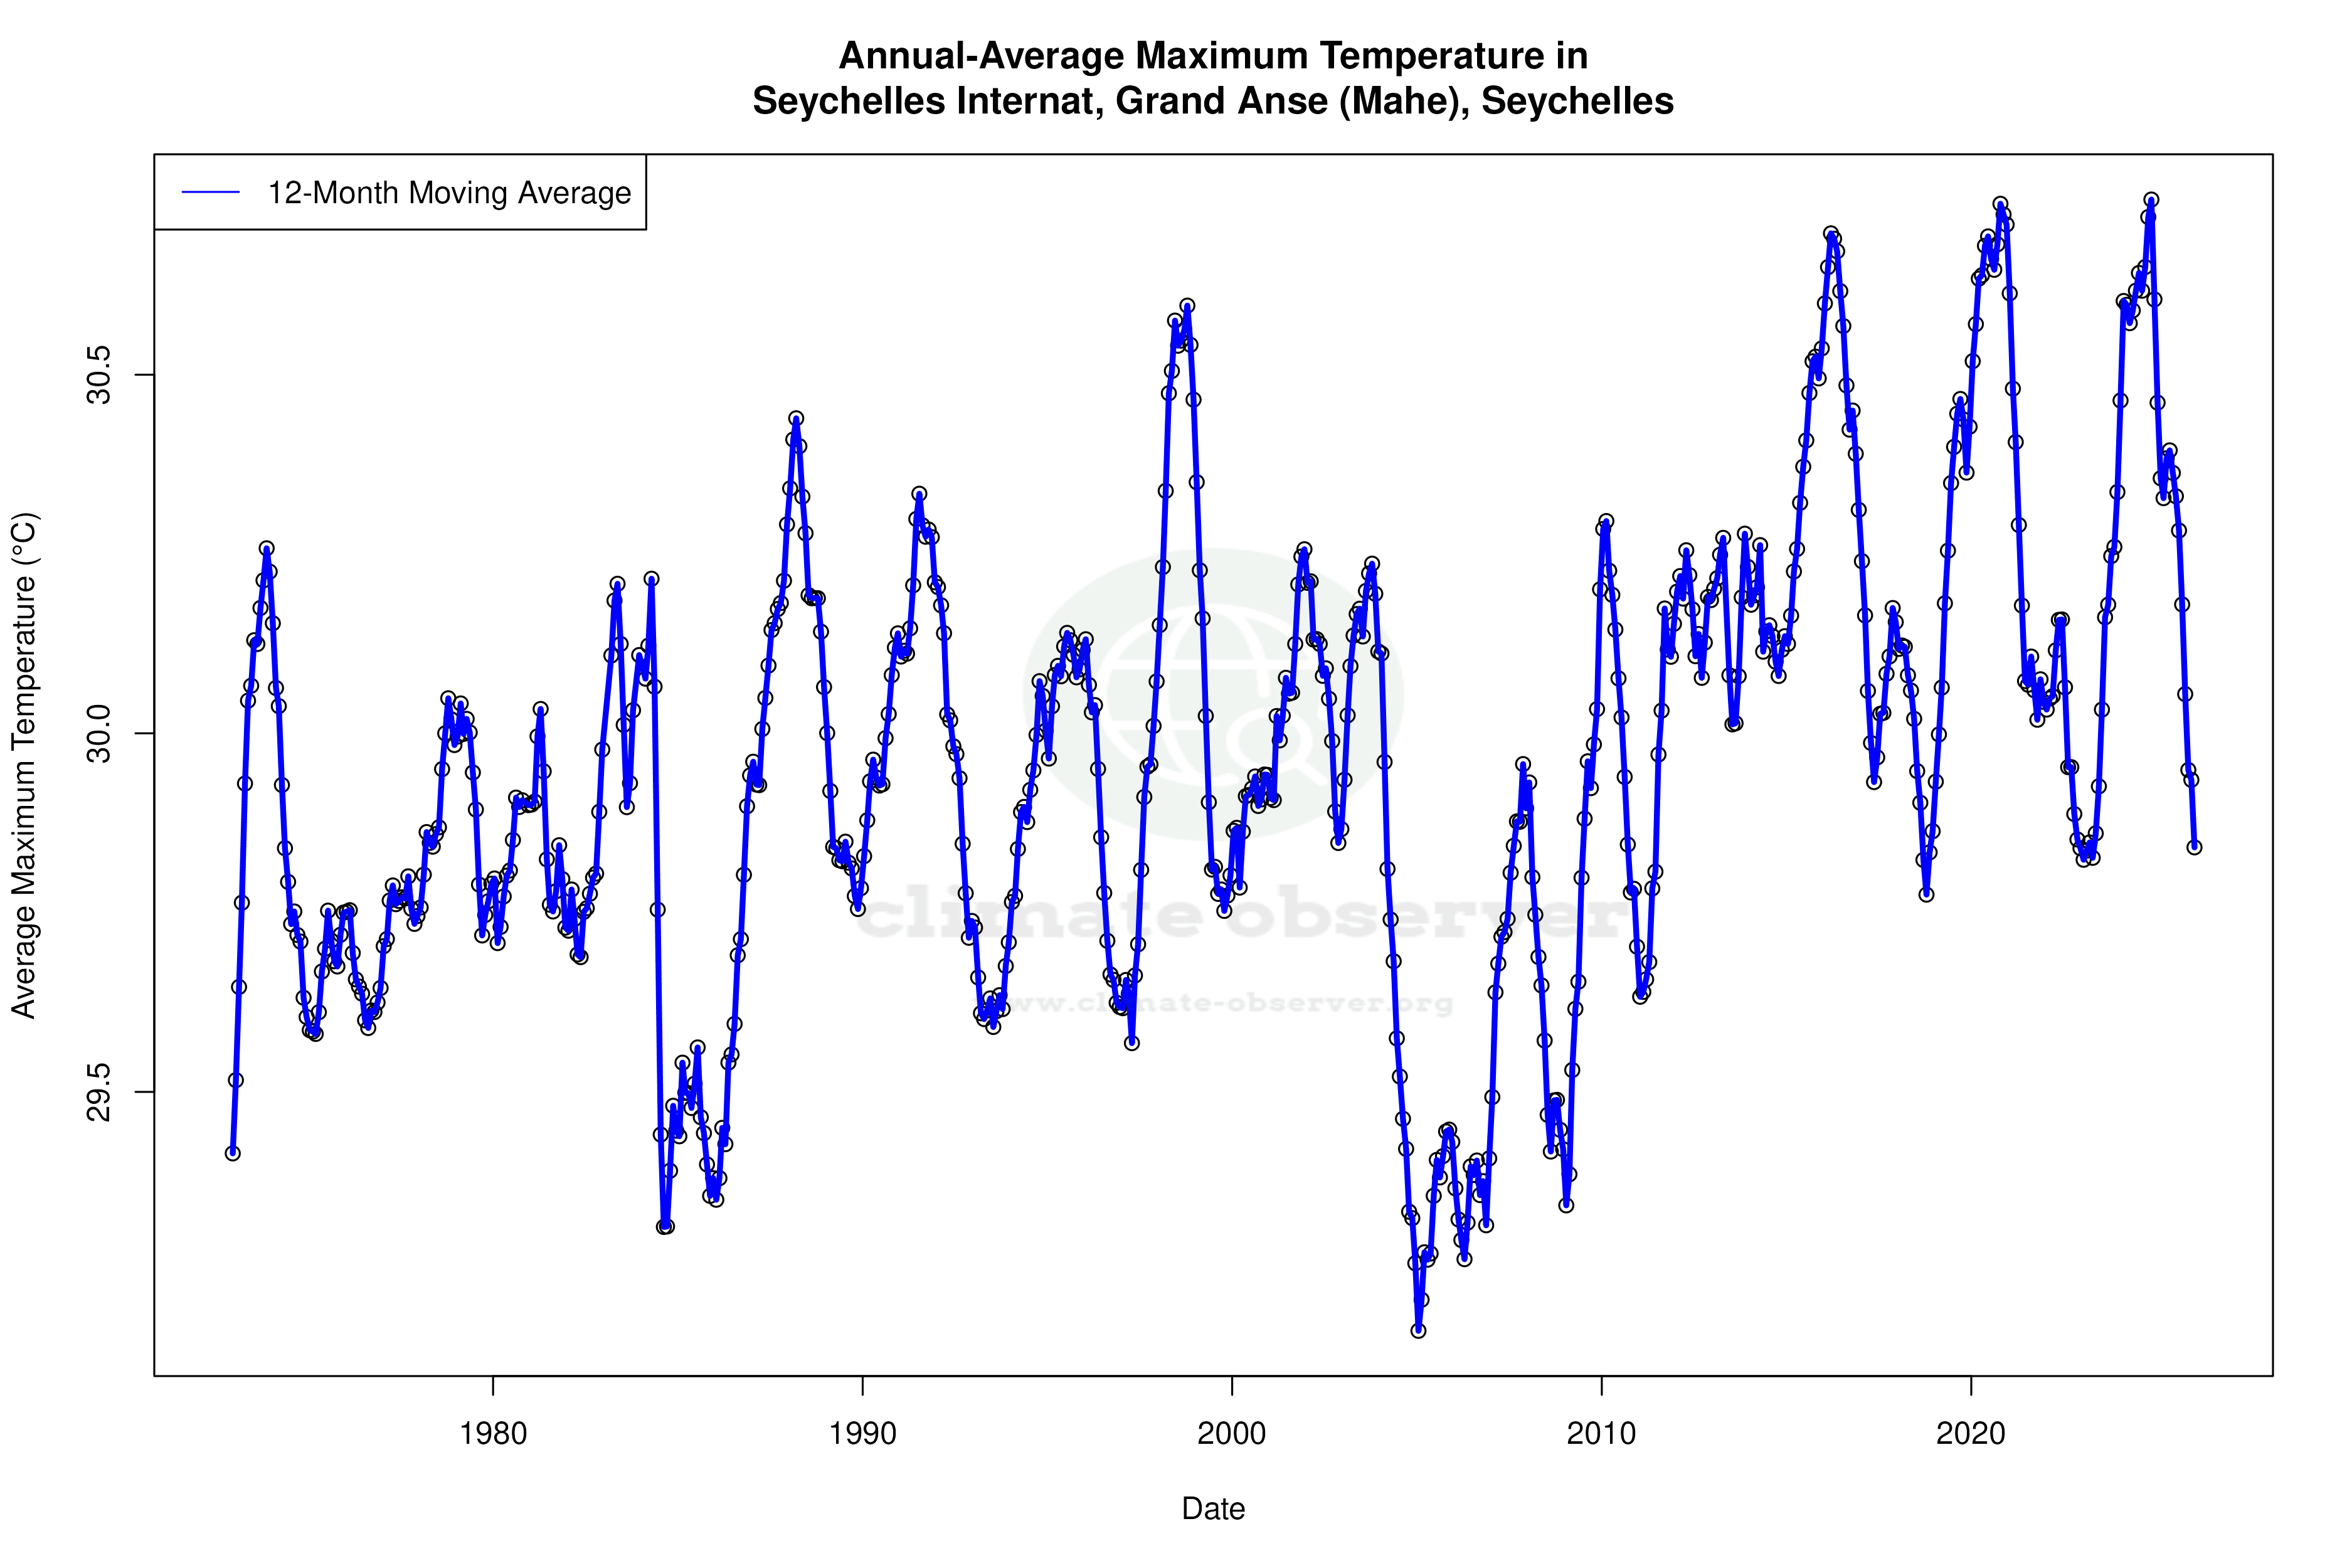


Max Temperature 12-Month MA | 1 of 6
Daily Data Points and Averages Throughout the Year


Average Max Temperature Throughout Year | 1 of 5
