Climate for Station: Skukuza, Mpumalanga, South Africa
Loading live weather...
Climate Analysis & Overview
Skukuza, located in the heart of Mpumalanga, South Africa, experiences a complex climate narrative shaped by both long-term warming trends and recent cooling in high temperatures. The region's precipitation patterns have intensified, with rain becoming more concentrated, posing challenges for local ecosystems and water management.
Climate Classification and Geographic Influence
Skukuza is situated within the Bushbuckridge Ward 34, characterised by a tropical savanna climate (Köppen classification Aw). This region is influenced by its proximity to the Kruger National Park, where the landscape is predominantly flat with scattered hills. The local geography, including the nearby Sabie River, plays a crucial role in modulating the area's climate by affecting humidity and temperature patterns.
Temperature Trends: A Mixed Bag
The all-time temperature trends indicate a warming of 0.46°C (0.83°F) for high temperatures and 0.24°C (0.43°F) for low temperatures. This suggests a gradual rise in overall temperatures over the years. However, the last decade presents a contrasting picture, with high temperatures showing a cooling of 1.62°C (2.92°F), while low temperatures have increased by 0.26°C (0.47°F). This divergence highlights the complexity of local climate dynamics, possibly influenced by regional atmospheric patterns or human activities.
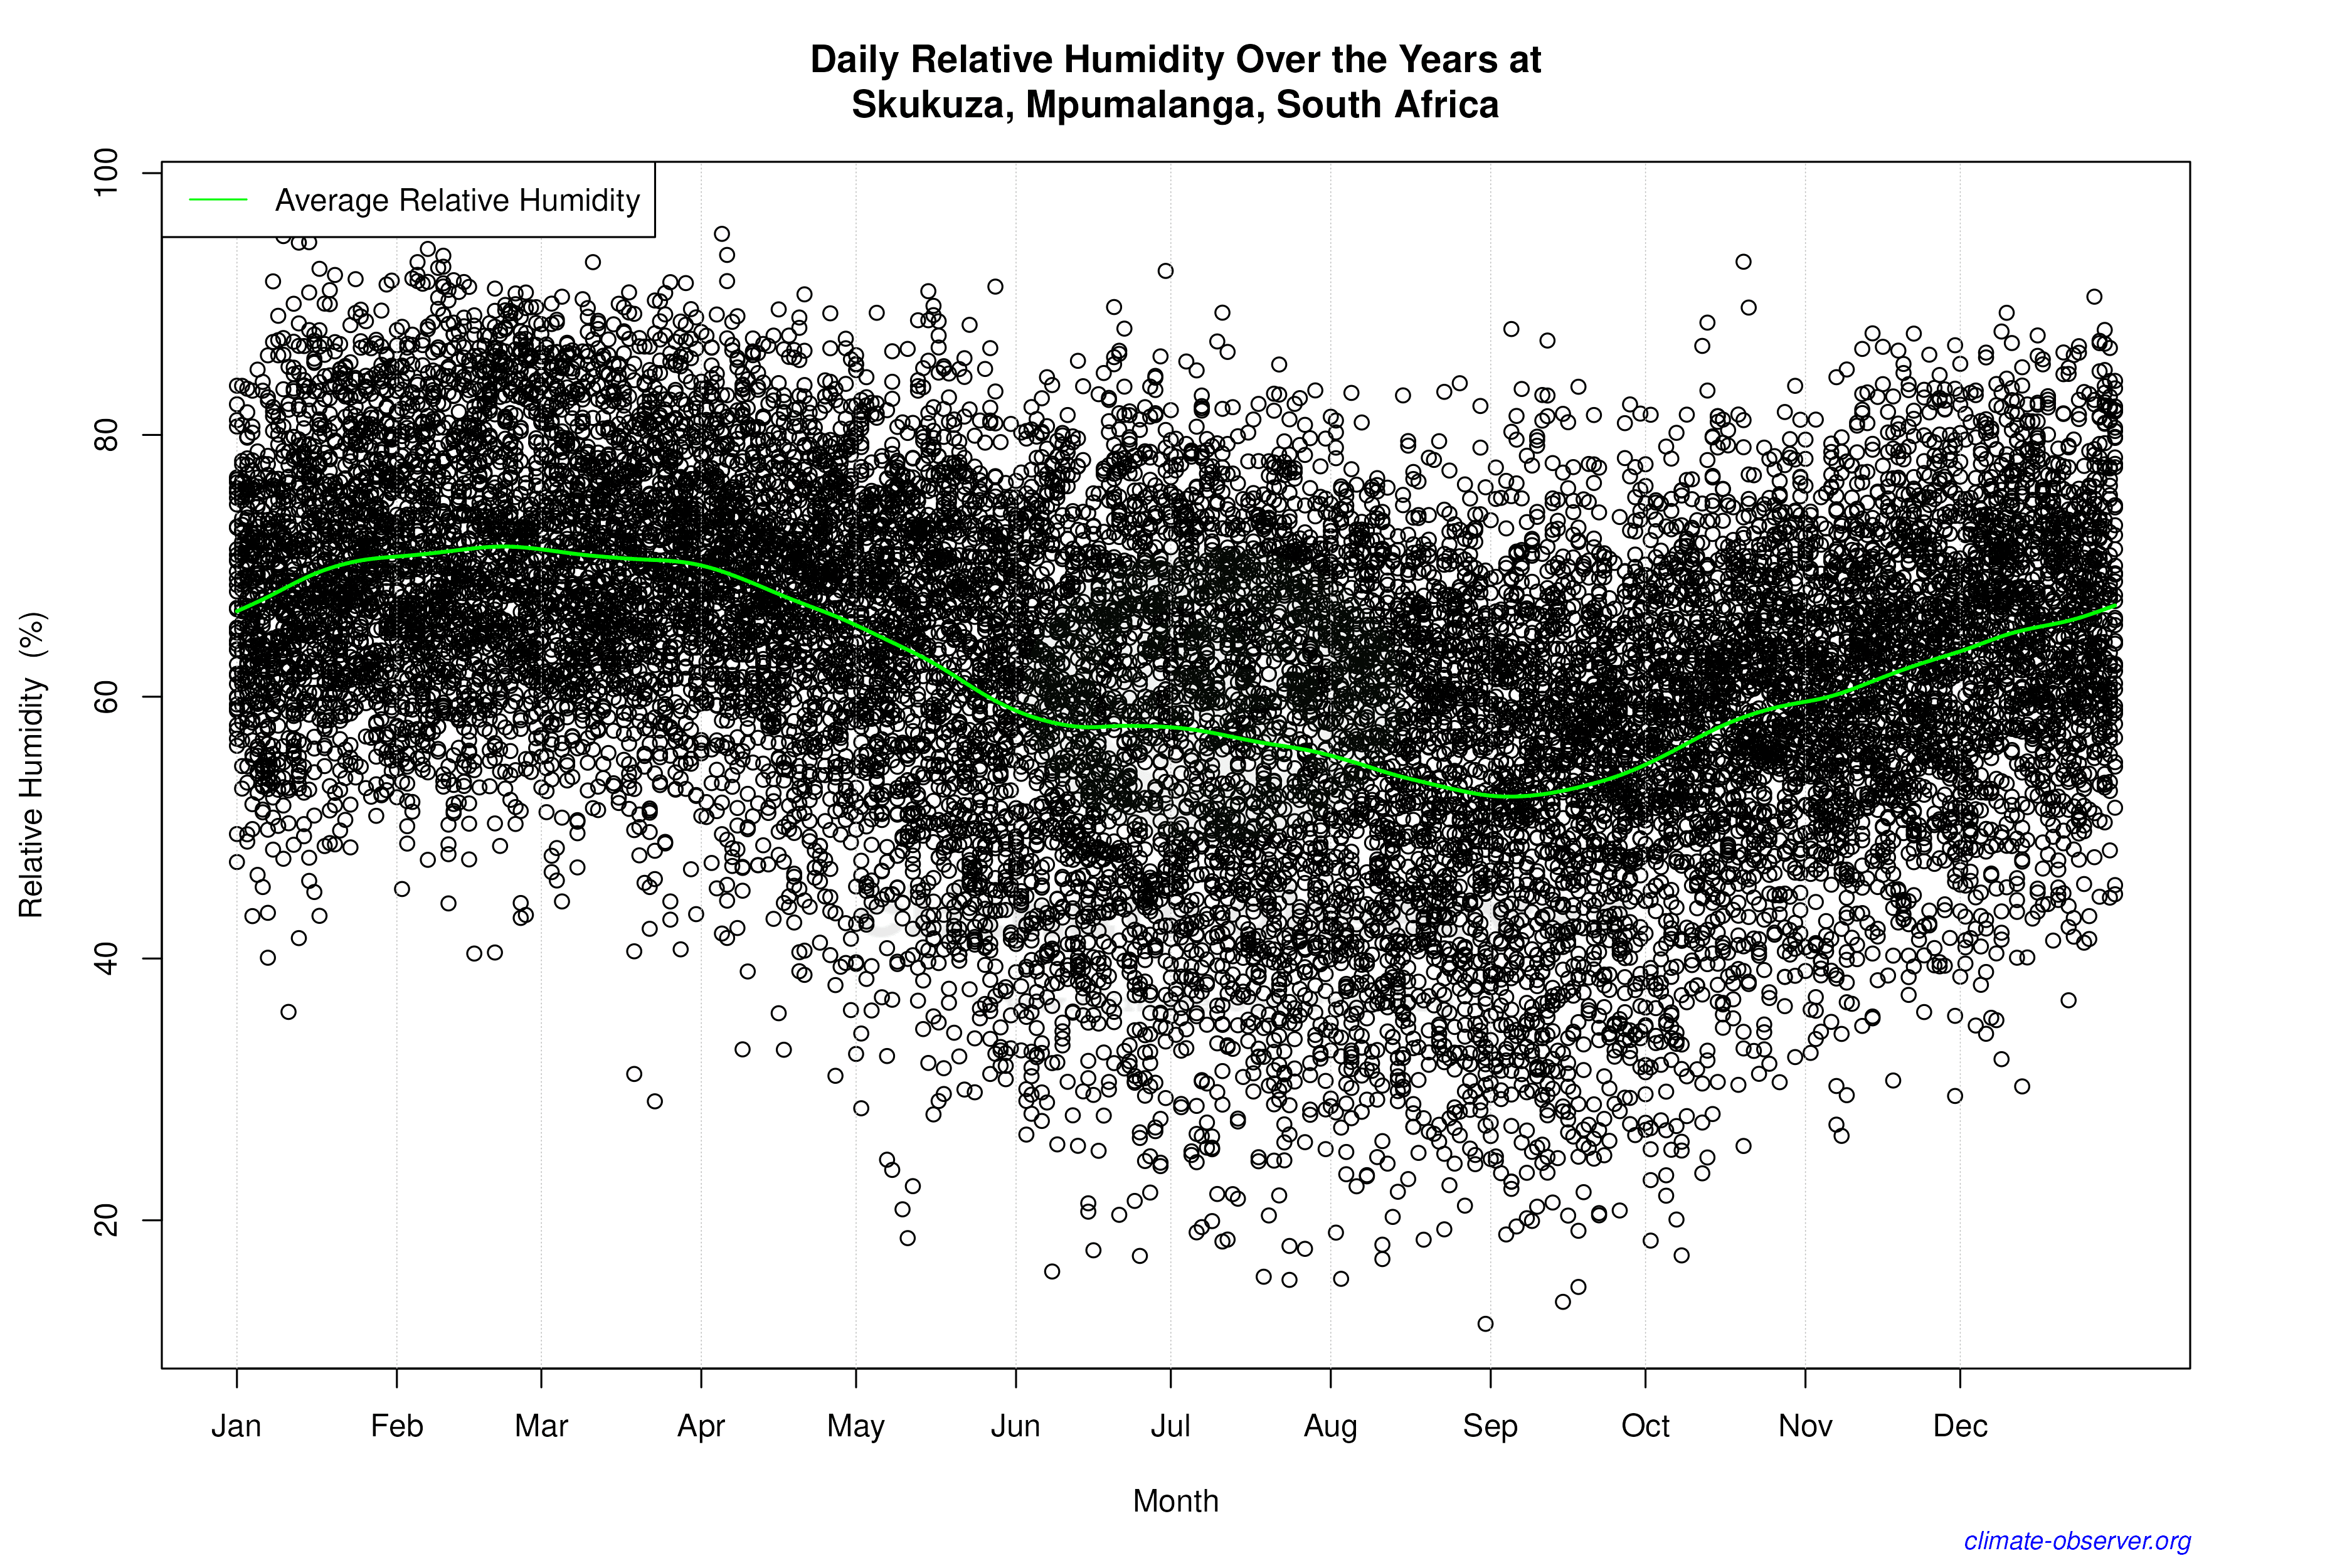
Precipitation Patterns: Intensifying Concentration
The Precipitation Concentration Index (PCI) has seen a significant increase from a baseline of 17.4 to a current value of 28.4. This shift indicates that rainfall is becoming more concentrated in fewer, more intense events, which can lead to challenges such as flash flooding and soil erosion. A PCI over 20 is considered highly concentrated, suggesting that Skukuza experiences periods of heavy rainfall interspersed with dry spells.
Temperature Extremes: Record Observations
Skukuza has recorded extreme temperatures, with a maximum of 46.9°C (116.4°F) and a minimum of -7.0°C (19.4°F). These records underscore the region's susceptibility to temperature extremes, which can have profound impacts on both the natural environment and human activities. Such extremes are critical data points for understanding the potential impacts of climate variability in the region.
Regional Climate Goals and Challenges
South Africa has set ambitious climate goals, focusing on reducing greenhouse gas emissions and adapting to climate change impacts. The trends observed in Skukuza, particularly the increasing concentration of precipitation, highlight the need for adaptive strategies in water management and infrastructure. Recent weather events, such as droughts and heatwaves, further emphasise the urgency of these goals.
Station Statistics
10-Year Trend
High: -3.37 °F/decade
Low: +1.19 °F/decade
Rain: +0.022 in/decade
25-Year Trend
High: +0.23 °F/decade
Low: -2.50 °F/decade
Rain: +0.008 in/decade
50-Year Trend
High: +1.09 °F/decade
Low: +0.34 °F/decade
Rain: +0.003 in/decade
All-Time Trend
High: +0.83 °F/decade
Low: +0.47 °F/decade
Rain: +0.001 in/decade
Percentage Above-Average Days
Last 12 Months: 34.5%
This Year: 32.9%
Precipitation Concentration Index (PCI) ℹ️
Last 12 Months: 22.3
Historical Average: 18.7
Percentile Rank of Last 12 Months ℹ️
High: 27th percentile
Low: 80th percentile
Rain: 78th percentile
Change in Variance ℹ️
High: +7.3%
Low: +4.0%
Intraday: +6.4%
Data Coverage
61.2%
First Year of Data
1911
Station Location
Historical Weather Records
| Max High | Avg High | Min High | Max Avg | Avg Avg | Min Avg | Max Low | Avg Low | Min Low | Max Precipitation | Avg Precipitation | Max Snow | Avg Snow | |
|---|---|---|---|---|---|---|---|---|---|---|---|---|---|
| Record | 116.42 °F | — | 51.26 °F | 97.88 °F | — | 43.52 °F | 90.14 °F | — | 19.40 °F | 9.37 in | — | — | — |
| January | 112.46 °F | 91.36 °F | 66.56 °F | 97.16 °F | 79.23 °F | 65.66 °F | 79.52 °F | 69.07 °F | 50.18 °F | 9.37 in | 0.16 in | — | — |
| February | 114.08 °F | 90.88 °F | 66.74 °F | 96.26 °F | 78.81 °F | 66.74 °F | 81.14 °F | 69.07 °F | 50.00 °F | 7.28 in | 0.14 in | — | — |
| March | 110.48 °F | 89.60 °F | 65.80 °F | 92.07 °F | 77.20 °F | 63.07 °F | 78.19 °F | 66.80 °F | 45.68 °F | 4.72 in | 0.10 in | — | — |
| April | 106.34 °F | 86.09 °F | 63.32 °F | 87.10 °F | 72.99 °F | 59.54 °F | 74.66 °F | 60.62 °F | 40.82 °F | 7.28 in | 0.06 in | — | — |
| May | 102.56 °F | 83.36 °F | 57.02 °F | 82.83 °F | 68.11 °F | 43.70 °F | 71.06 °F | 51.82 °F | 31.82 °F | 2.24 in | 0.02 in | — | — |
| June | 97.52 °F | 79.75 °F | 54.68 °F | 79.70 °F | 63.53 °F | 44.78 °F | 64.40 °F | 44.77 °F | 23.90 °F | 1.57 in | 0.01 in | — | — |
| July | 97.52 °F | 79.59 °F | 55.40 °F | 75.56 °F | 63.38 °F | 43.52 °F | 64.40 °F | 44.49 °F | 19.40 °F | 4.13 in | 0.01 in | — | — |
| August | 108.50 °F | 82.82 °F | 51.26 °F | 89.24 °F | 67.16 °F | 46.58 °F | 70.34 °F | 49.44 °F | 23.72 °F | 3.62 in | 0.01 in | — | — |
| September | 111.92 °F | 86.70 °F | 56.30 °F | 88.52 °F | 72.67 °F | 54.50 °F | 73.76 °F | 56.47 °F | 27.86 °F | 4.53 in | 0.03 in | — | — |
| October | 114.73 °F | 87.96 °F | 58.64 °F | 93.38 °F | 75.16 °F | 55.40 °F | 90.14 °F | 61.74 °F | 40.64 °F | 4.65 in | 0.06 in | — | — |
| November | 116.42 °F | 89.13 °F | 59.72 °F | 96.08 °F | 77.25 °F | 59.72 °F | 77.41 °F | 65.20 °F | 45.68 °F | 6.54 in | 0.12 in | — | — |
| December | 115.52 °F | 91.02 °F | 63.14 °F | 97.88 °F | 78.92 °F | 55.22 °F | 78.94 °F | 67.79 °F | 49.10 °F | 6.69 in | 0.13 in | — | — |
Data Visualisations
Remove WatermarksCurrent Year Climate Trends vs Historical


Max Temperature this Year | 1 of 6
Climate 12-Month Moving Averages


Max Temperature 12-Month MA | 1 of 6
Daily Data Points and Averages Throughout the Year


Average Max Temperature Throughout Year | 1 of 5
