Climate for Station: Marion Island, Prince Edward Islands, South Africa
Loading live weather...
Climate Analysis & Overview
Marion Island exhibits a warming trend, with recent decades showing a more pronounced increase in temperature than the long-term historical record. Precipitation patterns are becoming more evenly distributed, indicating a shift in the island's climatic behaviour.
Subantarctic Climate Dynamics
Marion Island, located at -46.883° latitude and 37.867° longitude, is classified under the Köppen climate system as a tundra climate (ET), characterised by cold temperatures and significant precipitation. The island's geography, dominated by volcanic topography and surrounded by the Southern Ocean, plays a crucial role in its climatic conditions. The oceanic influence moderates temperature extremes, evident in the all-time recorded maximum of 24.8°C (76.6°F) and a minimum of -12.1°C (10.2°F).
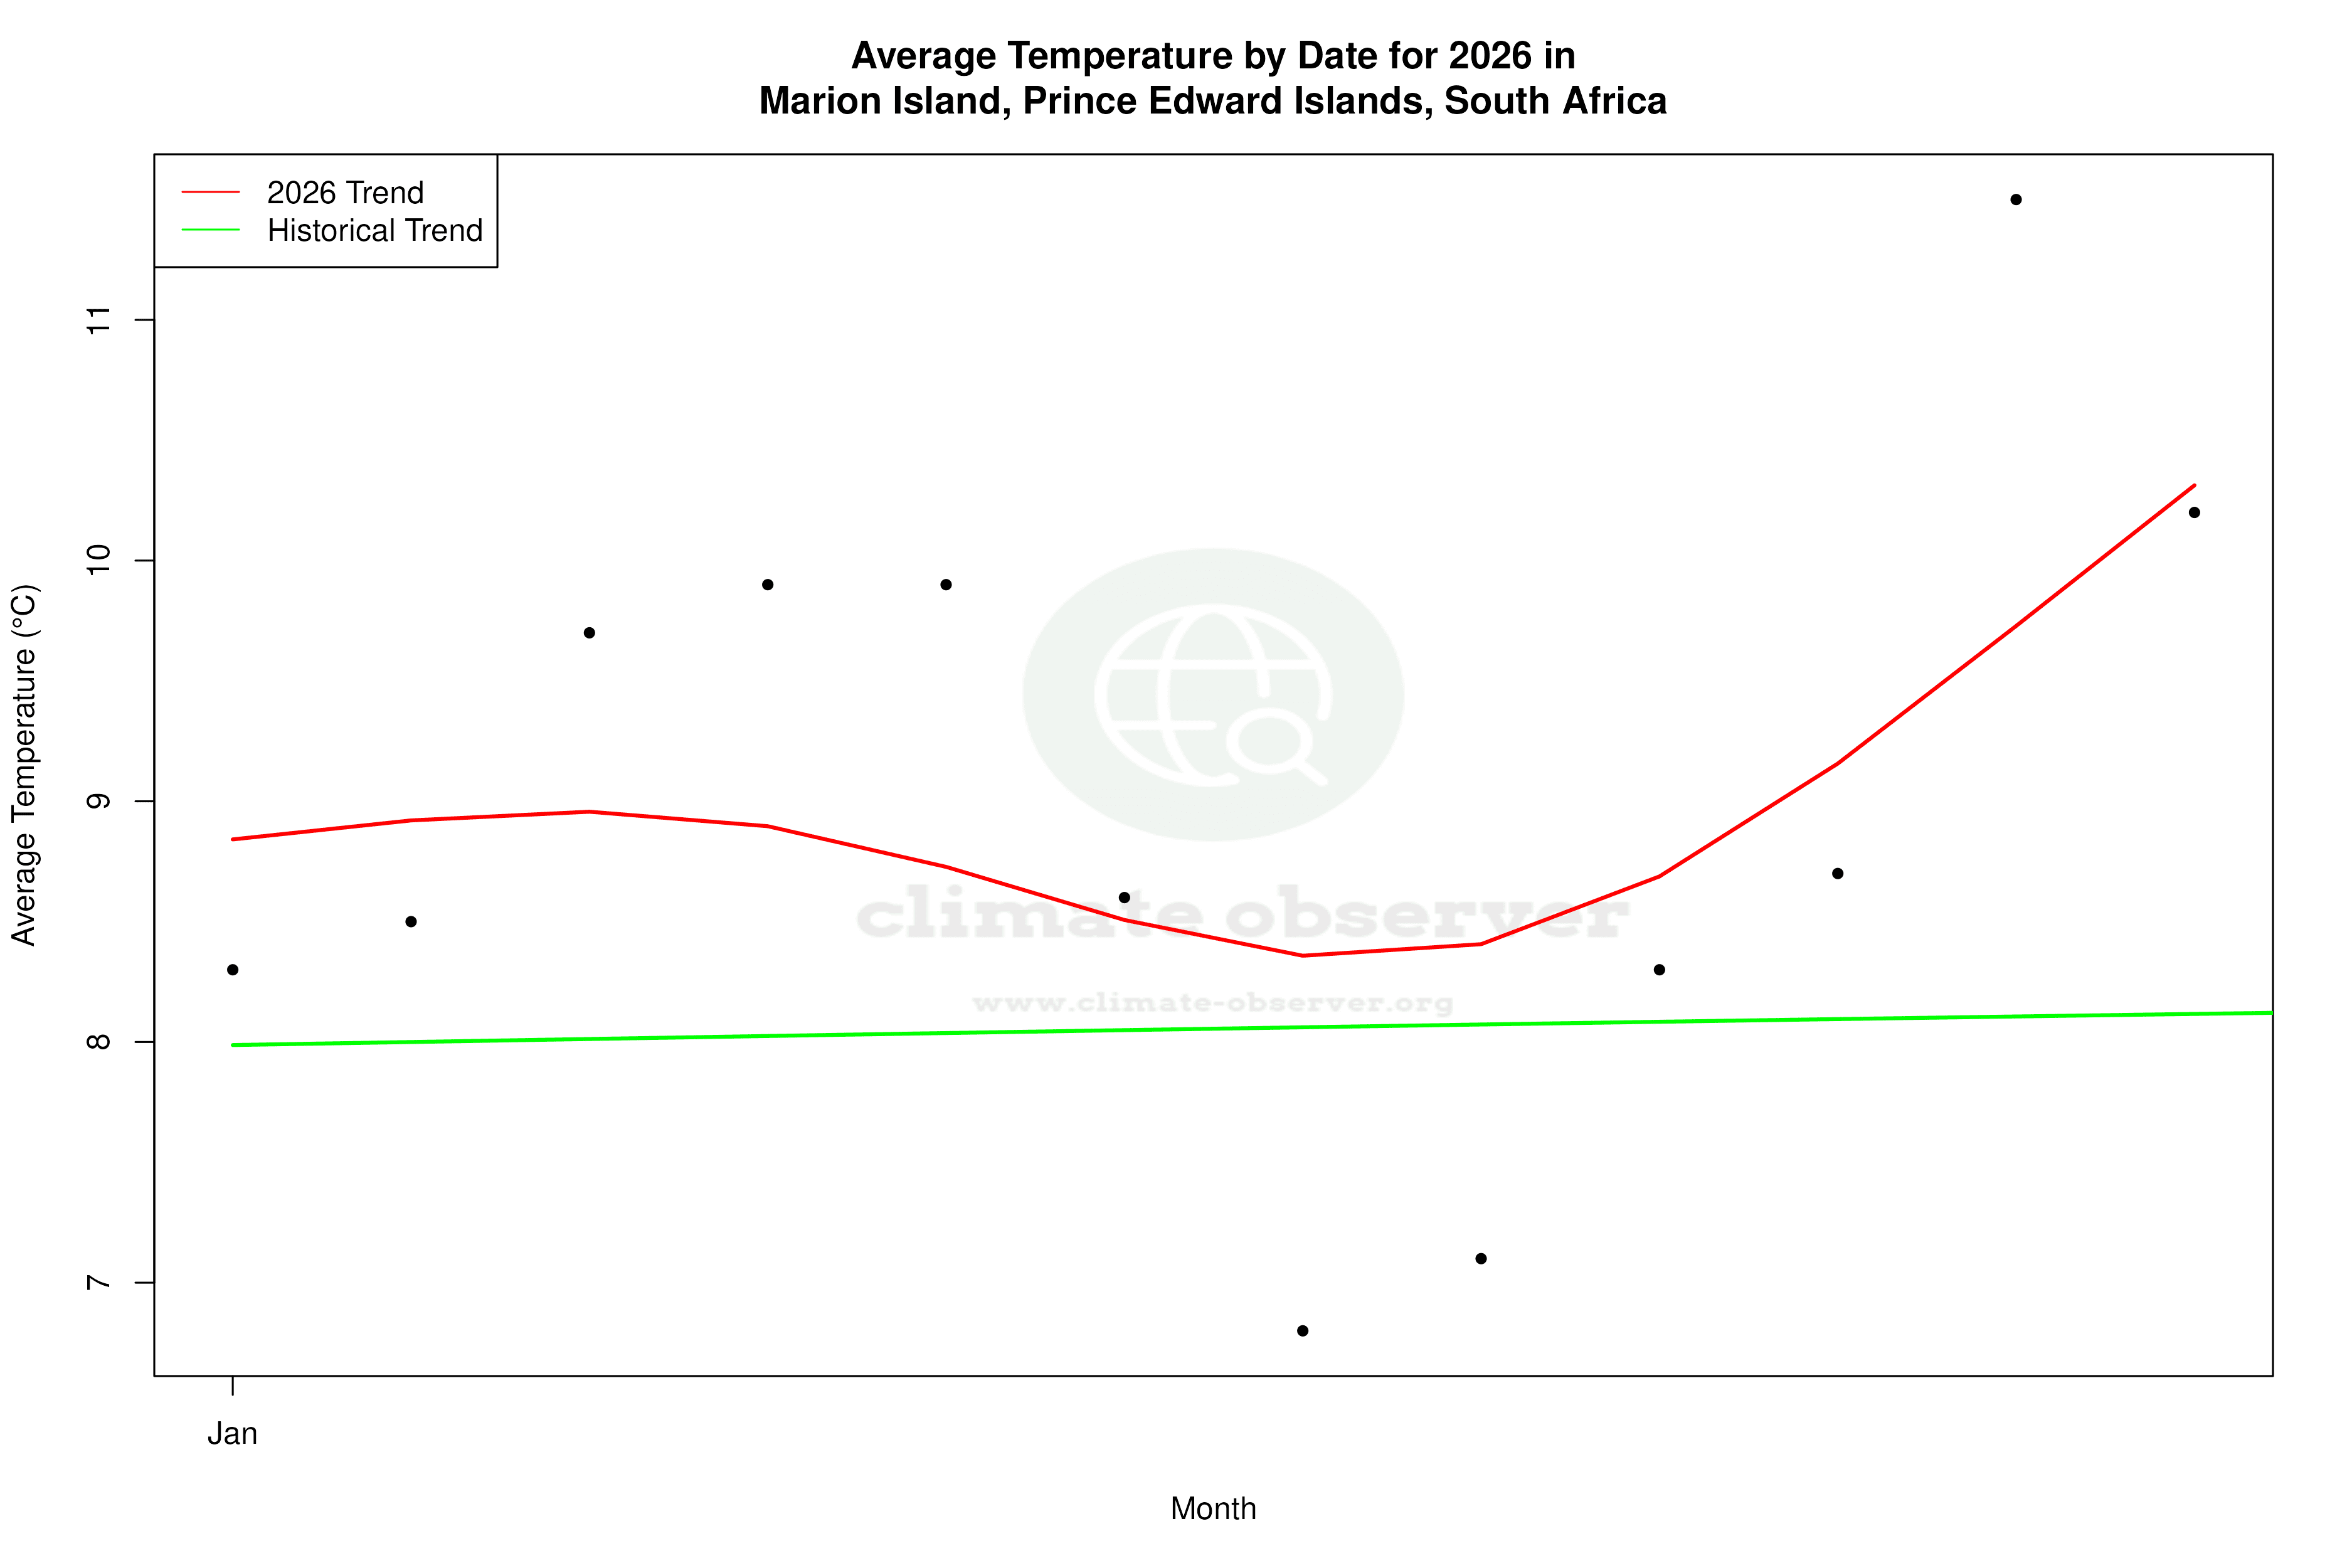
Temperature Trends: A Tale of Two Scales
Examining the temperature trends, Marion Island presents an interesting dichotomy. Over the past decade, the island has experienced a notable warming, with high temperatures rising by 1.56°C (2.81°F) and low temperatures by 0.79°C (1.42°F). In contrast, the all-time trend reveals a more modest warming, with highs increasing by 0.40°C (0.72°F) and lows by 0.04°C (0.07°F). This suggests that recent years have seen an acceleration in warming, possibly linked to broader regional climate shifts in the Southern Hemisphere.
Precipitation Patterns: Towards Even Distribution
The Precipitation Concentration Index (PCI) is a measure that indicates how precipitation is distributed over time. A lower PCI suggests more evenly distributed rainfall throughout the year. Marion Island's PCI has decreased from a baseline of 9.8 to a current value of 8.3, signifying a more even distribution of precipitation events. This marginal change could impact local ecosystems, potentially affecting water availability and soil moisture levels.
Regional Climate Implications
The warming trend on Marion Island aligns with South Africa's broader climate goals, which include monitoring and adapting to climate change impacts. The island's data provides valuable insights into subantarctic climate dynamics, which are crucial for understanding global climate patterns. The recent increase in temperature trends could have implications for the region's biodiversity, as warmer temperatures may affect native species and ecosystems.
Strategic Monitoring and Future Research
Given the island's unique position and climatic conditions, continued monitoring is essential. The recent trends highlight the importance of long-term data collection to understand the impacts of climate change in subantarctic regions. Future research could focus on the ecological consequences of these climatic shifts, particularly how changes in temperature and precipitation patterns affect the island's flora and fauna.
Station Statistics
10-Year Trend
High: +1.77 °F/decade
Low: +1.65 °F/decade
Rain: +0.040 in/decade
25-Year Trend
High: +0.57 °F/decade
Low: +0.50 °F/decade
Rain: +0.008 in/decade
50-Year Trend
High: +0.68 °F/decade
Low: -0.06 °F/decade
Rain: -0.015 in/decade
All-Time Trend
High: +0.69 °F/decade
Low: +0.09 °F/decade
Rain: -0.021 in/decade
Percentage Above-Average Days
Last 12 Months: 30.4%
This Year: 19.3%
Precipitation Concentration Index (PCI) ℹ️
Last 12 Months: 8.6
Historical Average: 9.4
Percentile Rank of Last 12 Months ℹ️
High: 55th percentile
Low: 90th percentile
Rain: 18th percentile
Change in Variance ℹ️
High: +8.4%
Low: +3.1%
Intraday: +20.4%
Data Coverage
80.9%
First Year of Data
1949
Station Location
Historical Weather Records
| Max High | Avg High | Min High | Max Avg | Avg Avg | Min Avg | Max Low | Avg Low | Min Low | Max Precipitation | Avg Precipitation | Max Snow | Avg Snow | |
|---|---|---|---|---|---|---|---|---|---|---|---|---|---|
| Record | 76.64 °F | — | 30.38 °F | 63.86 °F | — | 22.46 °F | 55.58 °F | — | 10.22 °F | 4.37 in | — | — | — |
| January | 76.64 °F | 52.45 °F | 40.82 °F | 63.86 °F | 46.68 °F | 37.58 °F | 52.52 °F | 40.85 °F | 26.42 °F | 3.90 in | 0.25 in | — | — |
| February | 73.22 °F | 53.27 °F | 40.10 °F | 59.18 °F | 47.38 °F | 36.14 °F | 55.40 °F | 41.83 °F | 29.48 °F | 4.37 in | 0.24 in | — | — |
| March | 73.04 °F | 52.18 °F | 40.10 °F | 63.50 °F | 46.43 °F | 36.32 °F | 55.58 °F | 41.00 °F | 27.50 °F | 3.86 in | 0.24 in | — | — |
| April | 74.12 °F | 49.85 °F | 35.60 °F | 60.44 °F | 44.58 °F | 34.88 °F | 55.22 °F | 39.09 °F | 28.04 °F | 3.86 in | 0.25 in | — | — |
| May | 66.92 °F | 47.50 °F | 34.52 °F | 59.18 °F | 42.50 °F | 32.72 °F | 50.90 °F | 37.17 °F | 23.18 °F | 3.19 in | 0.24 in | — | — |
| June | 64.76 °F | 45.85 °F | 31.28 °F | 51.44 °F | 40.85 °F | 28.76 °F | 48.02 °F | 35.82 °F | 12.38 °F | 2.76 in | 0.24 in | — | — |
| July | 65.48 °F | 44.99 °F | 32.00 °F | 55.76 °F | 40.22 °F | 28.58 °F | 48.20 °F | 35.02 °F | 21.20 °F | 2.80 in | 0.22 in | — | — |
| August | 61.70 °F | 44.46 °F | 31.10 °F | 49.82 °F | 39.60 °F | 29.48 °F | 48.38 °F | 34.27 °F | 22.10 °F | 2.20 in | 0.21 in | — | — |
| September | 65.48 °F | 44.83 °F | 30.38 °F | 51.26 °F | 39.70 °F | 22.46 °F | 49.10 °F | 34.48 °F | 10.22 °F | 3.90 in | 0.22 in | — | — |
| October | 67.10 °F | 46.82 °F | 32.18 °F | 53.96 °F | 41.16 °F | 30.92 °F | 47.66 °F | 35.87 °F | 18.68 °F | 3.90 in | 0.21 in | — | — |
| November | 68.18 °F | 49.01 °F | 36.68 °F | 55.76 °F | 42.94 °F | 33.62 °F | 48.20 °F | 37.30 °F | 24.98 °F | 3.90 in | 0.21 in | — | — |
| December | 73.22 °F | 50.78 °F | 38.66 °F | 57.74 °F | 44.80 °F | 34.34 °F | 51.26 °F | 39.13 °F | 29.30 °F | 3.70 in | 0.24 in | — | — |
Data Visualisations
Remove WatermarksCurrent Year Climate Trends vs Historical


Max Temperature this Year | 1 of 6
Climate 12-Month Moving Averages


Max Temperature 12-Month MA | 1 of 6
Daily Data Points and Averages Throughout the Year


Average Max Temperature Throughout Year | 1 of 5