Climate for Station: Calvinia, Northern Cape, South Africa
Loading live weather...
Climate Analysis & Overview
Calvinia, nestled in the Northern Cape of South Africa, is experiencing a nuanced climate shift. While long-term trends indicate a slight warming in maximum temperatures, recent decades show a cooling pattern. Precipitation is becoming more evenly distributed, reflecting a changing climate dynamic in this semi-arid region.
Climate Classification and Geographic Influence
Calvinia is classified under the Köppen climate system as having a semi-arid climate (BSh), characterized by hot summers and mild to cool winters. The town is situated in the Hantam Local Municipality, surrounded by the Hantam Mountains, which influence local weather patterns by moderating temperature extremes and affecting precipitation distribution. The region's geography plays a crucial role in shaping its climatic conditions, with the mountains acting as barriers to moisture-laden winds, resulting in limited rainfall.
Temperature Trends: A Tale of Two Timelines
The all-time temperature trends in Calvinia reveal a warming pattern for highs, with an increase of 0.46°C (0.83°F). This suggests a gradual rise in maximum temperatures over the long term. However, the past decade paints a different picture, with a cooling trend of -1.14°C (-2.05°F) in high temperatures. This recent cooling could be attributed to various factors, including changes in atmospheric circulation patterns or increased cloud cover. Meanwhile, low temperatures show a minimal long-term decrease of -0.02°C (-0.04°F), while the last decade has seen a more noticeable cooling of -0.35°C (-0.63°F).
Precipitation Patterns: A Shift Towards Even Distribution
The Precipitation Concentration Index (PCI) for Calvinia has decreased from a baseline of 17.64 to a current value of 14.83. This indicates a shift towards a more even distribution of rainfall throughout the year, as opposed to being concentrated in fewer, more intense events. Such a change can have significant implications for agriculture and water resource management in the region, potentially aiding in more consistent water supply and reducing the risk of drought.
Extreme Weather Records
Calvinia's climate extremes are marked by a record high temperature of 41.9°C (107.4°F) and a record low of -9.0°C (15.8°F). These records highlight the region's capacity for significant temperature variability, a characteristic feature of semi-arid climates. The wide range between maximum and minimum temperatures underscores the importance of understanding local climate dynamics in the context of broader regional patterns.
Regional Climate Goals and Recent Developments
South Africa's commitment to addressing climate change is evident in its national climate goals, which aim to reduce greenhouse gas emissions and enhance resilience to climate impacts. In this context, the observed trends in Calvinia provide valuable insights into local climate dynamics and their alignment with broader regional objectives. Recent weather events, such as unseasonal rainfall or temperature anomalies, further underscore the need for adaptive strategies to mitigate potential impacts on agriculture and water resources.
Station Statistics
10-Year Trend
High: -3.12 °F/decade
Low: -0.62 °F/decade
Rain: +0.009 in/decade
25-Year Trend
High: +0.39 °F/decade
Low: +0.37 °F/decade
Rain: +0.001 in/decade
50-Year Trend
High: +1.21 °F/decade
Low: -0.02 °F/decade
Rain: +0.000 in/decade
All-Time Trend
High: +0.86 °F/decade
Low: -0.00 °F/decade
Rain: -0.000 in/decade
Percentage Above-Average Days
Last 12 Months: 52.5%
This Year: 48.3%
Precipitation Concentration Index (PCI) ℹ️
Last 12 Months: 15.2
Historical Average: 17.0
Percentile Rank of Last 12 Months ℹ️
High: 72nd percentile
Low: 88th percentile
Rain: 59th percentile
Change in Variance ℹ️
High: -8.7%
Low: +6.5%
Intraday: -20.2%
Data Coverage
59.7%
First Year of Data
1905
Station Location
Historical Weather Records
| Max High | Avg High | Min High | Max Avg | Avg Avg | Min Avg | Max Low | Avg Low | Min Low | Max Precipitation | Avg Precipitation | Max Snow | Avg Snow | |
|---|---|---|---|---|---|---|---|---|---|---|---|---|---|
| Record | 107.42 °F | — | 39.20 °F | 93.20 °F | — | 32.36 °F | 81.50 °F | — | 15.80 °F | 3.39 in | — | — | — |
| January | 107.42 °F | 89.88 °F | 61.34 °F | 93.20 °F | 73.81 °F | 49.64 °F | 81.50 °F | 56.71 °F | 32.00 °F | 2.13 in | 0.01 in | — | — |
| February | 105.98 °F | 89.64 °F | 57.02 °F | 89.60 °F | 73.59 °F | 52.88 °F | 78.26 °F | 57.16 °F | 37.04 °F | 2.40 in | 0.02 in | — | — |
| March | 104.00 °F | 86.03 °F | 51.87 °F | 89.42 °F | 69.54 °F | 44.78 °F | 76.64 °F | 54.35 °F | 34.88 °F | 3.39 in | 0.03 in | — | — |
| April | 97.52 °F | 78.19 °F | 47.84 °F | 85.46 °F | 62.45 °F | 42.04 °F | 73.04 °F | 48.91 °F | 26.96 °F | 2.20 in | 0.02 in | — | — |
| May | 91.58 °F | 70.70 °F | 44.96 °F | 79.88 °F | 55.75 °F | 37.76 °F | 70.70 °F | 43.16 °F | 15.80 °F | 2.13 in | 0.03 in | — | — |
| June | 83.12 °F | 64.19 °F | 39.92 °F | 69.98 °F | 49.98 °F | 32.54 °F | 64.94 °F | 39.33 °F | 20.30 °F | 1.55 in | 0.04 in | — | — |
| July | 84.56 °F | 63.94 °F | 39.20 °F | 70.52 °F | 49.03 °F | 32.36 °F | 64.58 °F | 38.04 °F | 19.40 °F | 2.09 in | 0.03 in | — | — |
| August | 91.04 °F | 66.31 °F | 41.90 °F | 78.26 °F | 50.62 °F | 35.60 °F | 67.64 °F | 38.04 °F | 21.92 °F | 1.65 in | 0.03 in | — | — |
| September | 97.34 °F | 72.20 °F | 44.78 °F | 80.24 °F | 55.56 °F | 37.04 °F | 72.50 °F | 41.03 °F | 23.72 °F | 2.83 in | 0.02 in | — | — |
| October | 104.90 °F | 78.15 °F | 49.10 °F | 87.80 °F | 61.86 °F | 40.10 °F | 73.76 °F | 45.98 °F | 25.88 °F | 1.11 in | 0.01 in | — | — |
| November | 106.16 °F | 82.95 °F | 48.20 °F | 89.01 °F | 66.54 °F | 44.60 °F | 77.00 °F | 50.38 °F | 25.70 °F | 2.01 in | 0.02 in | — | — |
| December | 104.54 °F | 86.87 °F | 55.76 °F | 89.24 °F | 70.38 °F | 49.28 °F | 75.20 °F | 54.04 °F | 32.72 °F | 2.81 in | 0.01 in | — | — |
Data Visualisations
Remove WatermarksCurrent Year Climate Trends vs Historical


Max Temperature this Year | 1 of 6
Climate 12-Month Moving Averages


Max Temperature 12-Month MA | 1 of 6
Daily Data Points and Averages Throughout the Year

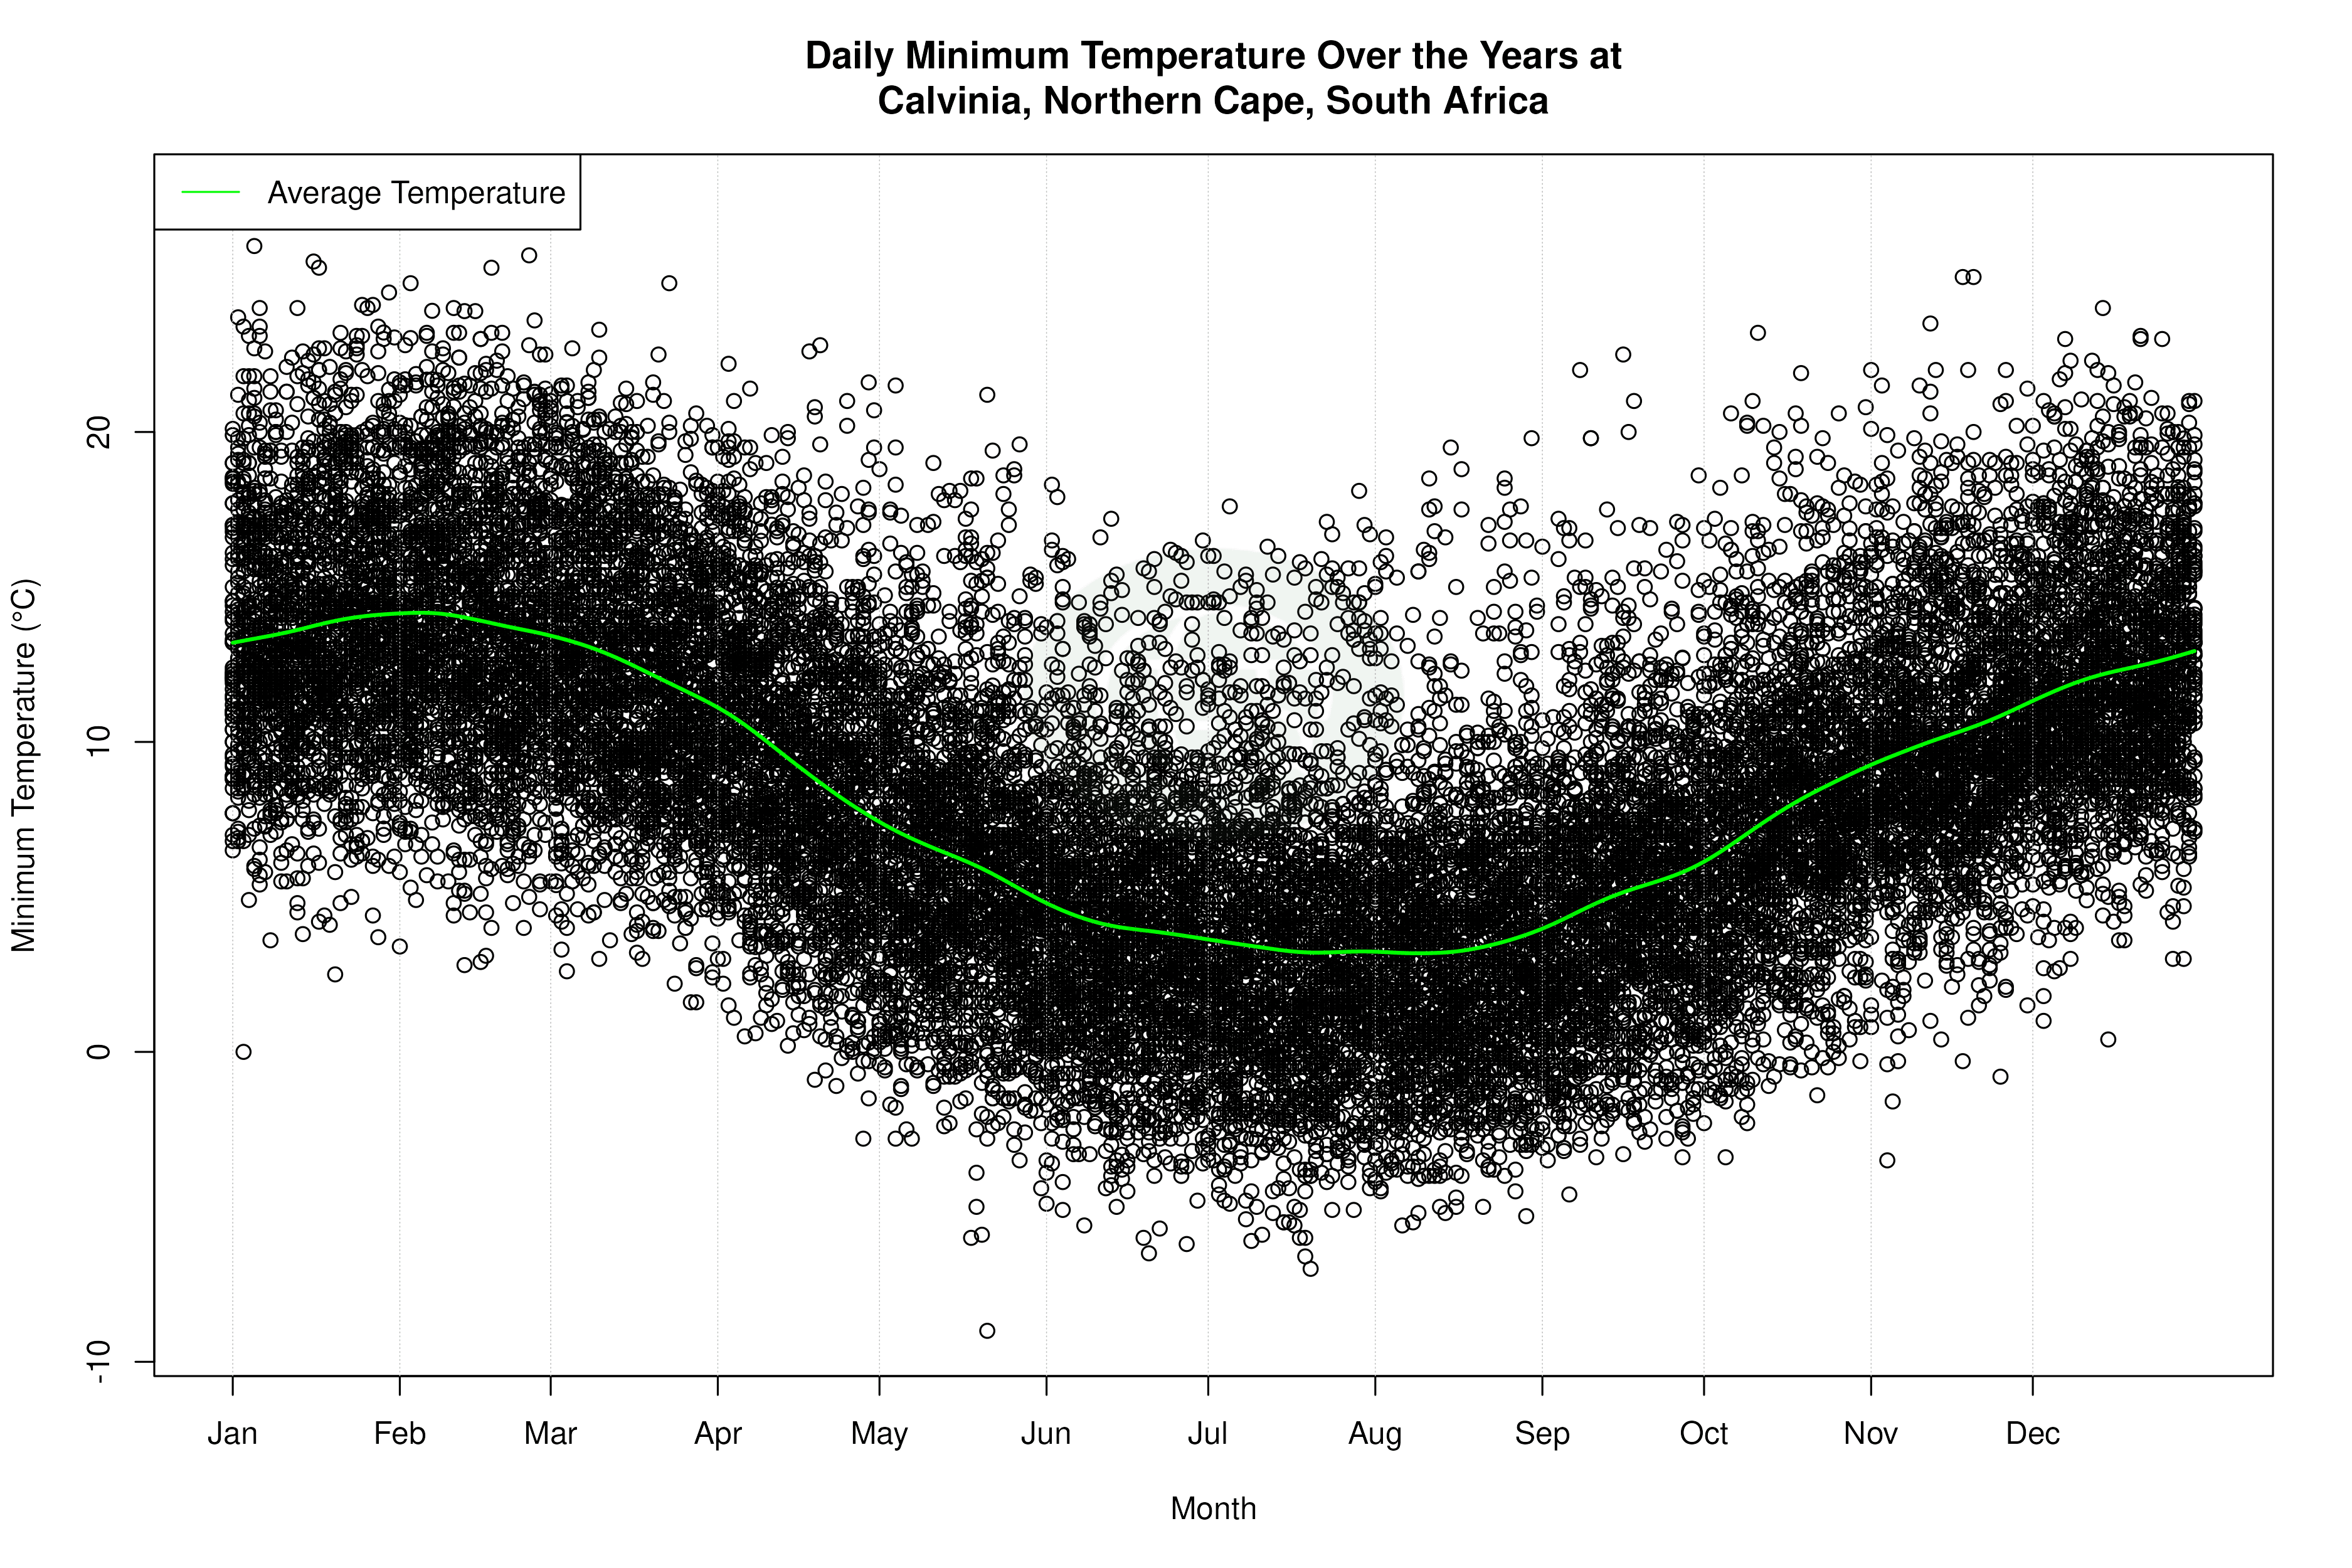

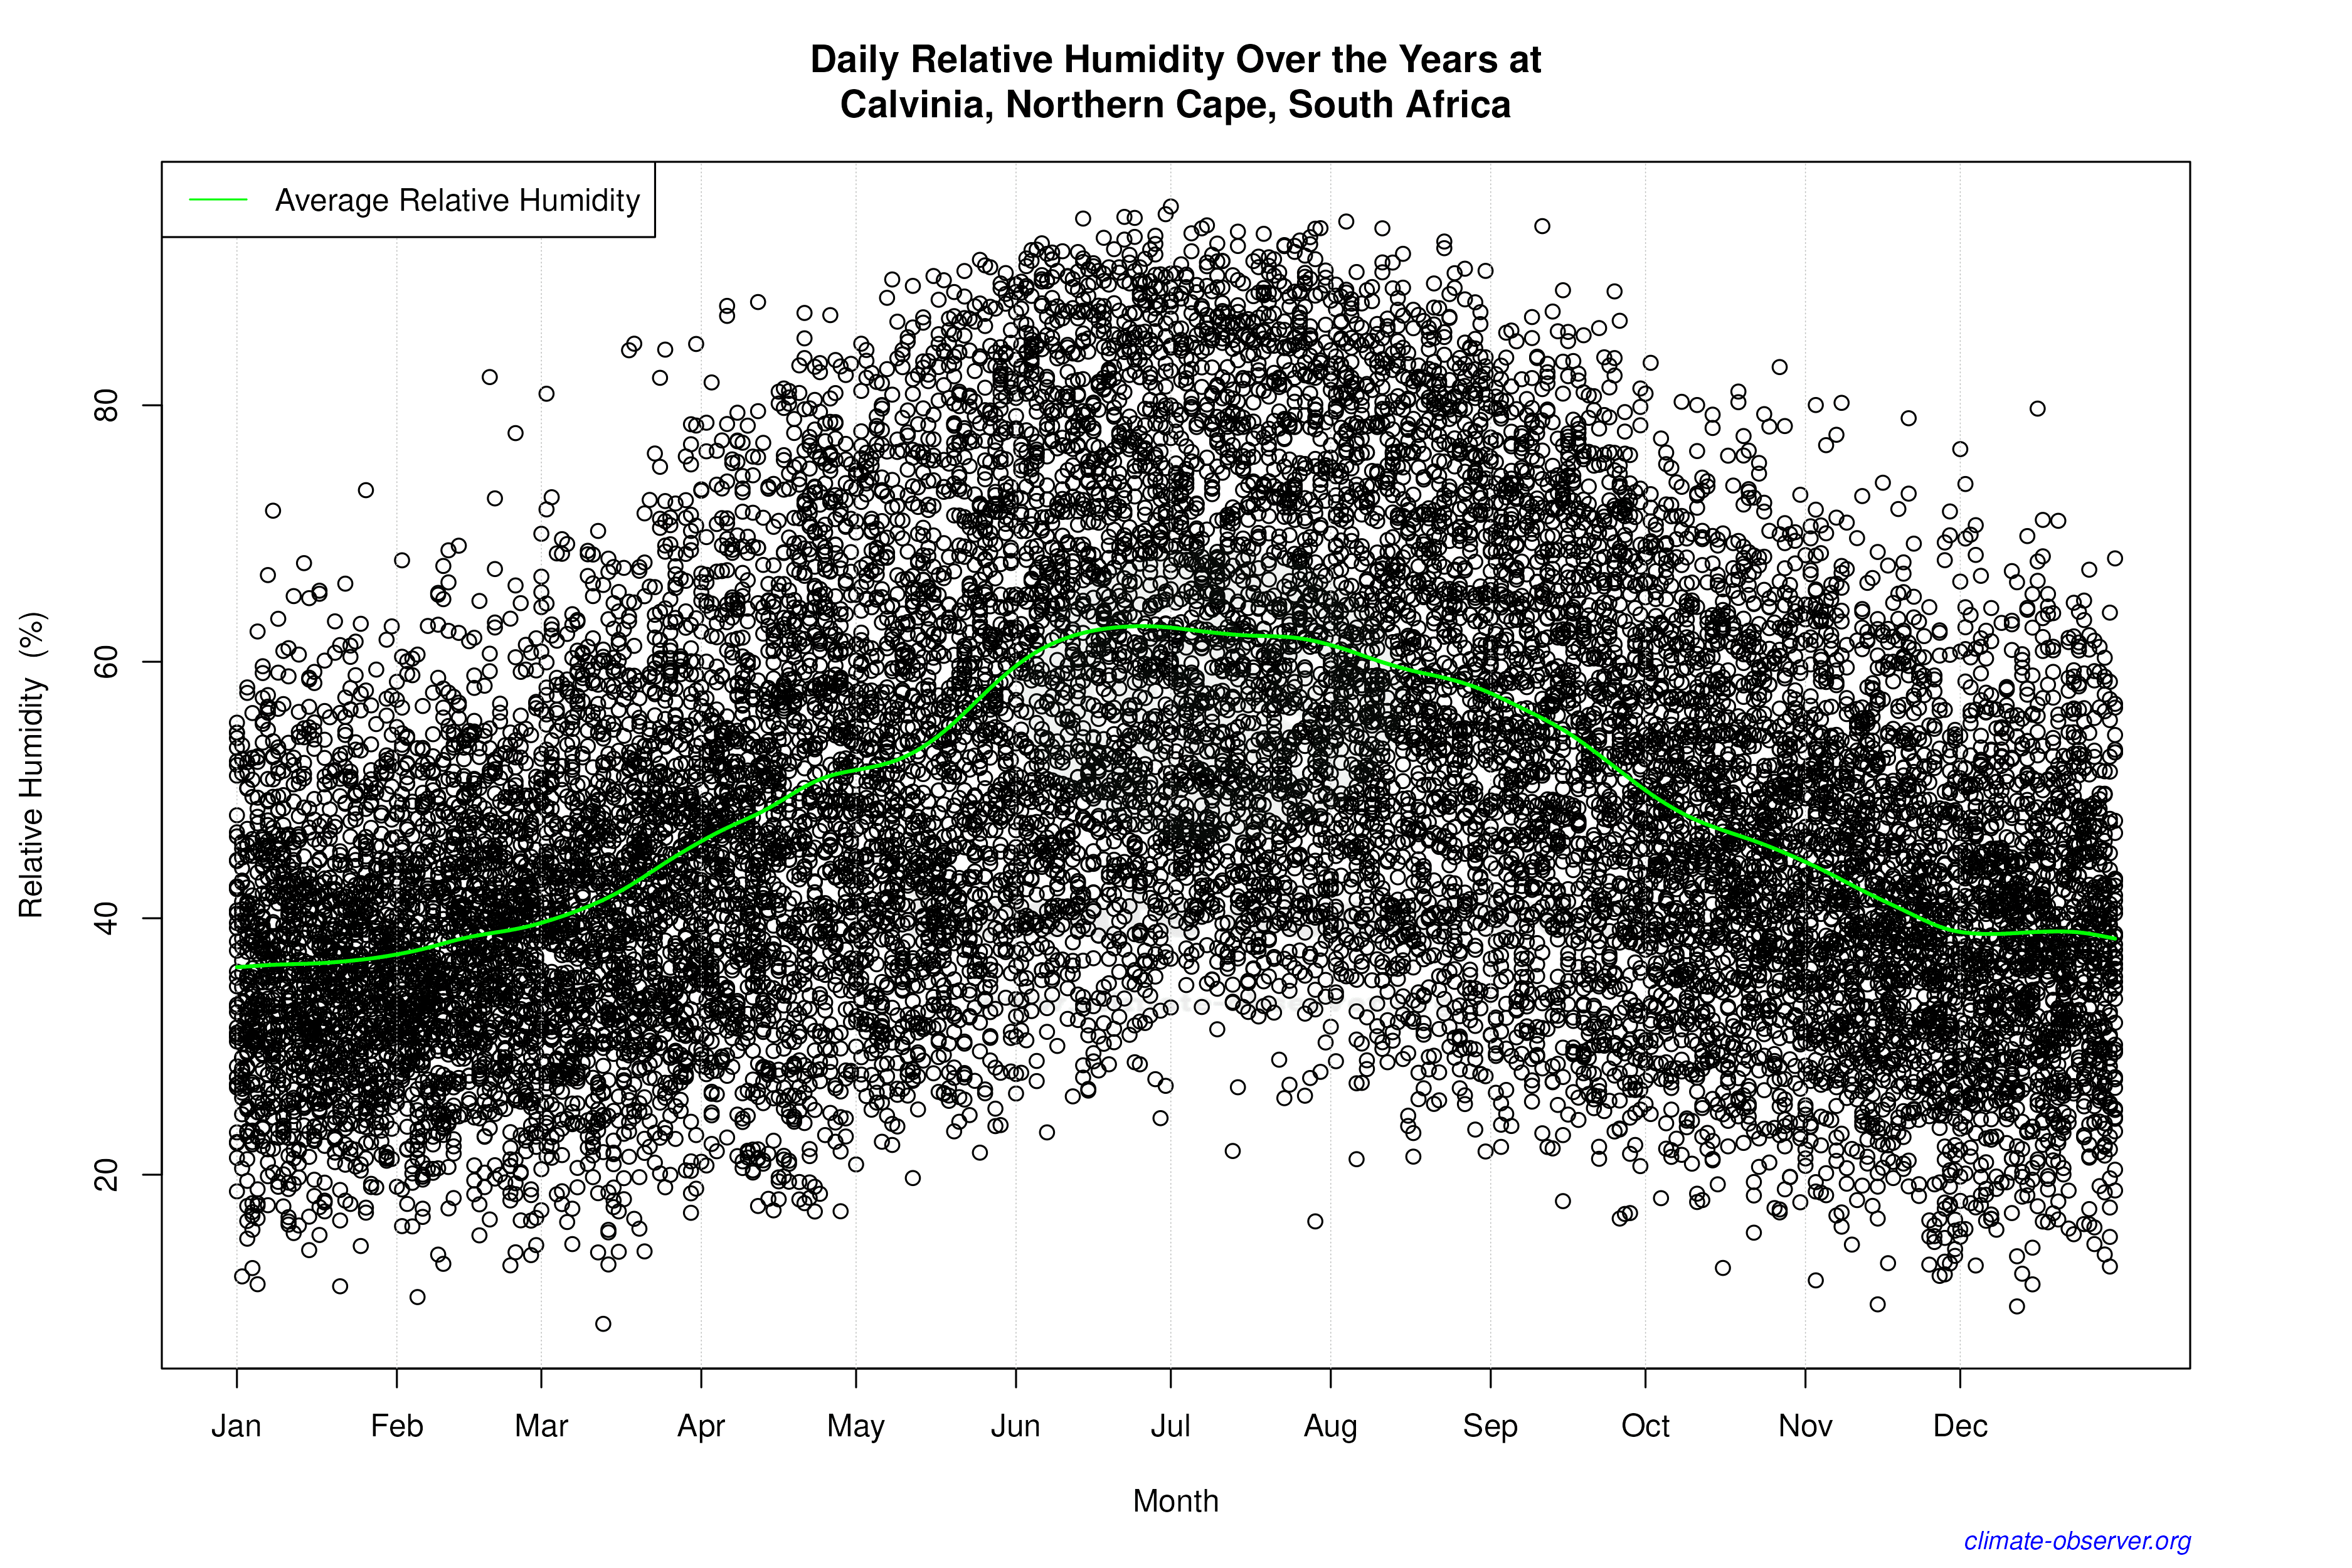

Average Max Temperature Throughout Year | 1 of 5
