Climate for Station: Podor, Saint-Louis, Senegal
Loading live weather...
Climate Analysis & Overview
Podor, situated in the northern reaches of Senegal, is experiencing a warming trend with notable increases in both high and low temperatures over the past decade. The Precipitation Concentration Index suggests a shift towards more evenly distributed rainfall, which may impact local agriculture and water management strategies.
Desert Climate Dynamics
Podor is located in a region classified under the Köppen climate system as a hot desert climate (BWh). This classification is characterised by extremely high temperatures and minimal rainfall. The local geography, with its flat terrain and proximity to the Senegal River, influences the climatic conditions, contributing to the area's arid environment. Over the past decade, Podor has experienced a significant warming trend, with high temperatures rising by 0.90°C (1.62°F) and low temperatures by 0.65°C (1.17°F). This recent trend is more pronounced than the all-time warming, where highs have increased by 0.24°C (0.43°F) and lows by 0.26°C (0.47°F).
Temperature Extremes
The station at Podor has recorded extreme temperatures, with a maximum reaching 53.5°C (128.3°F) and a minimum of 6.1°C (43.0°F). These extremes highlight the region's susceptibility to intense heat, which poses challenges for both human habitation and ecological sustainability. The warming trends observed are critical as they can exacerbate heat-related issues, impacting health and agricultural productivity.
Precipitation Patterns
The Precipitation Concentration Index (PCI) for Podor has decreased from a baseline of 33.6 to a current value of 29.3. This indicates a shift towards more evenly distributed rainfall events. In regions like Podor, where water scarcity is a significant concern, such a change can have profound implications for water resource management and agricultural planning. The decrease in PCI suggests that rainfall events, while still infrequent, may be spreading more evenly throughout the year, potentially offering a more reliable water supply for crops.
Regional Climate Goals
Senegal has been actively pursuing climate resilience strategies, focusing on sustainable water management and agricultural adaptation to climate change. The observed trends in Podor align with these national goals, providing a critical data point for understanding regional climate dynamics. The warming trends, coupled with changes in precipitation distribution, underscore the importance of integrating climate data into policy-making to enhance the region's adaptive capacity.
Implications for the Future
The climate data from Podor serves as an essential indicator of broader regional trends. The warming temperatures and shifts in precipitation patterns could have far-reaching impacts on local communities, ecosystems, and economic activities. As Senegal continues to navigate the challenges posed by climate change, understanding these localised trends will be crucial in developing effective adaptation and mitigation strategies.
Station Statistics
10-Year Trend
High: +0.18 °F/decade
Low: -0.23 °F/decade
Rain: -0.016 in/decade
25-Year Trend
High: +0.50 °F/decade
Low: +0.17 °F/decade
Rain: -0.004 in/decade
50-Year Trend
High: +0.44 °F/decade
Low: +0.22 °F/decade
Rain: +0.002 in/decade
All-Time Trend
High: +0.42 °F/decade
Low: +0.45 °F/decade
Rain: +0.000 in/decade
Percentage Above-Average Days
Last 12 Months: 57.2%
This Year: 56.4%
Precipitation Concentration Index (PCI) ℹ️
Last 12 Months: 35.8
Historical Average: 35.5
Percentile Rank of Last 12 Months ℹ️
High: 56th percentile
Low: 61st percentile
Rain: 43rd percentile
Change in Variance ℹ️
High: -12.2%
Low: -12.5%
Intraday: -21.0%
Data Coverage
46.6%
First Year of Data
1857
Station Location
Historical Weather Records
| Max High | Avg High | Min High | Max Avg | Avg Avg | Min Avg | Max Low | Avg Low | Min Low | Max Precipitation | Avg Precipitation | Max Snow | Avg Snow | |
|---|---|---|---|---|---|---|---|---|---|---|---|---|---|
| Record | 128.30 °F | — | 58.64 °F | 108.68 °F | — | 59.36 °F | 96.08 °F | — | 42.98 °F | 5.24 in | — | — | — |
| January | 104.54 °F | 88.37 °F | 67.64 °F | 93.20 °F | 75.10 °F | 59.36 °F | 75.56 °F | 59.99 °F | 42.98 °F | 0.70 in | 0.00 in | — | — |
| February | 109.40 °F | 93.01 °F | 58.64 °F | 95.54 °F | 79.04 °F | 64.40 °F | 79.88 °F | 63.32 °F | 48.02 °F | 0.83 in | 0.00 in | — | — |
| March | 121.10 °F | 98.26 °F | 70.16 °F | 101.30 °F | 83.58 °F | 62.96 °F | 86.36 °F | 67.02 °F | 51.80 °F | 0.68 in | 0.00 in | — | — |
| April | 120.20 °F | 103.04 °F | 82.04 °F | 108.68 °F | 88.31 °F | 73.22 °F | 89.96 °F | 70.94 °F | 53.42 °F | 0.11 in | 0.00 in | — | — |
| May | 118.22 °F | 106.48 °F | 87.80 °F | 106.16 °F | 91.65 °F | 73.04 °F | 93.20 °F | 74.67 °F | 59.36 °F | 2.13 in | 0.00 in | — | — |
| June | 128.30 °F | 105.72 °F | 82.76 °F | 107.24 °F | 91.16 °F | 73.76 °F | 95.36 °F | 76.16 °F | 60.80 °F | 4.72 in | 0.02 in | — | — |
| July | 116.06 °F | 99.99 °F | 78.80 °F | 103.64 °F | 88.50 °F | 71.78 °F | 89.96 °F | 76.56 °F | 66.56 °F | 4.06 in | 0.08 in | — | — |
| August | 114.80 °F | 97.18 °F | 80.96 °F | 100.94 °F | 87.81 °F | 75.56 °F | 87.26 °F | 77.05 °F | 62.60 °F | 5.24 in | 0.15 in | — | — |
| September | 113.00 °F | 97.72 °F | 78.62 °F | 98.96 °F | 88.40 °F | 75.92 °F | 87.80 °F | 77.44 °F | 62.96 °F | 4.02 in | 0.11 in | — | — |
| October | 122.00 °F | 100.36 °F | 76.82 °F | 100.22 °F | 89.54 °F | 76.46 °F | 96.08 °F | 76.40 °F | 62.60 °F | 2.17 in | 0.02 in | — | — |
| November | 112.10 °F | 96.11 °F | 74.48 °F | 95.36 °F | 83.87 °F | 68.00 °F | 82.40 °F | 69.56 °F | 53.60 °F | 1.22 in | 0.00 in | — | — |
| December | 106.70 °F | 89.58 °F | 66.20 °F | 91.22 °F | 77.12 °F | 62.33 °F | 78.98 °F | 62.45 °F | 45.50 °F | 0.59 in | 0.00 in | — | — |
Data Visualisations
Remove WatermarksCurrent Year Climate Trends vs Historical
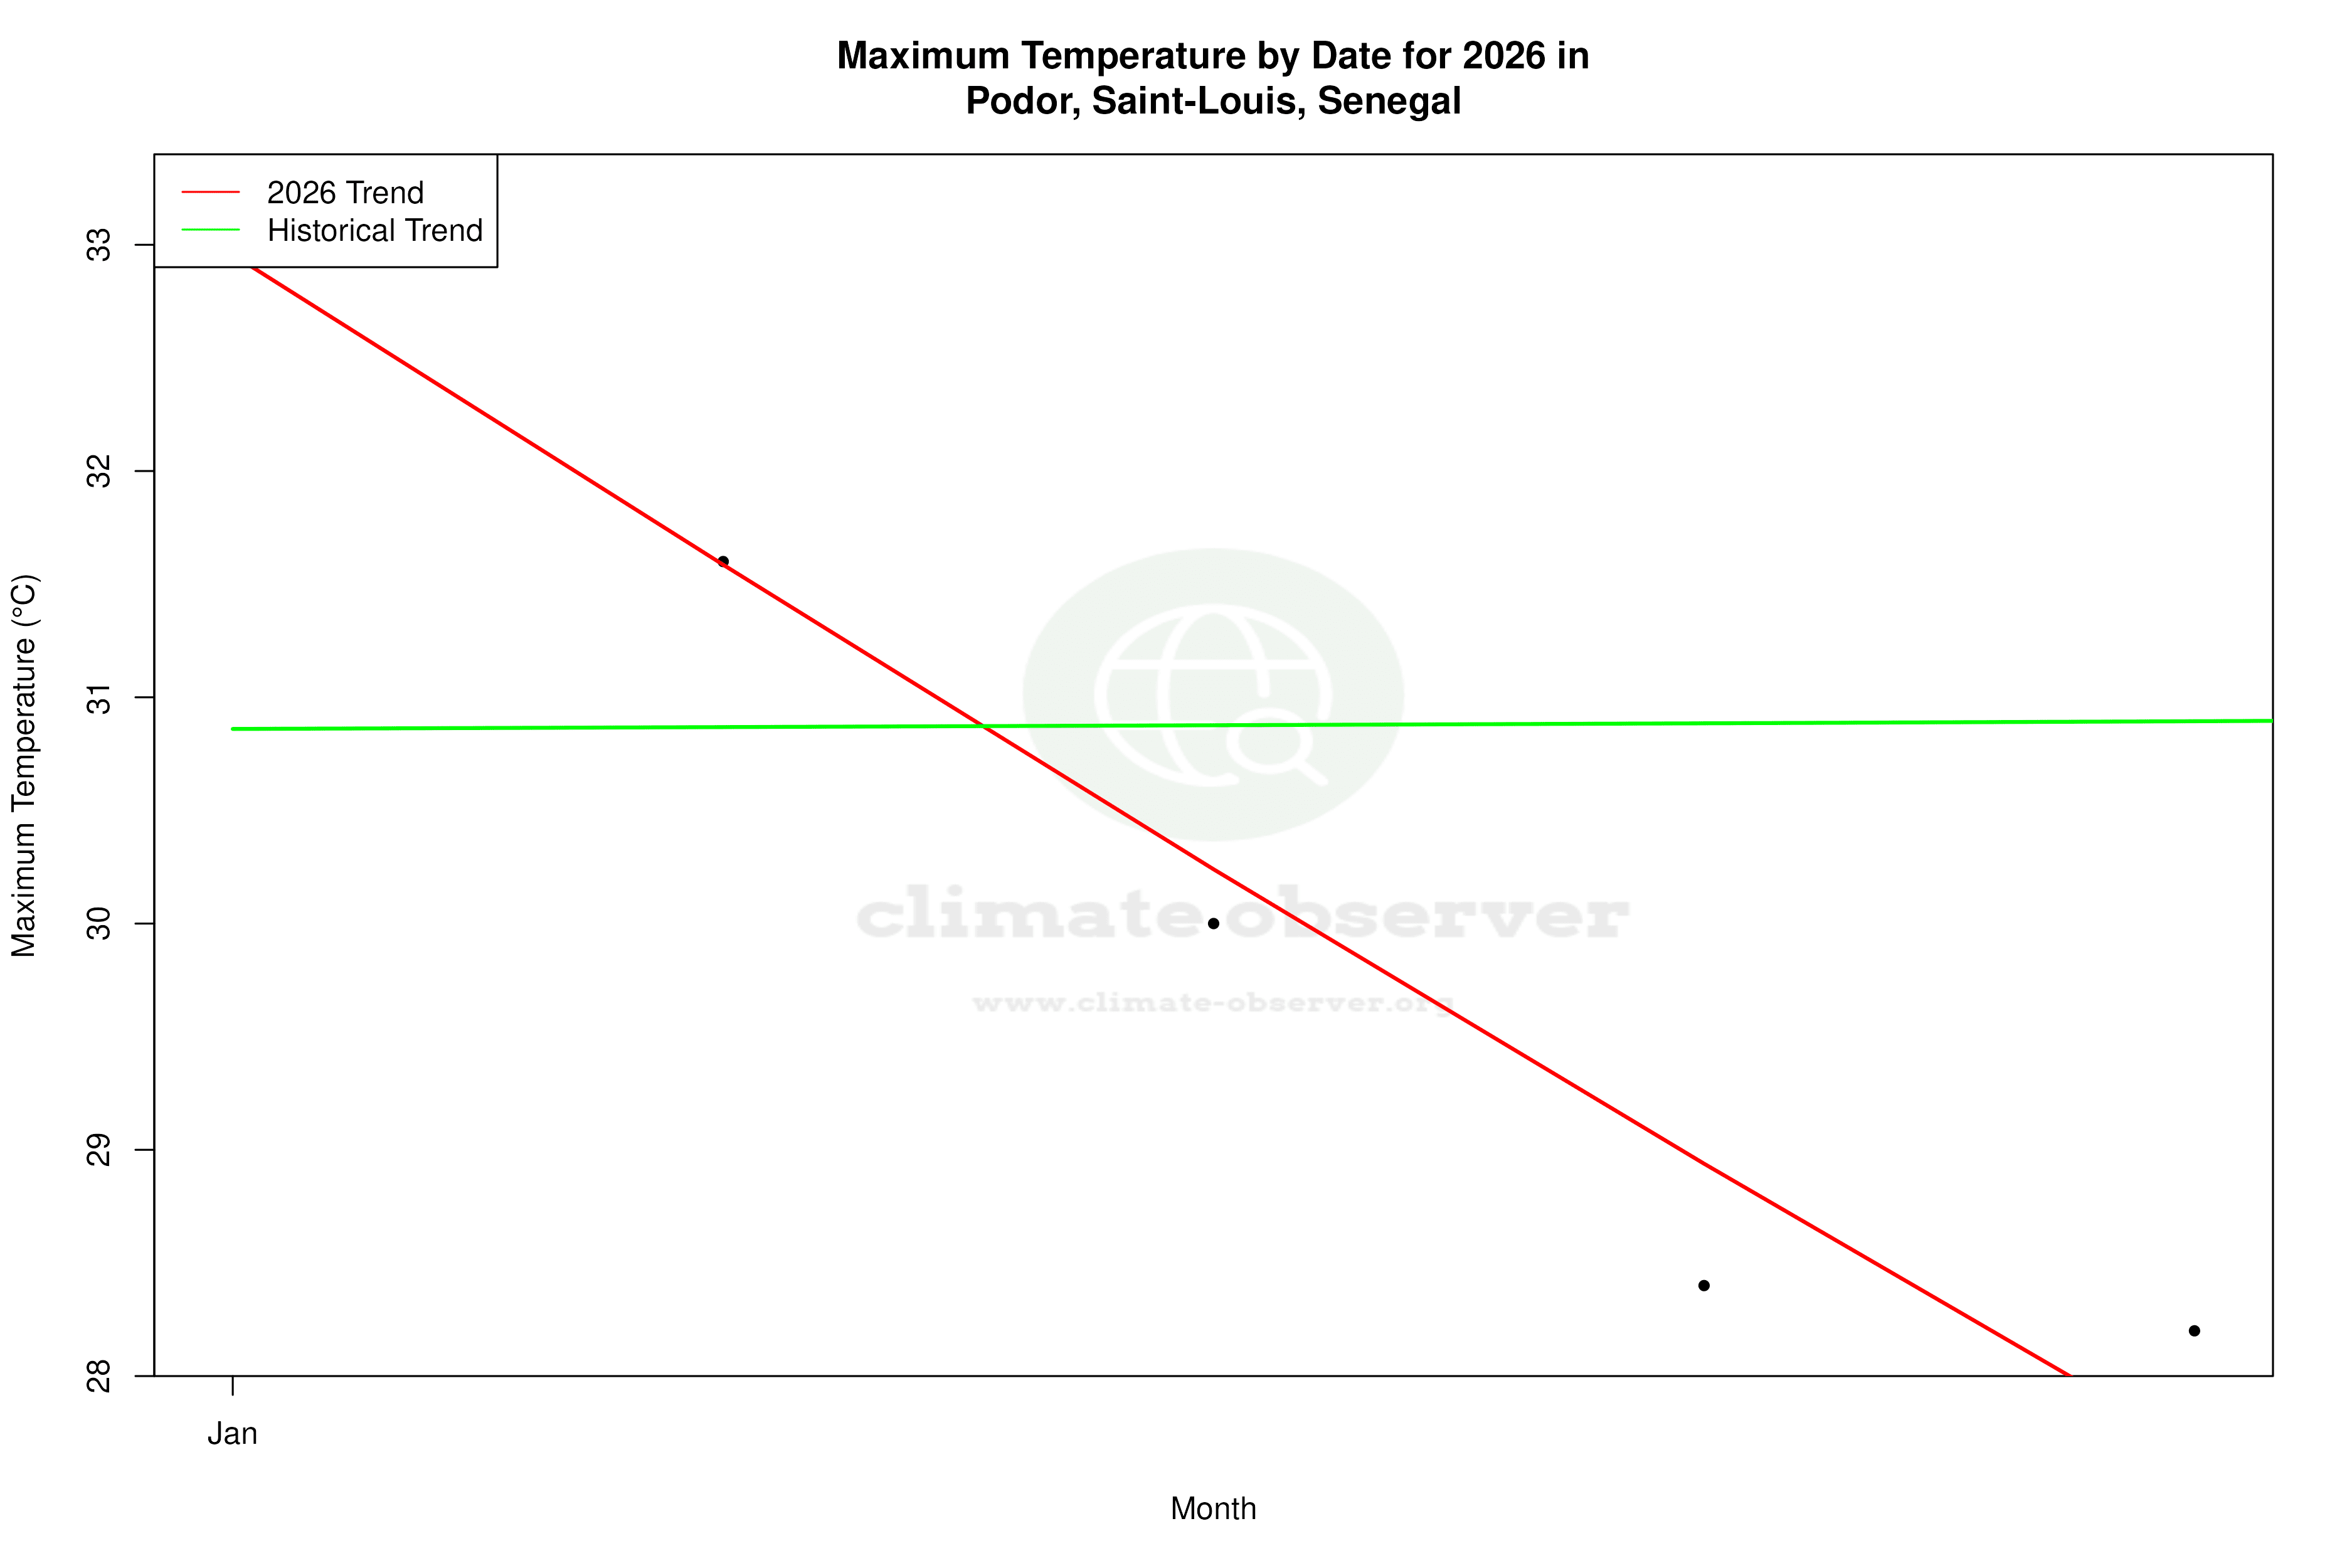


Max Temperature this Year | 1 of 6
Climate 12-Month Moving Averages


Max Temperature 12-Month MA | 1 of 6
Daily Data Points and Averages Throughout the Year


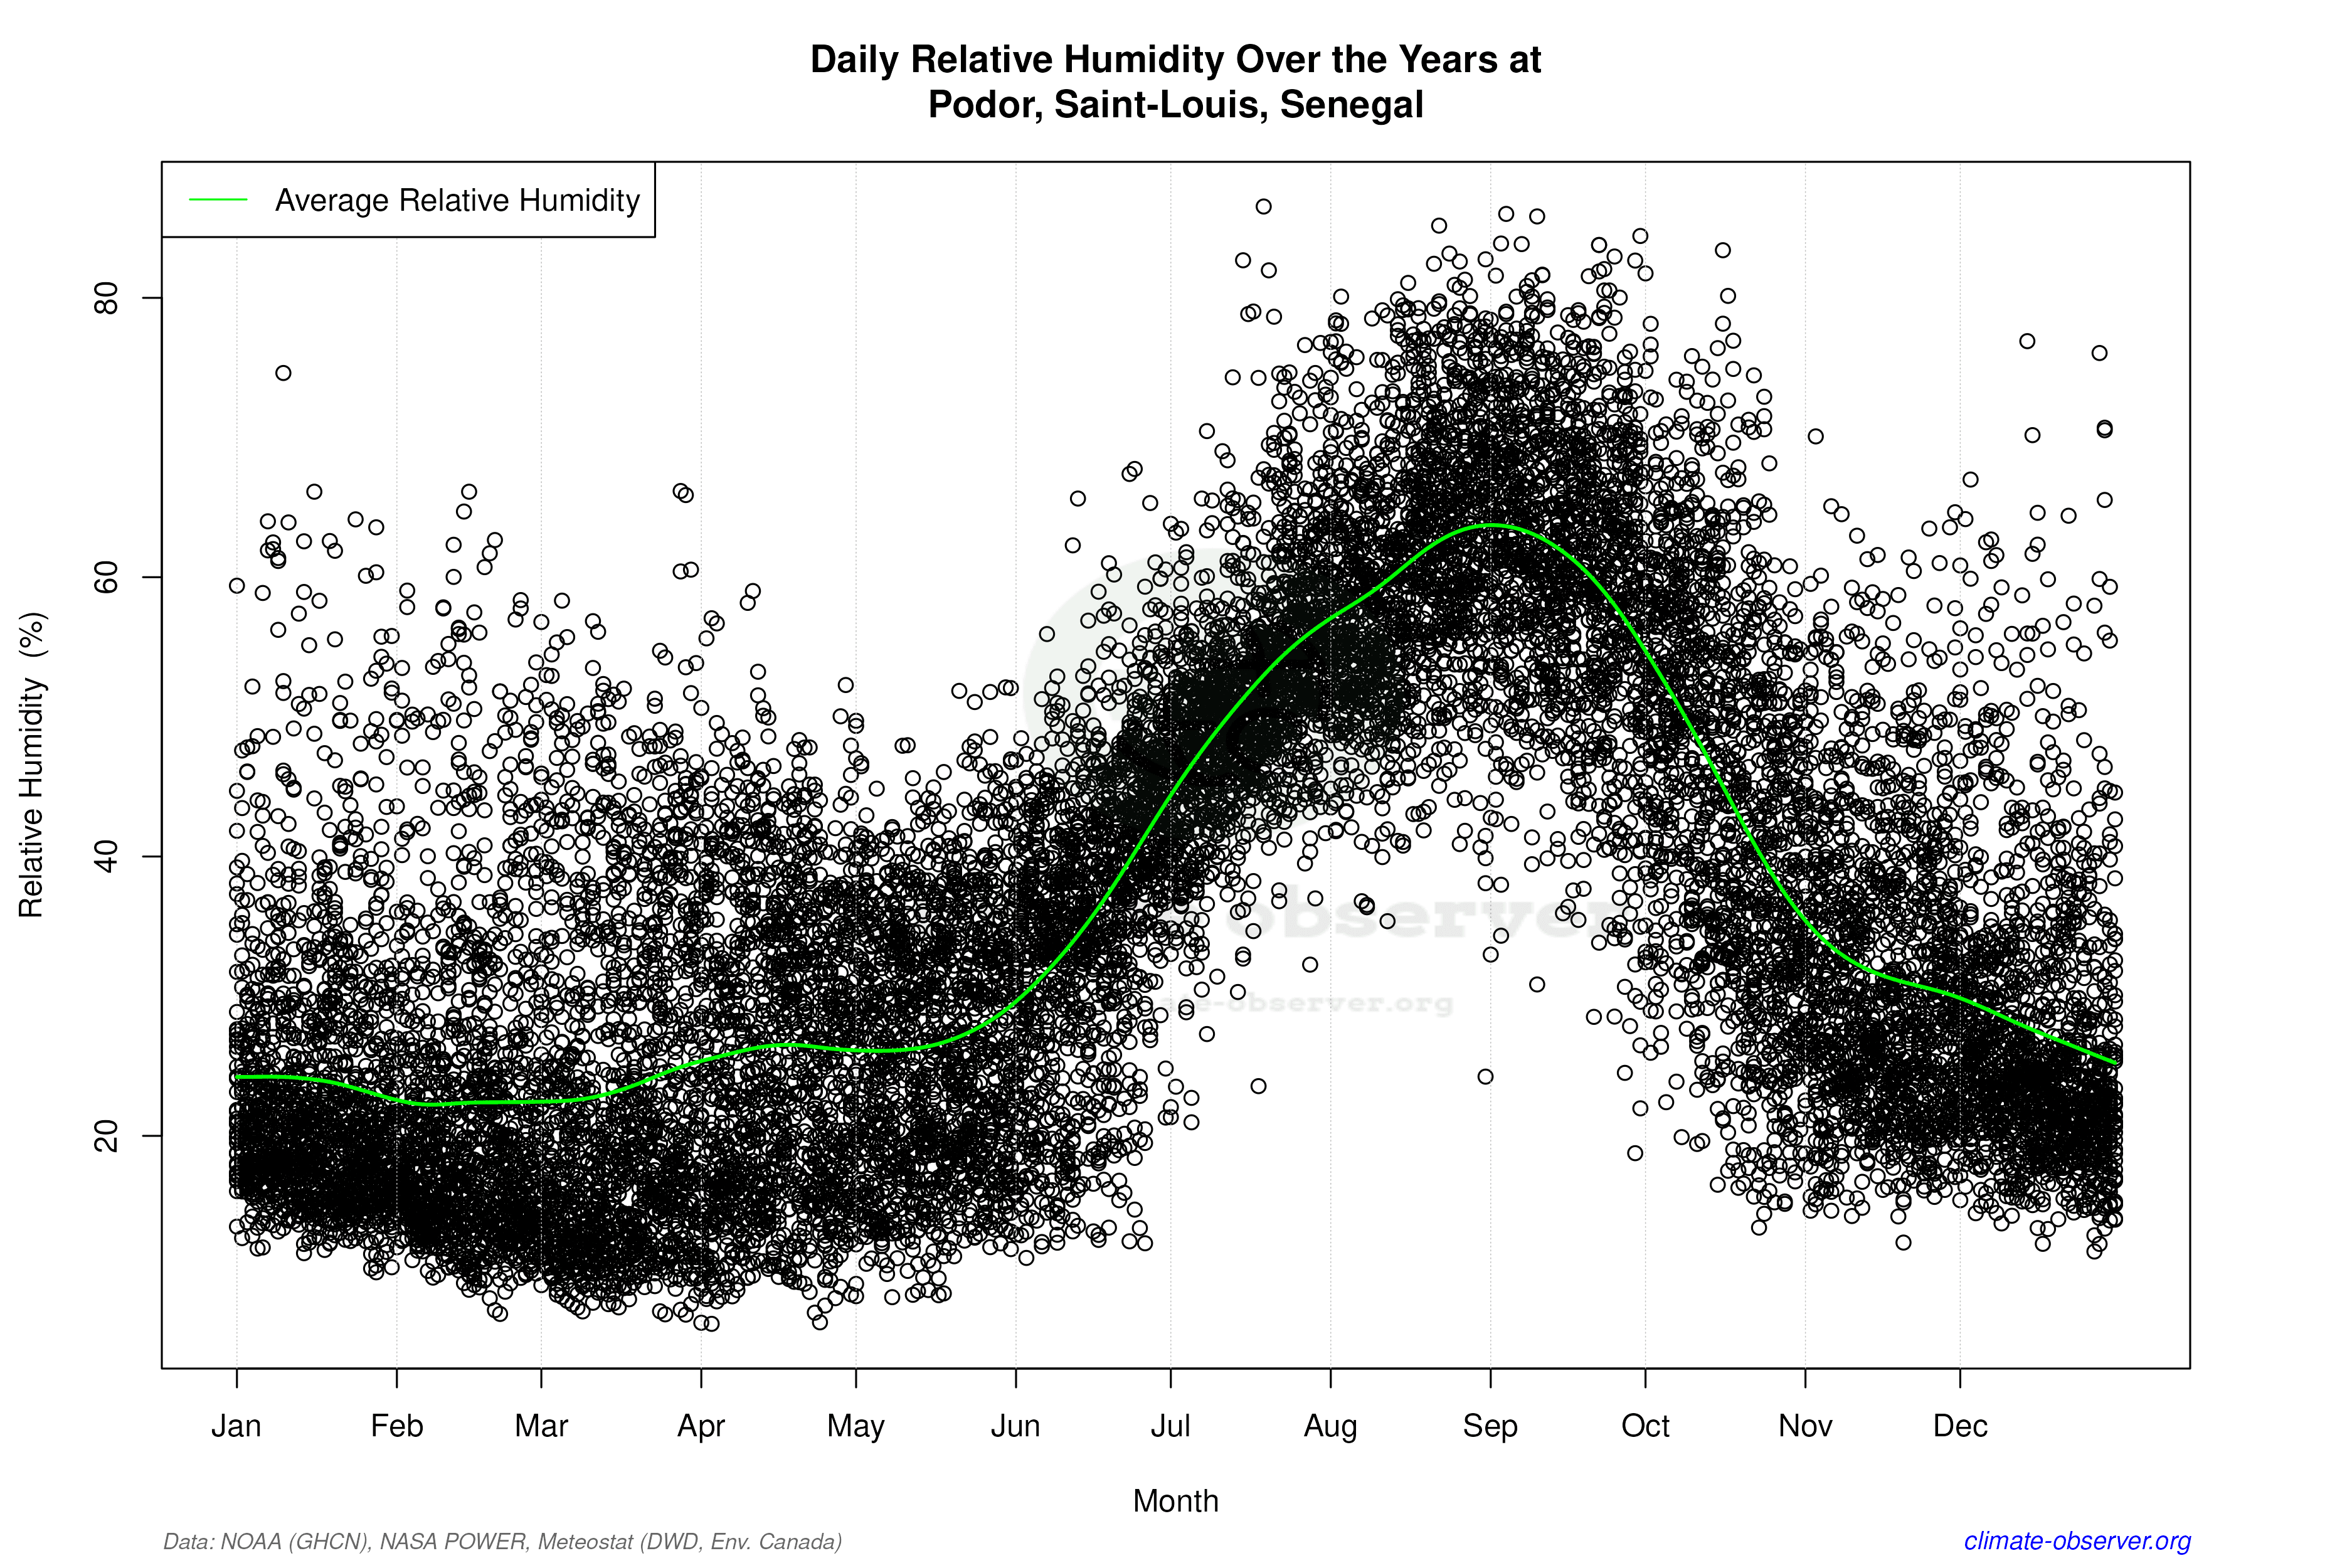

Average Max Temperature Throughout Year | 1 of 5
