Climate for Station: Dakar/Yoff, Dakar Region, Senegal
Loading live weather...
Climate Analysis & Overview
Dakar/Yoff's climate profile reveals a warming trend, with both highs and lows increasing over the last decade. Precipitation is becoming slightly more evenly distributed, suggesting shifts in local weather patterns. These changes are significant against the backdrop of Senegal's climate goals and the regional push for sustainable development.
Warming Trends in Dakar/Yoff
Situated on the westernmost point of Africa, Dakar/Yoff experiences a hot semi-arid climate, classified as BSh in the Köppen climate classification. The Atlantic Ocean's proximity moderates temperatures, yet recent data indicates a warming trend. Over the past decade, high temperatures have increased by 1.30°C (2.33°F), while low temperatures have risen by 0.98°C (1.76°F). This is more pronounced than the all-time trends, where highs have risen by 0.19°C (0.34°F) and lows by 0.19°C (0.33°F). These figures suggest a consistent warming pattern, aligning with global climate change narratives.
Temperature Extremes and Records
Dakar/Yoff's temperature records highlight the region's climatic extremes. The highest recorded temperature is 41.0°C (105.8°F), while the lowest dips to 10.0°C (50.0°F). These extremes underscore the variability inherent in a semi-arid climate, where temperatures can fluctuate significantly. The warming trend in both highs and lows could potentially push these records further, impacting local ecosystems and human activities.
Precipitation Patterns and Distribution
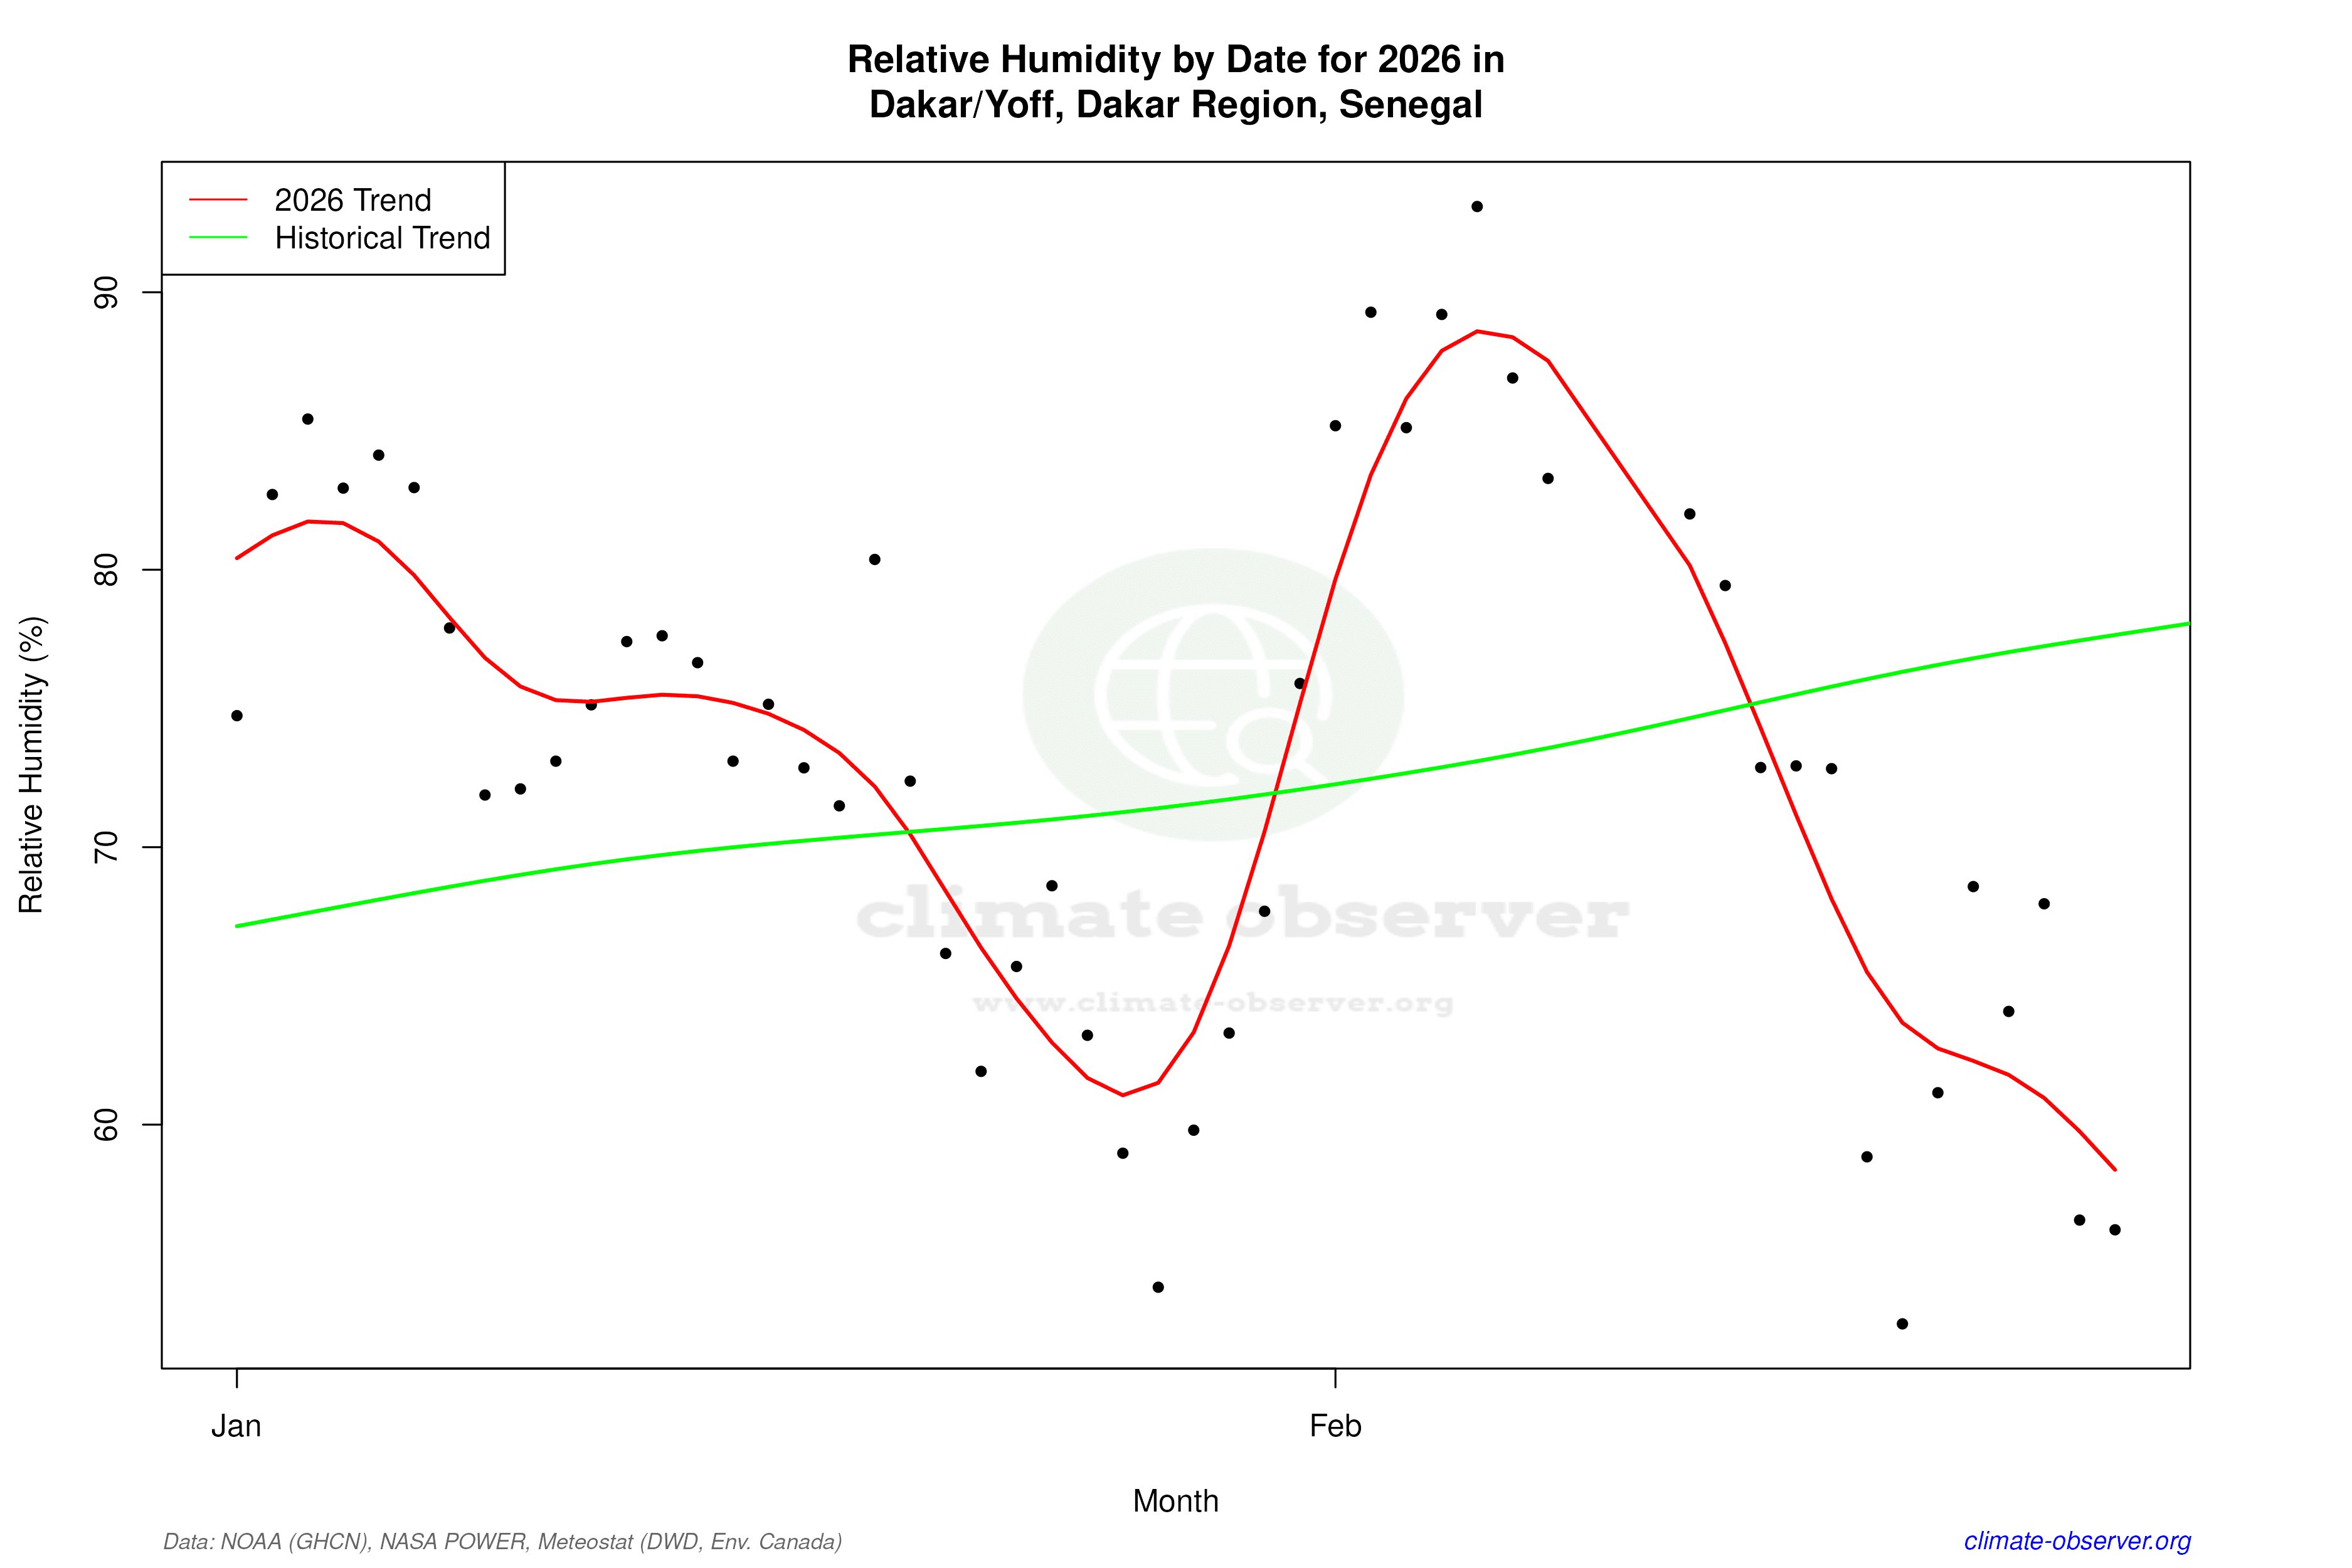
The Precipitation Concentration Index (PCI) is a critical metric for understanding rainfall distribution. A decrease in PCI from a baseline of 26.4 to a current value of 25.2 suggests that precipitation is becoming slightly more evenly distributed over the year. While still highly concentrated, this marginal change could indicate a shift towards more frequent, less intense rainfall events. Such changes are crucial for water resource management and agricultural planning in the region.
Regional Climate Context and Implications
Dakar/Yoff's climatic shifts occur within the broader context of Senegal's climate goals, which focus on sustainable development and resilience to climate change. The observed warming trends and changes in precipitation distribution may challenge these goals, necessitating adaptive strategies. Recent regional weather events, such as increased heatwaves and variable rainfall, highlight the urgency of addressing these climatic changes. The data from Dakar/Yoff serves as a microcosm of broader climatic shifts affecting West Africa, emphasising the need for comprehensive climate action plans.
Station Statistics
10-Year Trend
High: +1.97 °F/decade
Low: +1.71 °F/decade
Rain: -0.010 in/decade
25-Year Trend
High: +0.21 °F/decade
Low: +0.20 °F/decade
Rain: +0.003 in/decade
50-Year Trend
High: +0.53 °F/decade
Low: +0.45 °F/decade
Rain: +0.005 in/decade
All-Time Trend
High: +0.40 °F/decade
Low: +0.39 °F/decade
Rain: +0.005 in/decade
Percentage Above-Average Days
Last 12 Months: 51.4%
This Year: 13.4%
Precipitation Concentration Index (PCI) ℹ️
Last 12 Months: 50.9
Historical Average: 29.9
Percentile Rank of Last 12 Months ℹ️
High: 72nd percentile
Low: 83rd percentile
Rain: 37th percentile
Change in Variance ℹ️
High: +6.8%
Low: -9.3%
Intraday: -20.1%
Data Coverage
65.4%
First Year of Data
1943
Station Location
Historical Weather Records
| Max High | Avg High | Min High | Max Avg | Avg Avg | Min Avg | Max Low | Avg Low | Min Low | Max Precipitation | Avg Precipitation | Max Snow | Avg Snow | |
|---|---|---|---|---|---|---|---|---|---|---|---|---|---|
| Record | 105.80 °F | — | 63.32 °F | 88.88 °F | — | 59.72 °F | 84.07 °F | — | 50.00 °F | 6.34 in | — | — | — |
| January | 99.32 °F | 78.07 °F | 64.40 °F | 82.04 °F | 70.36 °F | 62.42 °F | 75.22 °F | 65.60 °F | 51.80 °F | 1.38 in | 0.01 in | — | — |
| February | 102.20 °F | 77.19 °F | 65.05 °F | 84.56 °F | 69.48 °F | 62.24 °F | 75.20 °F | 64.44 °F | 50.00 °F | 1.11 in | 0.01 in | — | — |
| March | 103.10 °F | 77.23 °F | 65.25 °F | 82.04 °F | 69.98 °F | 63.14 °F | 74.19 °F | 65.21 °F | 56.30 °F | 0.45 in | 0.00 in | — | — |
| April | 91.40 °F | 76.83 °F | 66.61 °F | 82.58 °F | 70.89 °F | 65.12 °F | 74.12 °F | 66.68 °F | 53.06 °F | 1.47 in | 0.00 in | — | — |
| May | 94.10 °F | 78.68 °F | 69.08 °F | 82.94 °F | 73.27 °F | 65.84 °F | 77.38 °F | 69.38 °F | 59.72 °F | 0.79 in | 0.00 in | — | — |
| June | 100.58 °F | 83.41 °F | 70.25 °F | 85.46 °F | 78.27 °F | 71.06 °F | 80.60 °F | 74.48 °F | 62.60 °F | 1.30 in | 0.02 in | — | — |
| July | 98.60 °F | 85.74 °F | 75.78 °F | 86.72 °F | 80.98 °F | 75.92 °F | 82.76 °F | 77.40 °F | 68.00 °F | 2.36 in | 0.08 in | — | — |
| August | 95.00 °F | 86.35 °F | 78.80 °F | 85.82 °F | 81.58 °F | 75.20 °F | 83.12 °F | 77.76 °F | 68.00 °F | 6.34 in | 0.25 in | — | — |
| September | 96.08 °F | 86.93 °F | 78.80 °F | 87.62 °F | 81.84 °F | 76.10 °F | 83.12 °F | 77.51 °F | 64.76 °F | 5.67 in | 0.23 in | — | — |
| October | 102.20 °F | 87.81 °F | 78.26 °F | 88.88 °F | 82.10 °F | 74.48 °F | 84.07 °F | 77.66 °F | 64.58 °F | 2.28 in | 0.06 in | — | — |
| November | 105.80 °F | 85.79 °F | 71.60 °F | 86.90 °F | 78.87 °F | 68.36 °F | 83.59 °F | 74.30 °F | 60.62 °F | 1.59 in | 0.01 in | — | — |
| December | 103.10 °F | 81.32 °F | 63.32 °F | 83.48 °F | 74.27 °F | 59.72 °F | 79.34 °F | 69.72 °F | 53.60 °F | 0.67 in | 0.01 in | — | — |
Data Visualisations
Remove WatermarksCurrent Year Climate Trends vs Historical


Max Temperature this Year | 1 of 6
Climate 12-Month Moving Averages


Max Temperature 12-Month MA | 1 of 6
Daily Data Points and Averages Throughout the Year


Average Max Temperature Throughout Year | 1 of 5
