Climate for Station: Tambacounda, Senegal
Loading live weather...
Climate Analysis & Overview
Tambacounda is experiencing a notable warming trend, with significant increases in both high and low temperatures over the past decade. Despite a decrease in precipitation concentration, the region remains prone to intense rainfall events. This climate profile highlights these shifts within the context of Senegal's broader climate objectives.
Köppen Climate and Geographic Influence
Tambacounda, located at 13.767°N, -13.683°W, falls under the Köppen climate classification of Aw, which denotes a tropical savanna climate with a distinct dry season. This region is characterised by its flat terrain and proximity to the Senegal River, which influences local weather patterns by moderating temperature extremes and contributing to the region's seasonal rainfall.
Warming Trends in Temperature Extremes
Over the past decade, Tambacounda has experienced a significant warming trend, with high temperatures increasing by 0.85°C (1.53°F) and low temperatures rising by 0.53°C (0.96°F). This is a more pronounced change compared to the all-time trends, which show a rise of 0.35°C (0.63°F) in highs and 0.12°C (0.22°F) in lows. These trends suggest a rapid shift towards warmer conditions, aligning with broader regional patterns observed in West Africa due to climate change.
Precipitation Patterns and Distribution
The Precipitation Concentration Index (PCI) for Tambacounda has decreased from a baseline of 26.64 to a current value of 21.29. This indicates a more even distribution of rainfall events, although the PCI remains above 20, signifying that precipitation is still highly concentrated. This shift towards a more evenly distributed rainfall pattern may offer some relief from the intense, sporadic downpours typical of the region, though the risk of flooding remains a concern due to the high baseline concentration.
Temperature Records and Extremes
Tambacounda's record high temperature stands at 48.5°C (119.3°F), while the record low is 10.0°C (50.0°F). These extremes highlight the region's susceptibility to significant temperature variations, which can impact agriculture and water resources. The rising trend in both high and low temperatures suggests that such extremes may become more frequent, posing challenges for local communities and ecosystems.
Regional Climate Goals and Implications
Senegal's climate goals focus on adapting to and mitigating the impacts of climate change, with an emphasis on sustainable agriculture and water management. The warming trends and changes in precipitation distribution observed in Tambacounda underscore the importance of these objectives. Recent weather events, such as prolonged heatwaves and erratic rainfall, further highlight the need for robust climate adaptation strategies to support the region's resilience in the face of ongoing climatic shifts.
Station Statistics
10-Year Trend
High: +1.27 °F/decade
Low: +0.83 °F/decade
Rain: -0.003 in/decade
25-Year Trend
High: +0.48 °F/decade
Low: +0.93 °F/decade
Rain: +0.006 in/decade
50-Year Trend
High: +0.61 °F/decade
Low: +0.28 °F/decade
Rain: +0.005 in/decade
All-Time Trend
High: +0.61 °F/decade
Low: +0.28 °F/decade
Rain: +0.005 in/decade
Percentage Above-Average Days
Last 12 Months: 49.4%
This Year: 68.5%
Precipitation Concentration Index (PCI) ℹ️
Last 12 Months: 24.4
Historical Average: 26.6
Percentile Rank of Last 12 Months ℹ️
High: 65th percentile
Low: 84th percentile
Rain: 66th percentile
Change in Variance ℹ️
High: +8.2%
Low: -7.5%
Intraday: +4.3%
Data Coverage
96.5%
First Year of Data
1973
Station Location
Historical Weather Records
| Max High | Avg High | Min High | Max Avg | Avg Avg | Min Avg | Max Low | Avg Low | Min Low | Max Precipitation | Avg Precipitation | Max Snow | Avg Snow | |
|---|---|---|---|---|---|---|---|---|---|---|---|---|---|
| Record | 119.30 °F | — | 74.26 °F | 103.82 °F | — | 65.12 °F | 93.20 °F | — | 50.00 °F | 8.66 in | — | — | — |
| January | 105.80 °F | 94.56 °F | 76.59 °F | 94.28 °F | 80.29 °F | 68.00 °F | 77.36 °F | 65.70 °F | 51.44 °F | 0.21 in | 0.00 in | — | — |
| February | 111.56 °F | 99.17 °F | 75.20 °F | 100.04 °F | 84.69 °F | 68.36 °F | 82.04 °F | 69.87 °F | 57.20 °F | 0.24 in | 0.00 in | — | — |
| March | 113.00 °F | 103.26 °F | 88.16 °F | 102.92 °F | 89.45 °F | 76.10 °F | 86.00 °F | 74.66 °F | 57.92 °F | 0.29 in | 0.00 in | — | — |
| April | 118.40 °F | 106.43 °F | 94.46 °F | 103.46 °F | 92.87 °F | 80.42 °F | 93.20 °F | 78.75 °F | 64.94 °F | 0.12 in | 0.00 in | — | — |
| May | 119.30 °F | 105.68 °F | 87.66 °F | 103.82 °F | 93.13 °F | 78.62 °F | 92.19 °F | 80.86 °F | 68.90 °F | 1.18 in | 0.01 in | — | — |
| June | 115.70 °F | 99.71 °F | 81.86 °F | 100.22 °F | 88.95 °F | 73.04 °F | 87.26 °F | 79.06 °F | 63.50 °F | 6.02 in | 0.13 in | — | — |
| July | 107.60 °F | 92.42 °F | 78.80 °F | 93.38 °F | 83.63 °F | 74.12 °F | 84.20 °F | 75.78 °F | 62.60 °F | 8.66 in | 0.23 in | — | — |
| August | 103.28 °F | 89.86 °F | 78.80 °F | 91.90 °F | 81.66 °F | 71.06 °F | 82.40 °F | 74.38 °F | 66.02 °F | 4.06 in | 0.29 in | — | — |
| September | 105.08 °F | 90.81 °F | 79.16 °F | 90.70 °F | 81.82 °F | 72.86 °F | 80.64 °F | 73.55 °F | 62.60 °F | 4.53 in | 0.26 in | — | — |
| October | 112.28 °F | 95.65 °F | 80.42 °F | 93.56 °F | 84.29 °F | 73.04 °F | 80.60 °F | 73.57 °F | 62.60 °F | 3.07 in | 0.08 in | — | — |
| November | 114.80 °F | 98.29 °F | 82.47 °F | 94.64 °F | 83.73 °F | 70.88 °F | 80.60 °F | 68.66 °F | 50.00 °F | 0.94 in | 0.00 in | — | — |
| December | 112.10 °F | 94.99 °F | 74.26 °F | 97.52 °F | 80.62 °F | 65.12 °F | 78.80 °F | 65.57 °F | 50.00 °F | 0.35 in | 0.00 in | — | — |
Data Visualisations
Remove WatermarksCurrent Year Climate Trends vs Historical


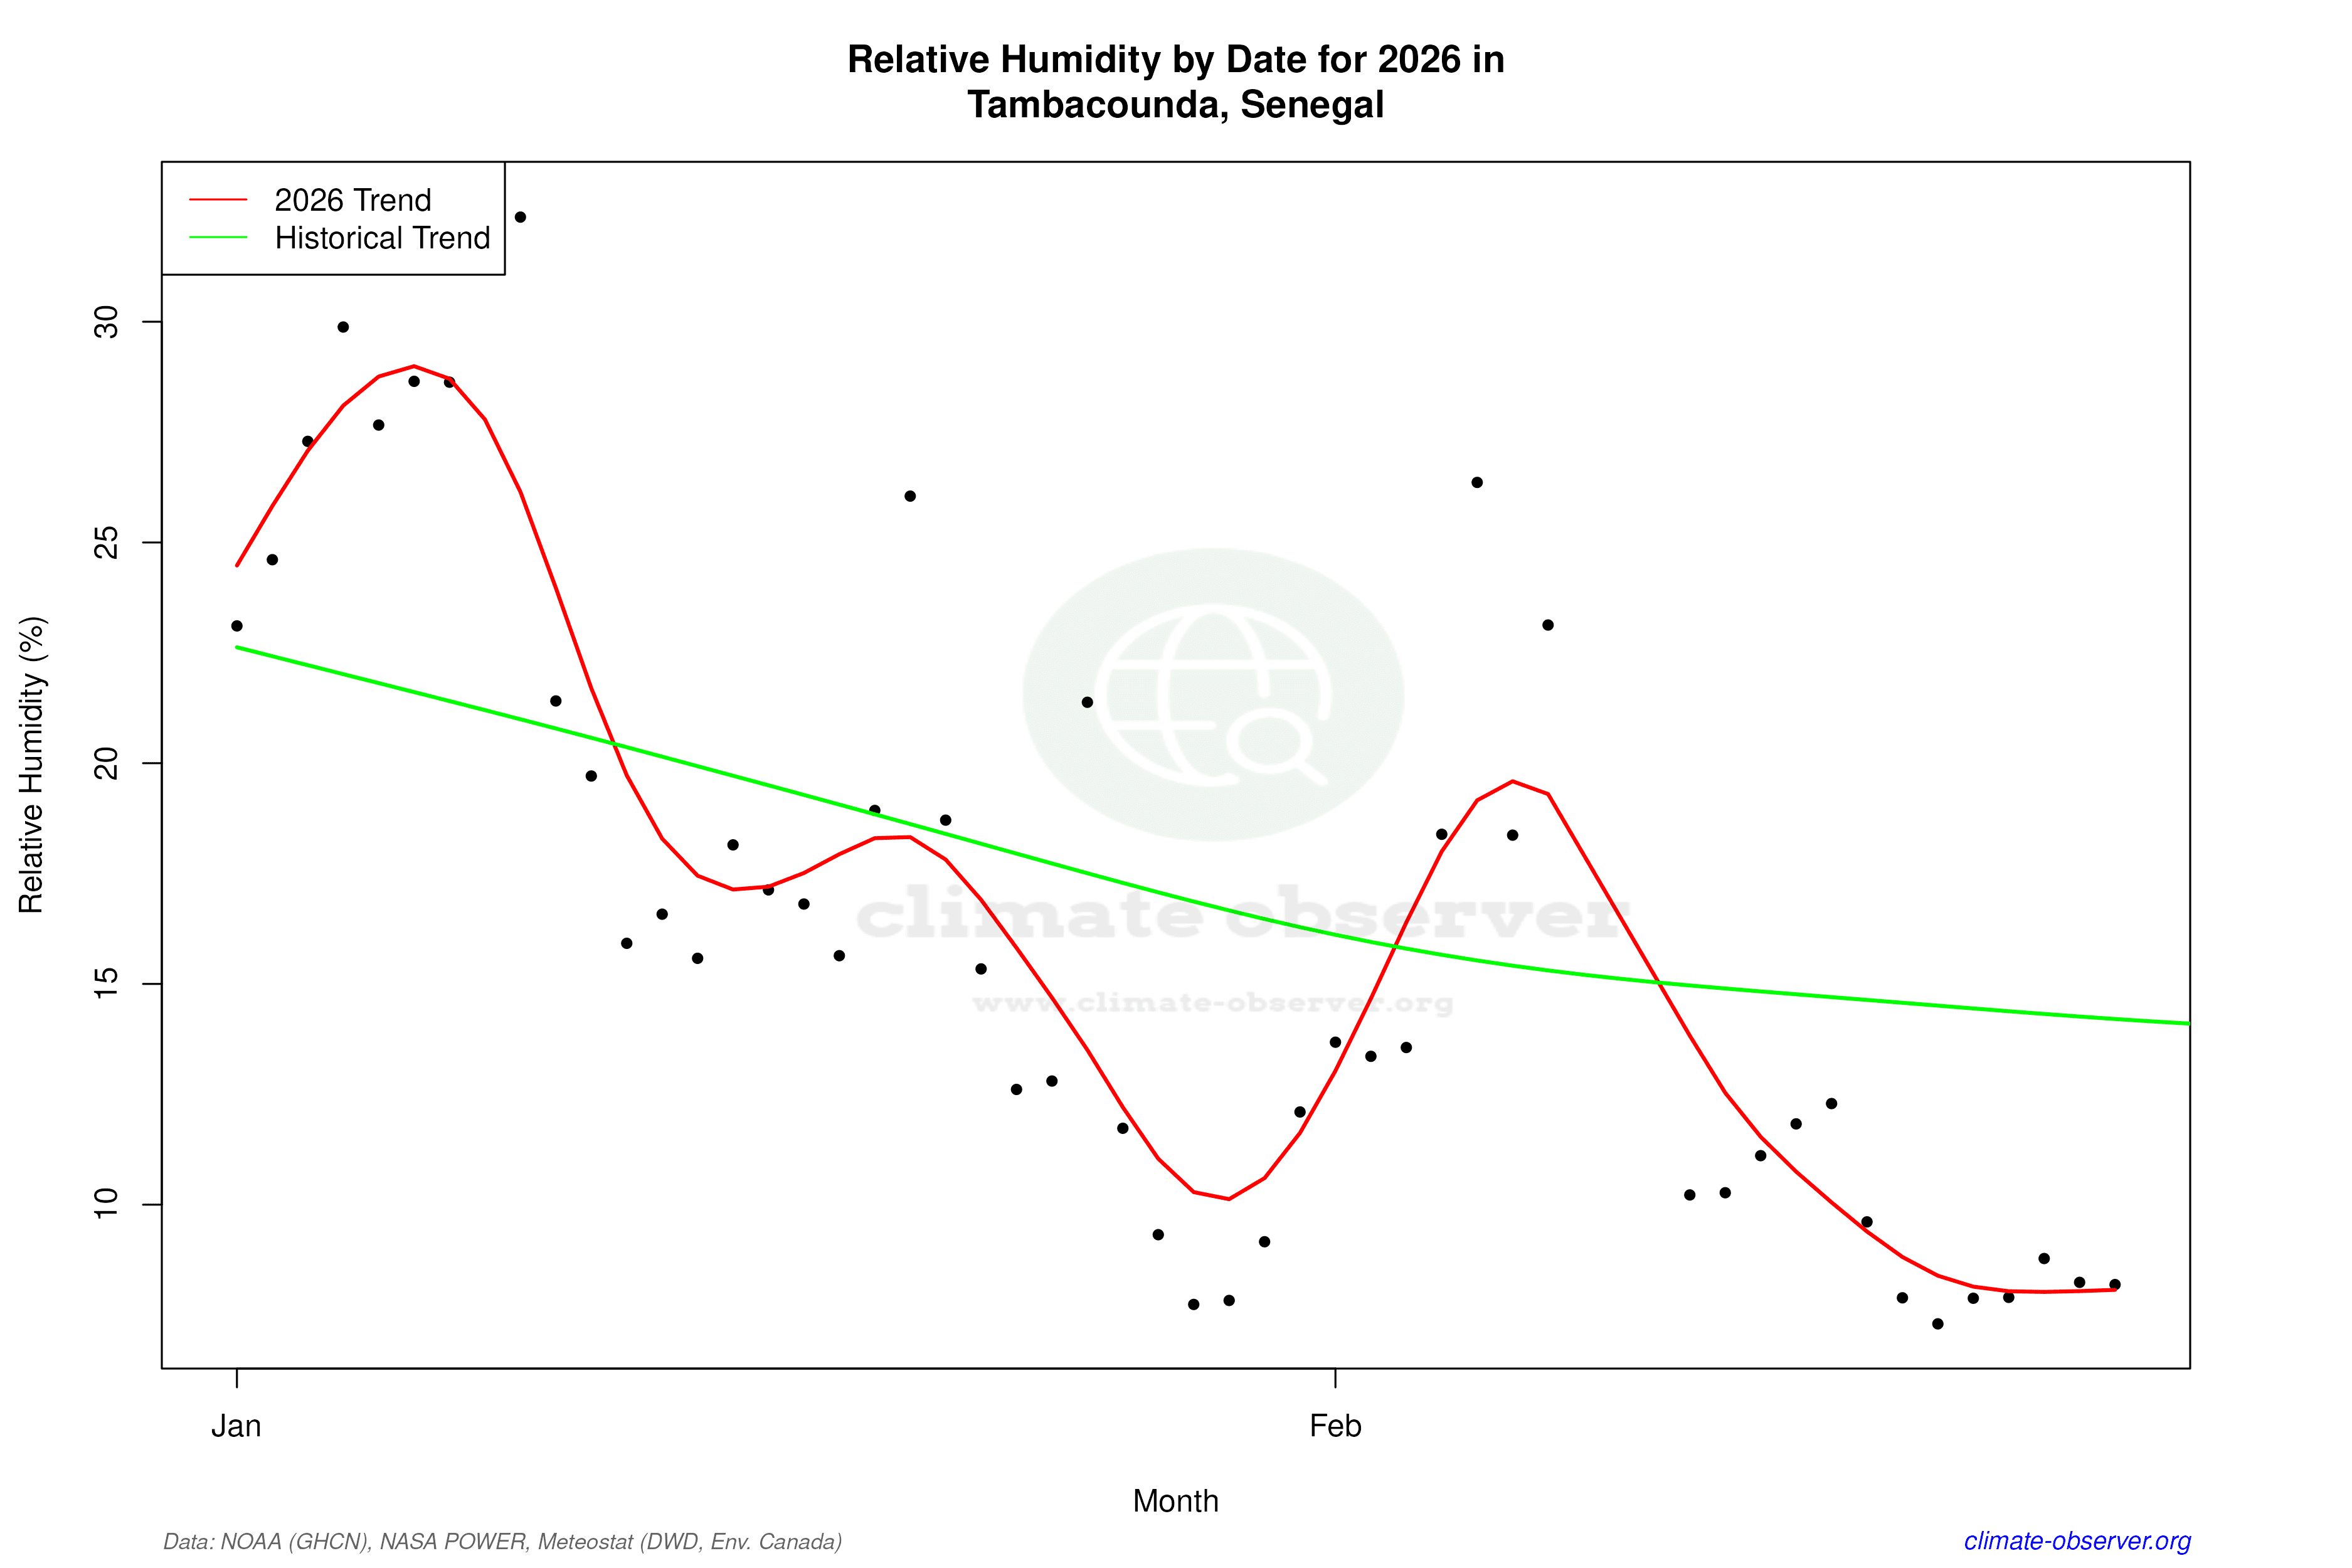

Max Temperature this Year | 1 of 6
Climate 12-Month Moving Averages


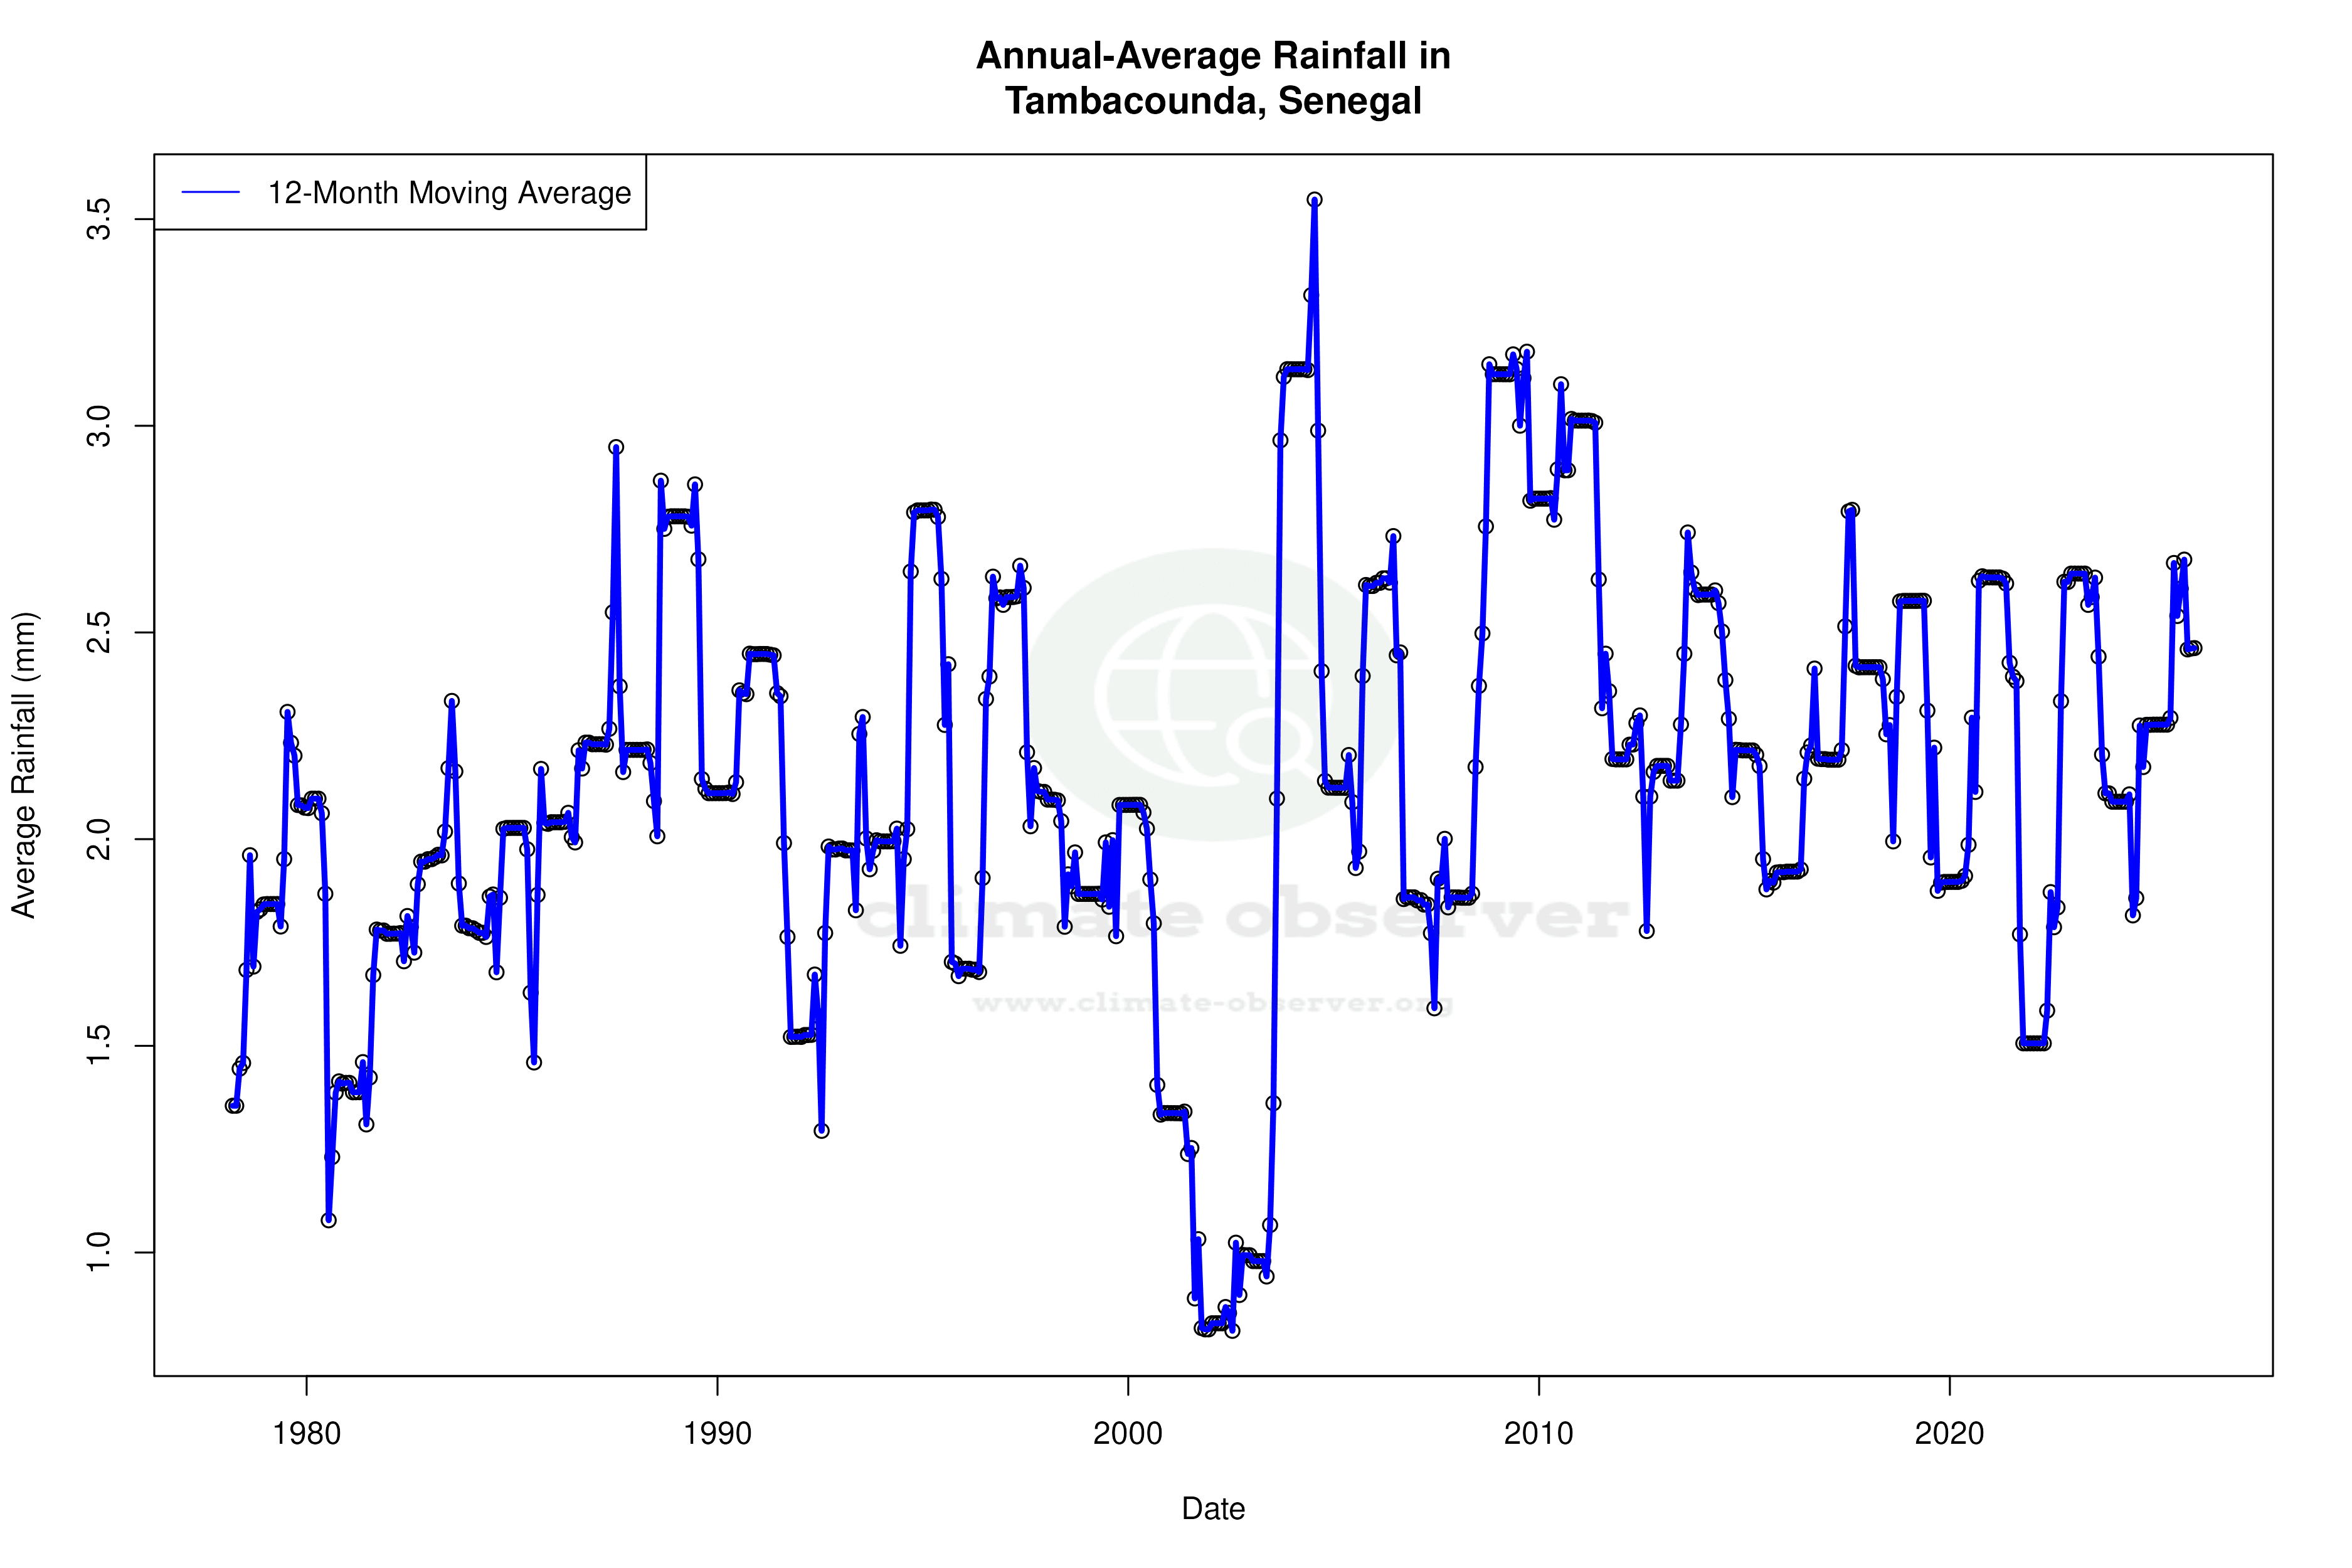


Max Temperature 12-Month MA | 1 of 6
Daily Data Points and Averages Throughout the Year


Average Max Temperature Throughout Year | 1 of 5
