Climate for Station: Ziguinchor, Senegal
Loading live weather...
Climate Analysis & Overview
Ziguinchor, located in the southern region of Senegal, displays a complex climate narrative with a slight warming trend over the long term, yet a recent decade of contrasting temperature changes. Despite a marginal shift in precipitation patterns, the area remains under the influence of concentrated rainfall events.
Climatic Setting of Ziguinchor
Ziguinchor is situated in a region characterised by a tropical savanna climate according to the Köppen classification. This climate is typically marked by a distinct wet season and a dry season, influenced by the proximity to the Atlantic Ocean and the Casamance River. The geographical setting contributes to the area's weather patterns, with the river enhancing humidity levels and the ocean moderating temperatures.
Temperature Trends: A Mixed Picture
Over the past decade, Ziguinchor has experienced a slight cooling in high temperatures, with a decrease of 0.28°C (0.50°F). In contrast, low temperatures have shown a modest increase of 0.04°C (0.07°F). However, when considering the all-time trends, the region exhibits an overall warming, with high temperatures rising by 0.36°C (0.65°F) and low temperatures increasing by 0.18°C (0.32°F). This suggests a long-term warming trend, although recent years have shown variability.
Temperature Extremes and Records
Ziguinchor has recorded an absolute maximum temperature of 46.0°C (114.8°F) and a minimum of 10.11°C (50.2°F). These extremes highlight the potential for significant temperature fluctuations within the region, influenced by both seasonal changes and broader climatic shifts.
Precipitation Patterns: Slight Adjustments
The Precipitation Concentration Index (PCI) for Ziguinchor shows a baseline of 26.36 compared to a current value of 26.33. This marginal decrease indicates a very slight shift towards a more even distribution of rainfall events. However, the PCI remains above 20, suggesting that precipitation is still highly concentrated in fewer, more intense events. This pattern aligns with the broader regional climate, where heavy rainfall episodes are common during the wet season.
Regional Climate Context and Considerations
Senegal's regional climate goals focus on adapting to and mitigating the impacts of climate change, including managing water resources and enhancing resilience to extreme weather events. Recent weather patterns in Ziguinchor, with their slight warming and concentrated precipitation, underscore the importance of these initiatives. The region's climate profile, with its intricate balance of temperature trends and precipitation patterns, serves as a critical data point for understanding broader climate dynamics in West Africa.
Station Statistics
10-Year Trend
High: -0.64 °F/decade
Low: -0.13 °F/decade
Rain: -0.006 in/decade
25-Year Trend
High: +0.66 °F/decade
Low: -0.02 °F/decade
Rain: +0.015 in/decade
50-Year Trend
High: +0.64 °F/decade
Low: +0.32 °F/decade
Rain: +0.010 in/decade
All-Time Trend
High: +0.63 °F/decade
Low: +0.32 °F/decade
Rain: +0.010 in/decade
Percentage Above-Average Days
Last 12 Months: 46.4%
This Year: 38.3%
Precipitation Concentration Index (PCI) ℹ️
Last 12 Months: 23.1
Historical Average: 26.5
Percentile Rank of Last 12 Months ℹ️
High: 82nd percentile
Low: 82nd percentile
Rain: 66th percentile
Change in Variance ℹ️
High: +7.6%
Low: -7.2%
Intraday: +0.9%
Data Coverage
97.2%
First Year of Data
1973
Station Location
Historical Weather Records
| Max High | Avg High | Min High | Max Avg | Avg Avg | Min Avg | Max Low | Avg Low | Min Low | Max Precipitation | Avg Precipitation | Max Snow | Avg Snow | |
|---|---|---|---|---|---|---|---|---|---|---|---|---|---|
| Record | 114.80 °F | — | 73.40 °F | 96.62 °F | — | 64.58 °F | 80.87 °F | — | 50.20 °F | 8.03 in | — | — | — |
| January | 104.90 °F | 92.78 °F | 73.40 °F | 89.96 °F | 76.53 °F | 66.29 °F | 75.20 °F | 63.07 °F | 50.20 °F | 0.56 in | 0.00 in | — | — |
| February | 110.30 °F | 97.51 °F | 78.44 °F | 96.62 °F | 79.32 °F | 67.28 °F | 78.62 °F | 65.22 °F | 50.90 °F | 0.16 in | 0.00 in | — | — |
| March | 112.64 °F | 100.34 °F | 84.20 °F | 95.54 °F | 81.18 °F | 70.16 °F | 78.80 °F | 67.58 °F | 51.80 °F | 7.54 in | 0.01 in | — | — |
| April | 113.00 °F | 100.81 °F | 84.74 °F | 96.08 °F | 81.56 °F | 69.62 °F | 80.24 °F | 69.16 °F | 56.84 °F | 0.39 in | 0.00 in | — | — |
| May | 114.80 °F | 98.63 °F | 84.56 °F | 95.54 °F | 82.33 °F | 71.24 °F | 80.87 °F | 72.08 °F | 53.24 °F | 0.63 in | 0.01 in | — | — |
| June | 114.80 °F | 95.00 °F | 80.60 °F | 94.10 °F | 83.48 °F | 74.84 °F | 80.60 °F | 75.45 °F | 63.50 °F | 6.08 in | 0.15 in | — | — |
| July | 107.96 °F | 90.45 °F | 77.00 °F | 90.68 °F | 81.33 °F | 73.40 °F | 80.60 °F | 75.11 °F | 65.12 °F | 7.87 in | 0.39 in | — | — |
| August | 103.64 °F | 89.05 °F | 75.20 °F | 88.34 °F | 80.44 °F | 72.86 °F | 80.24 °F | 74.79 °F | 64.76 °F | 8.03 in | 0.52 in | — | — |
| September | 104.00 °F | 90.00 °F | 77.00 °F | 89.42 °F | 80.80 °F | 73.04 °F | 80.60 °F | 74.46 °F | 66.38 °F | 7.32 in | 0.43 in | — | — |
| October | 103.10 °F | 92.25 °F | 78.80 °F | 92.30 °F | 82.34 °F | 73.58 °F | 80.60 °F | 74.57 °F | 62.60 °F | 5.88 in | 0.16 in | — | — |
| November | 103.82 °F | 92.93 °F | 77.36 °F | 89.06 °F | 80.39 °F | 65.30 °F | 78.80 °F | 70.51 °F | 55.40 °F | 0.90 in | 0.01 in | — | — |
| December | 102.92 °F | 91.24 °F | 73.96 °F | 88.34 °F | 76.65 °F | 64.58 °F | 76.28 °F | 64.58 °F | 53.42 °F | 2.13 in | 0.00 in | — | — |
Data Visualisations
Remove WatermarksCurrent Year Climate Trends vs Historical


Max Temperature this Year | 1 of 6
Climate 12-Month Moving Averages
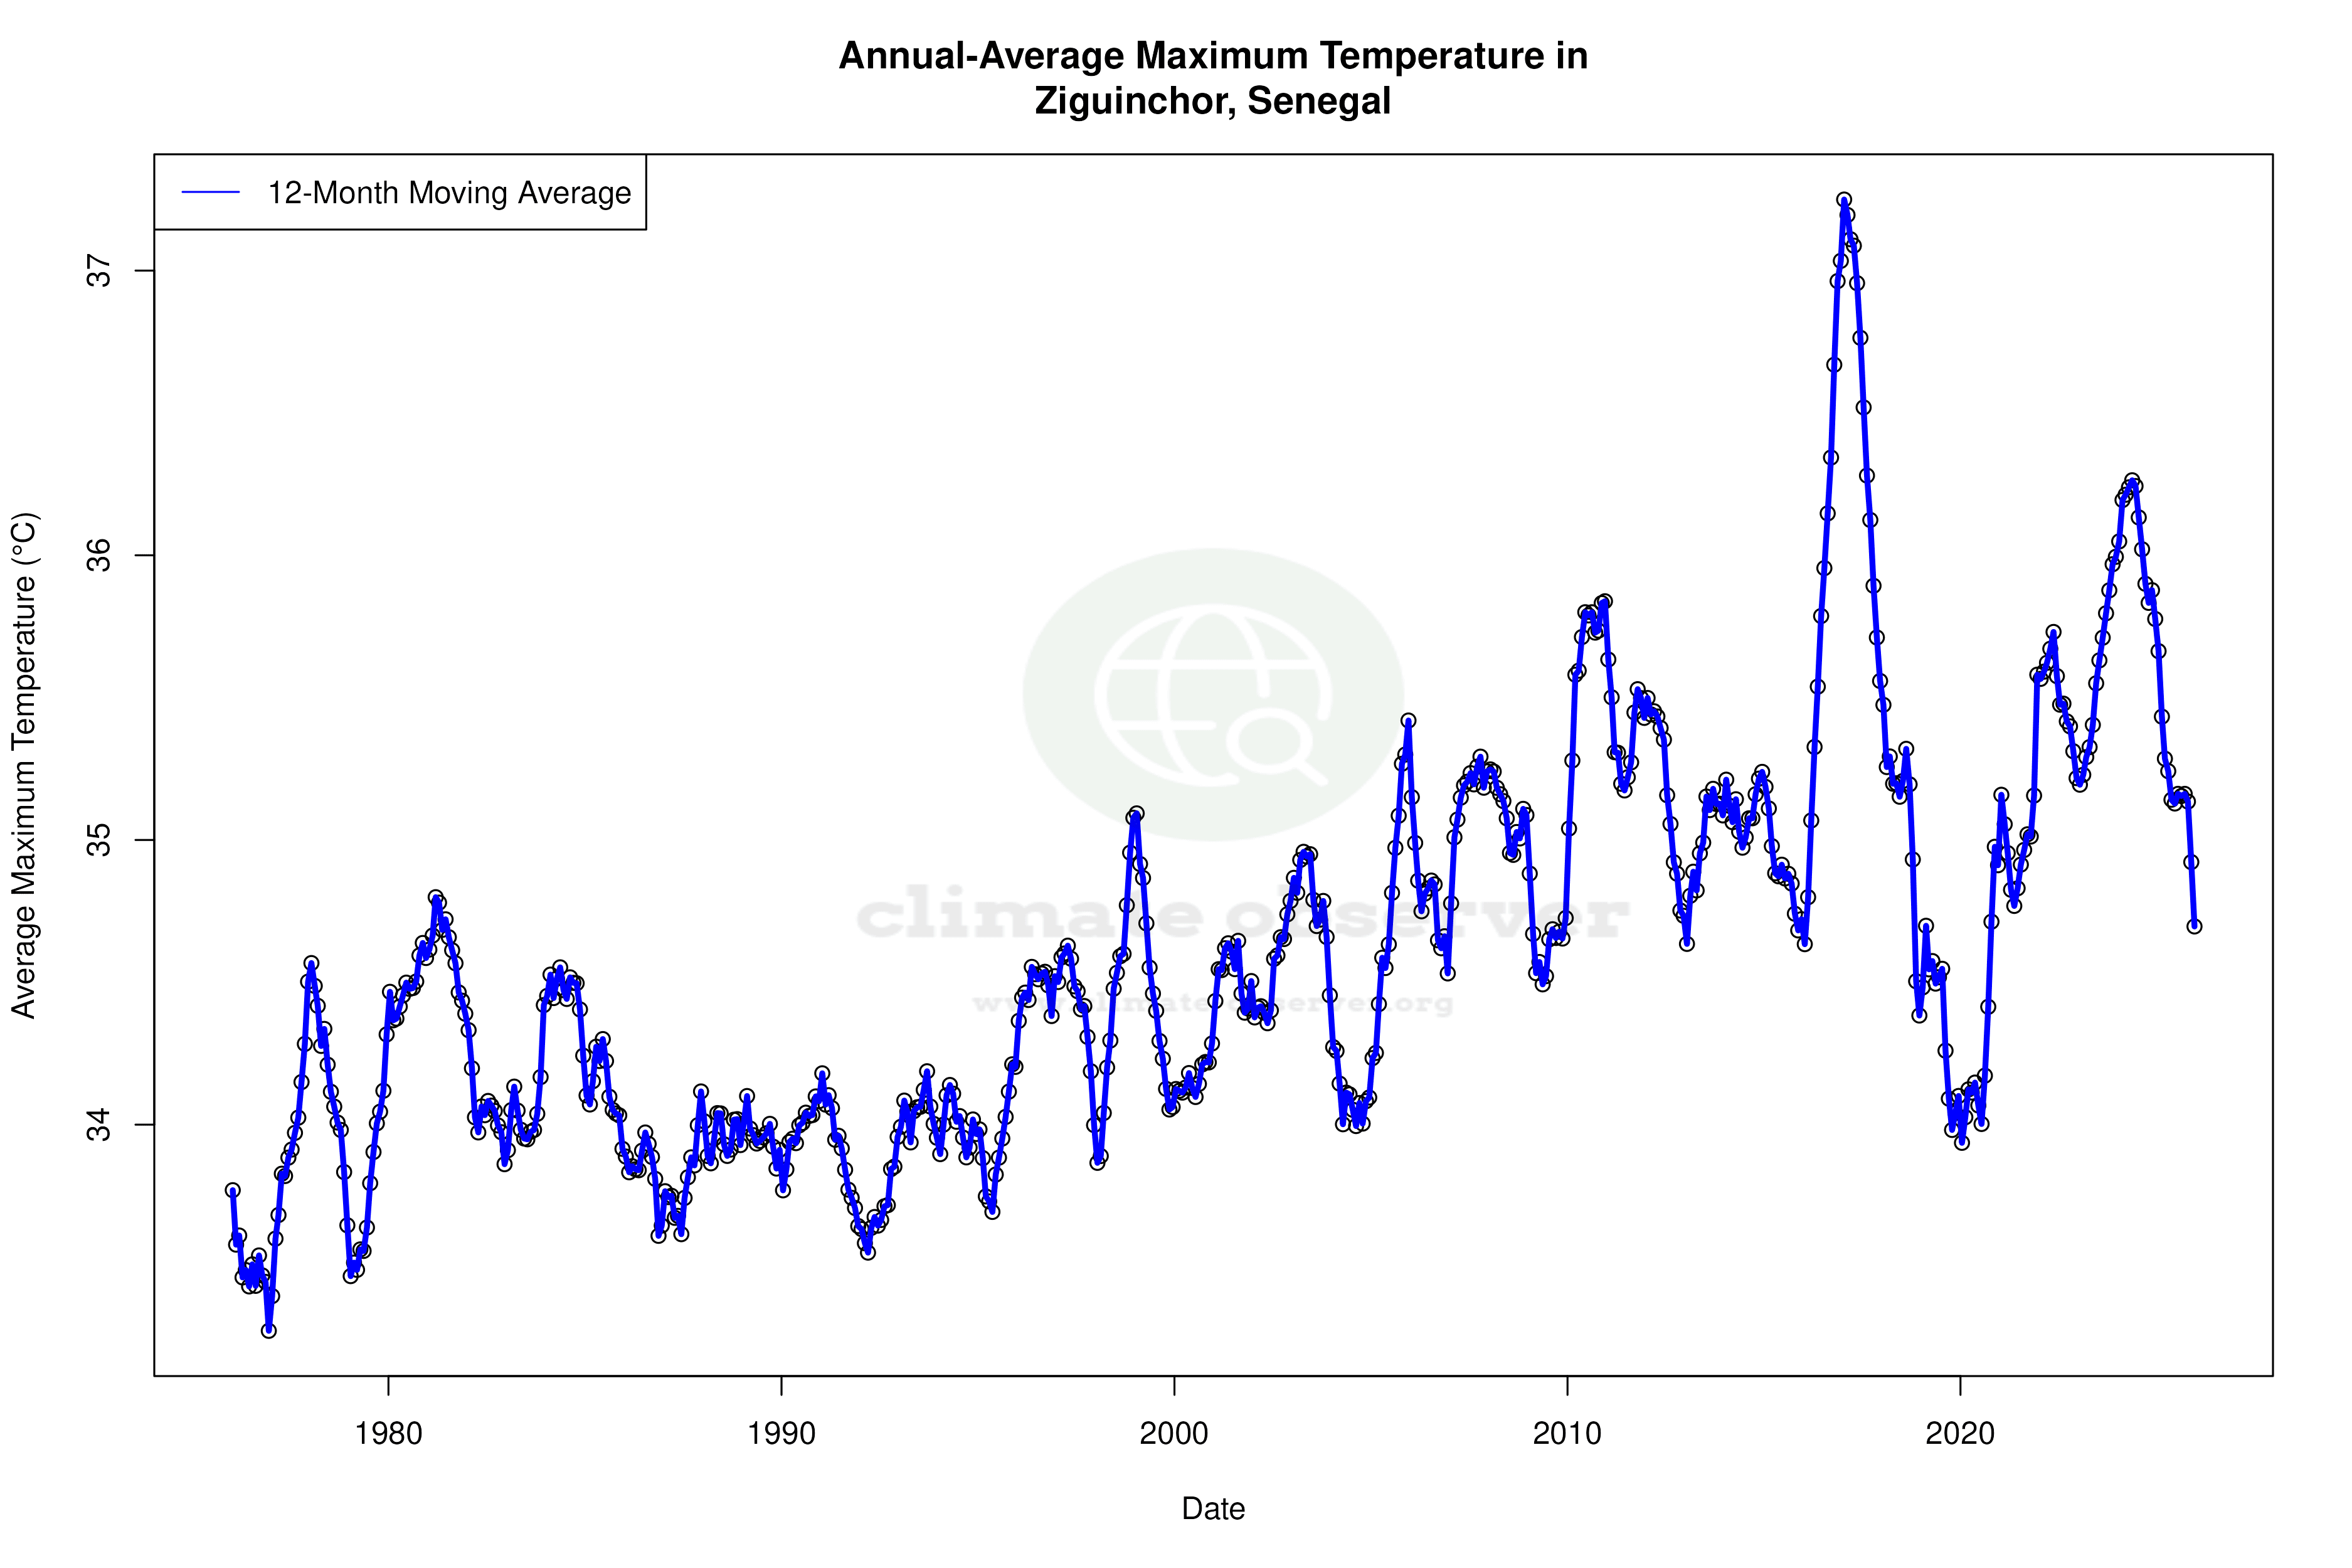


Max Temperature 12-Month MA | 1 of 6
Daily Data Points and Averages Throughout the Year


Average Max Temperature Throughout Year | 1 of 5
