Climate for Station: Tortosa - Observatorio Del Ebr, Catalonia, Spain
Loading live weather...
Climate Analysis & Overview
Tortosa - Observatorio Del Ebr is experiencing a warming trend, with notable increases in both high and low temperatures over the past decade. Precipitation patterns have become more evenly distributed, reflecting a shift in the local climate dynamics. These changes align with broader regional climate goals in Spain, focusing on adaptation and resilience.
Mediterranean Climate Dynamics
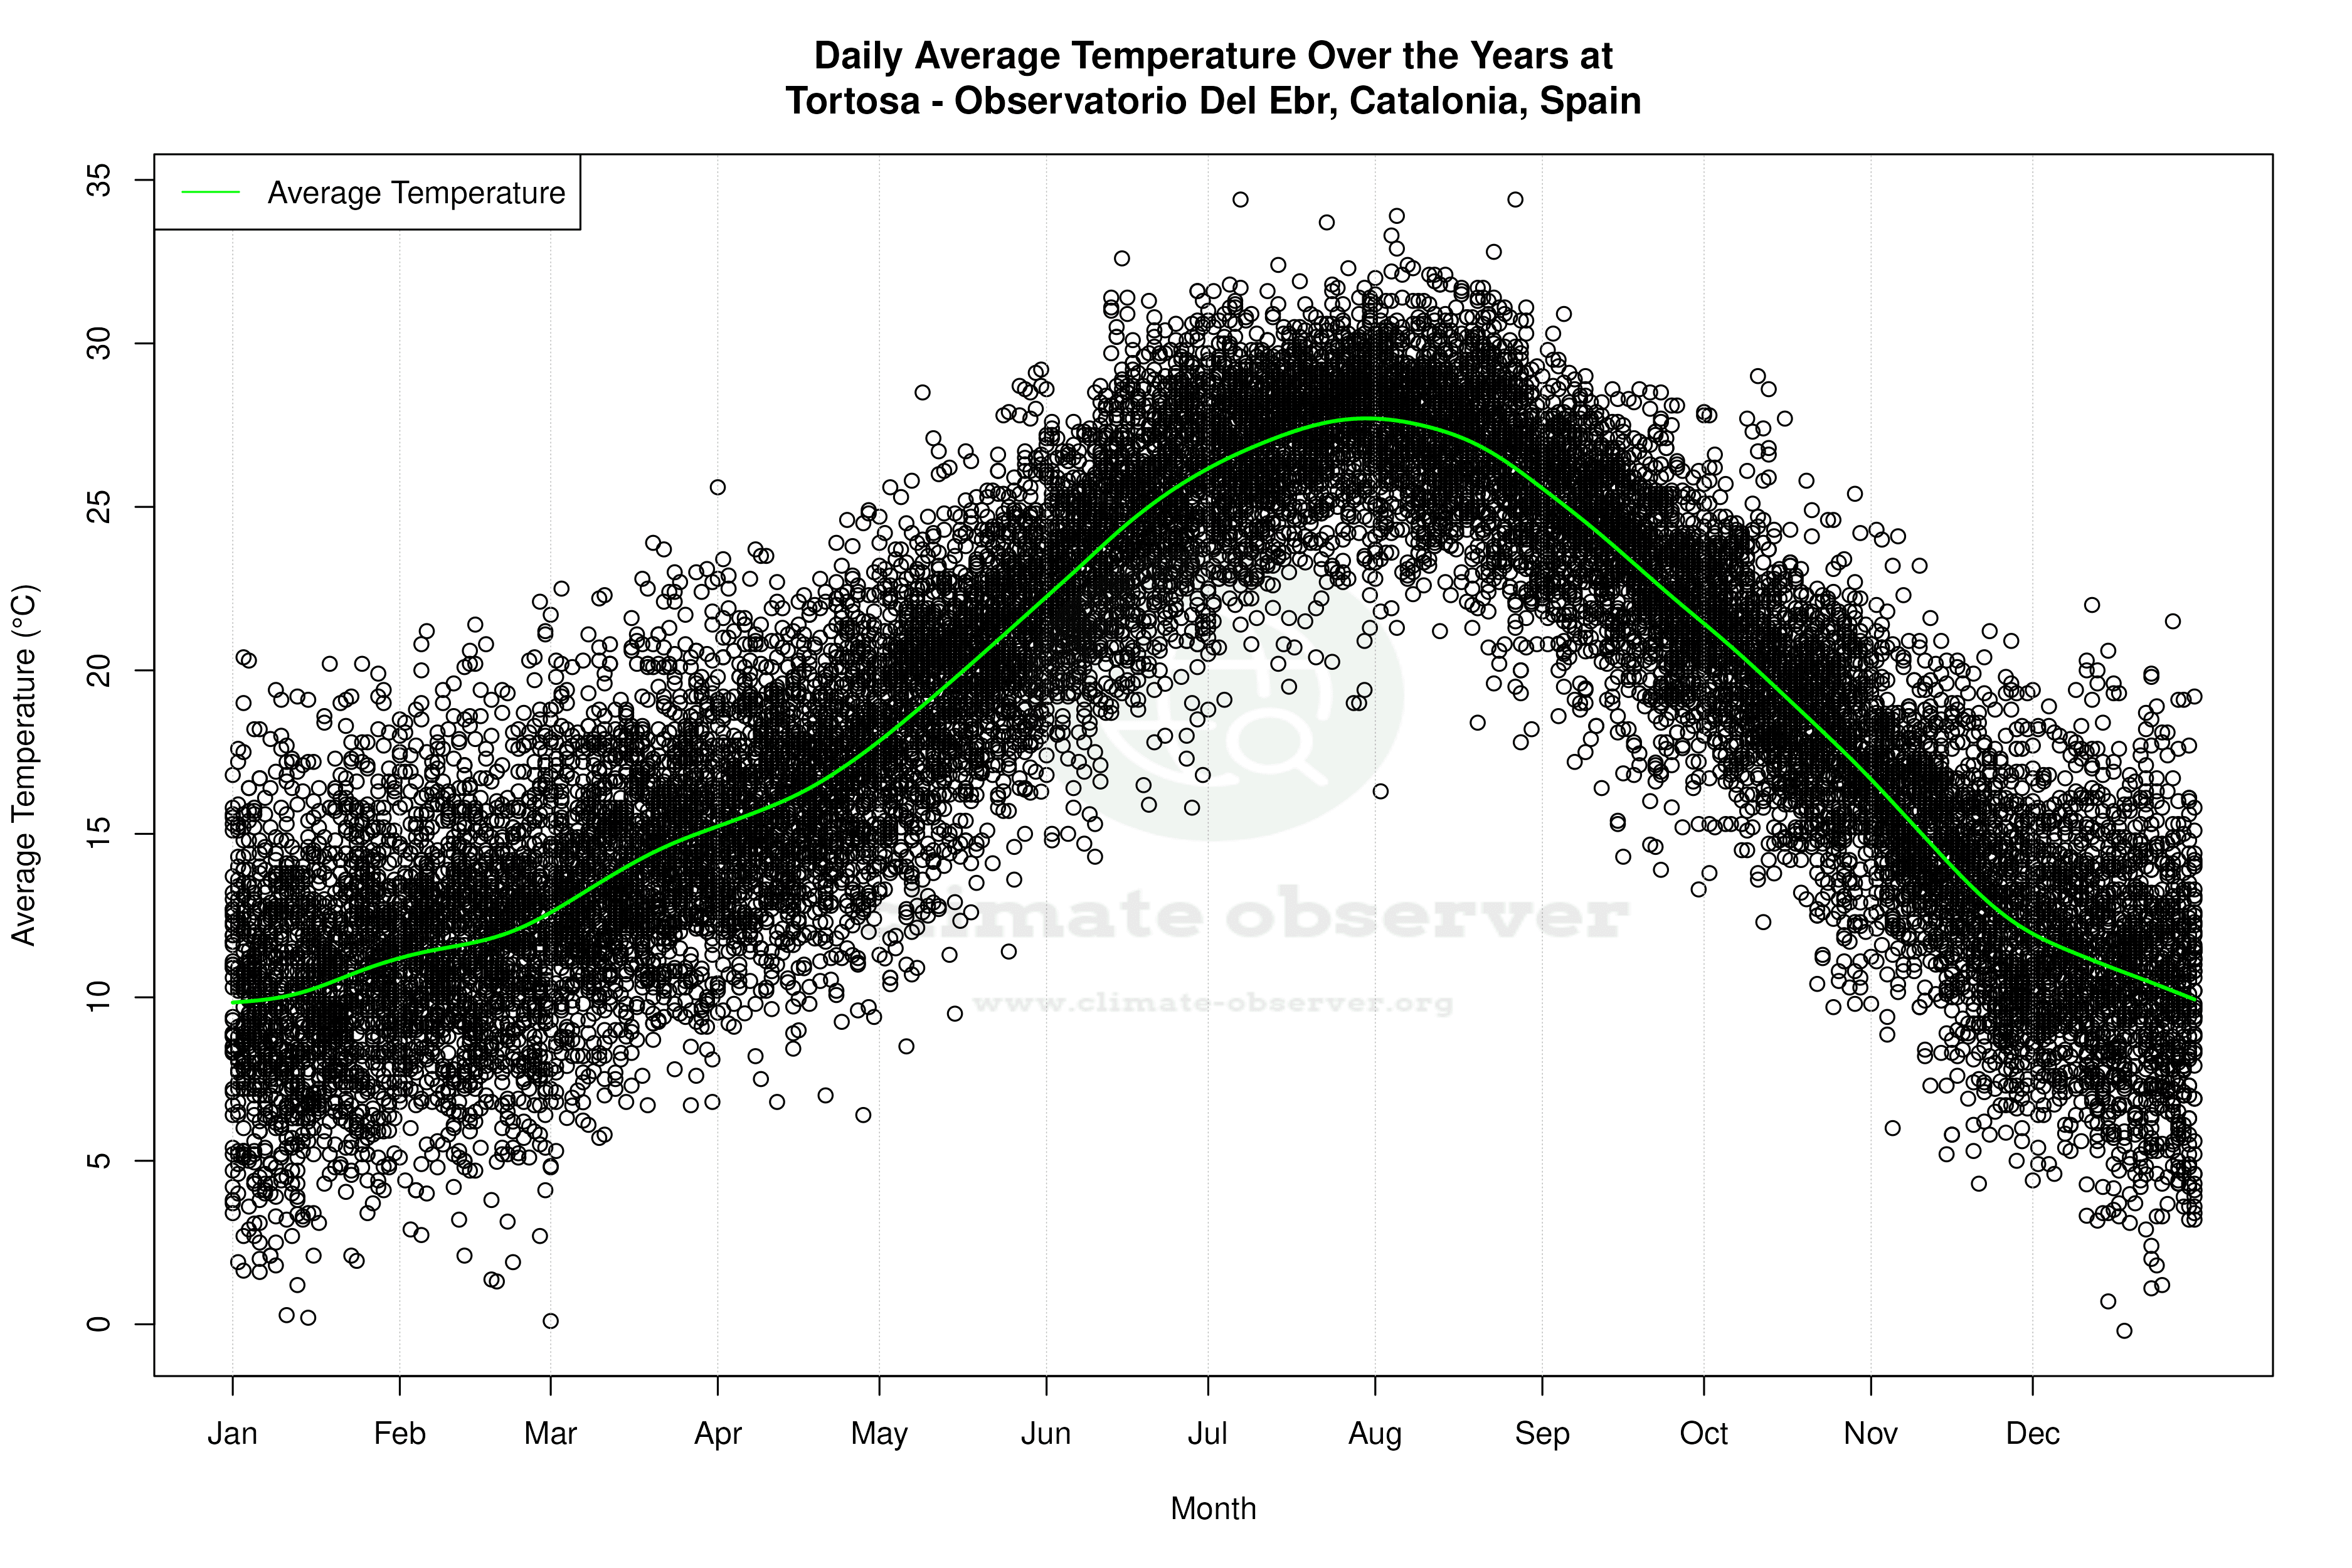
Tortosa, located in the Baix Ebre region of Catalunya, Spain, is characterised by a Mediterranean climate (Köppen classification Csa), marked by hot, dry summers and mild, wet winters. The station's proximity to the Ebro River and nearby mountains influences its microclimate, moderating temperatures and affecting precipitation patterns. Over the past decade, the region has experienced a warming trend, with high temperatures increasing by 0.95°C (1.71°F) and low temperatures by 0.98°C (1.77°F). This trend is more pronounced than the all-time warming, where highs have risen by 0.19°C (0.34°F) and lows by 0.18°C (0.32°F). These changes are indicative of broader climatic shifts impacting the Mediterranean basin.
Temperature Extremes and Records
The region has recorded significant temperature extremes, with an all-time high of 43.9°C (111.0°F) and a low of -7.5°C (18.5°F). These records highlight the variability and potential for extreme weather events in the area. The observed warming trends suggest an increased likelihood of such extremes, which could pose challenges for local agriculture and water resources, key components of the region's economy.
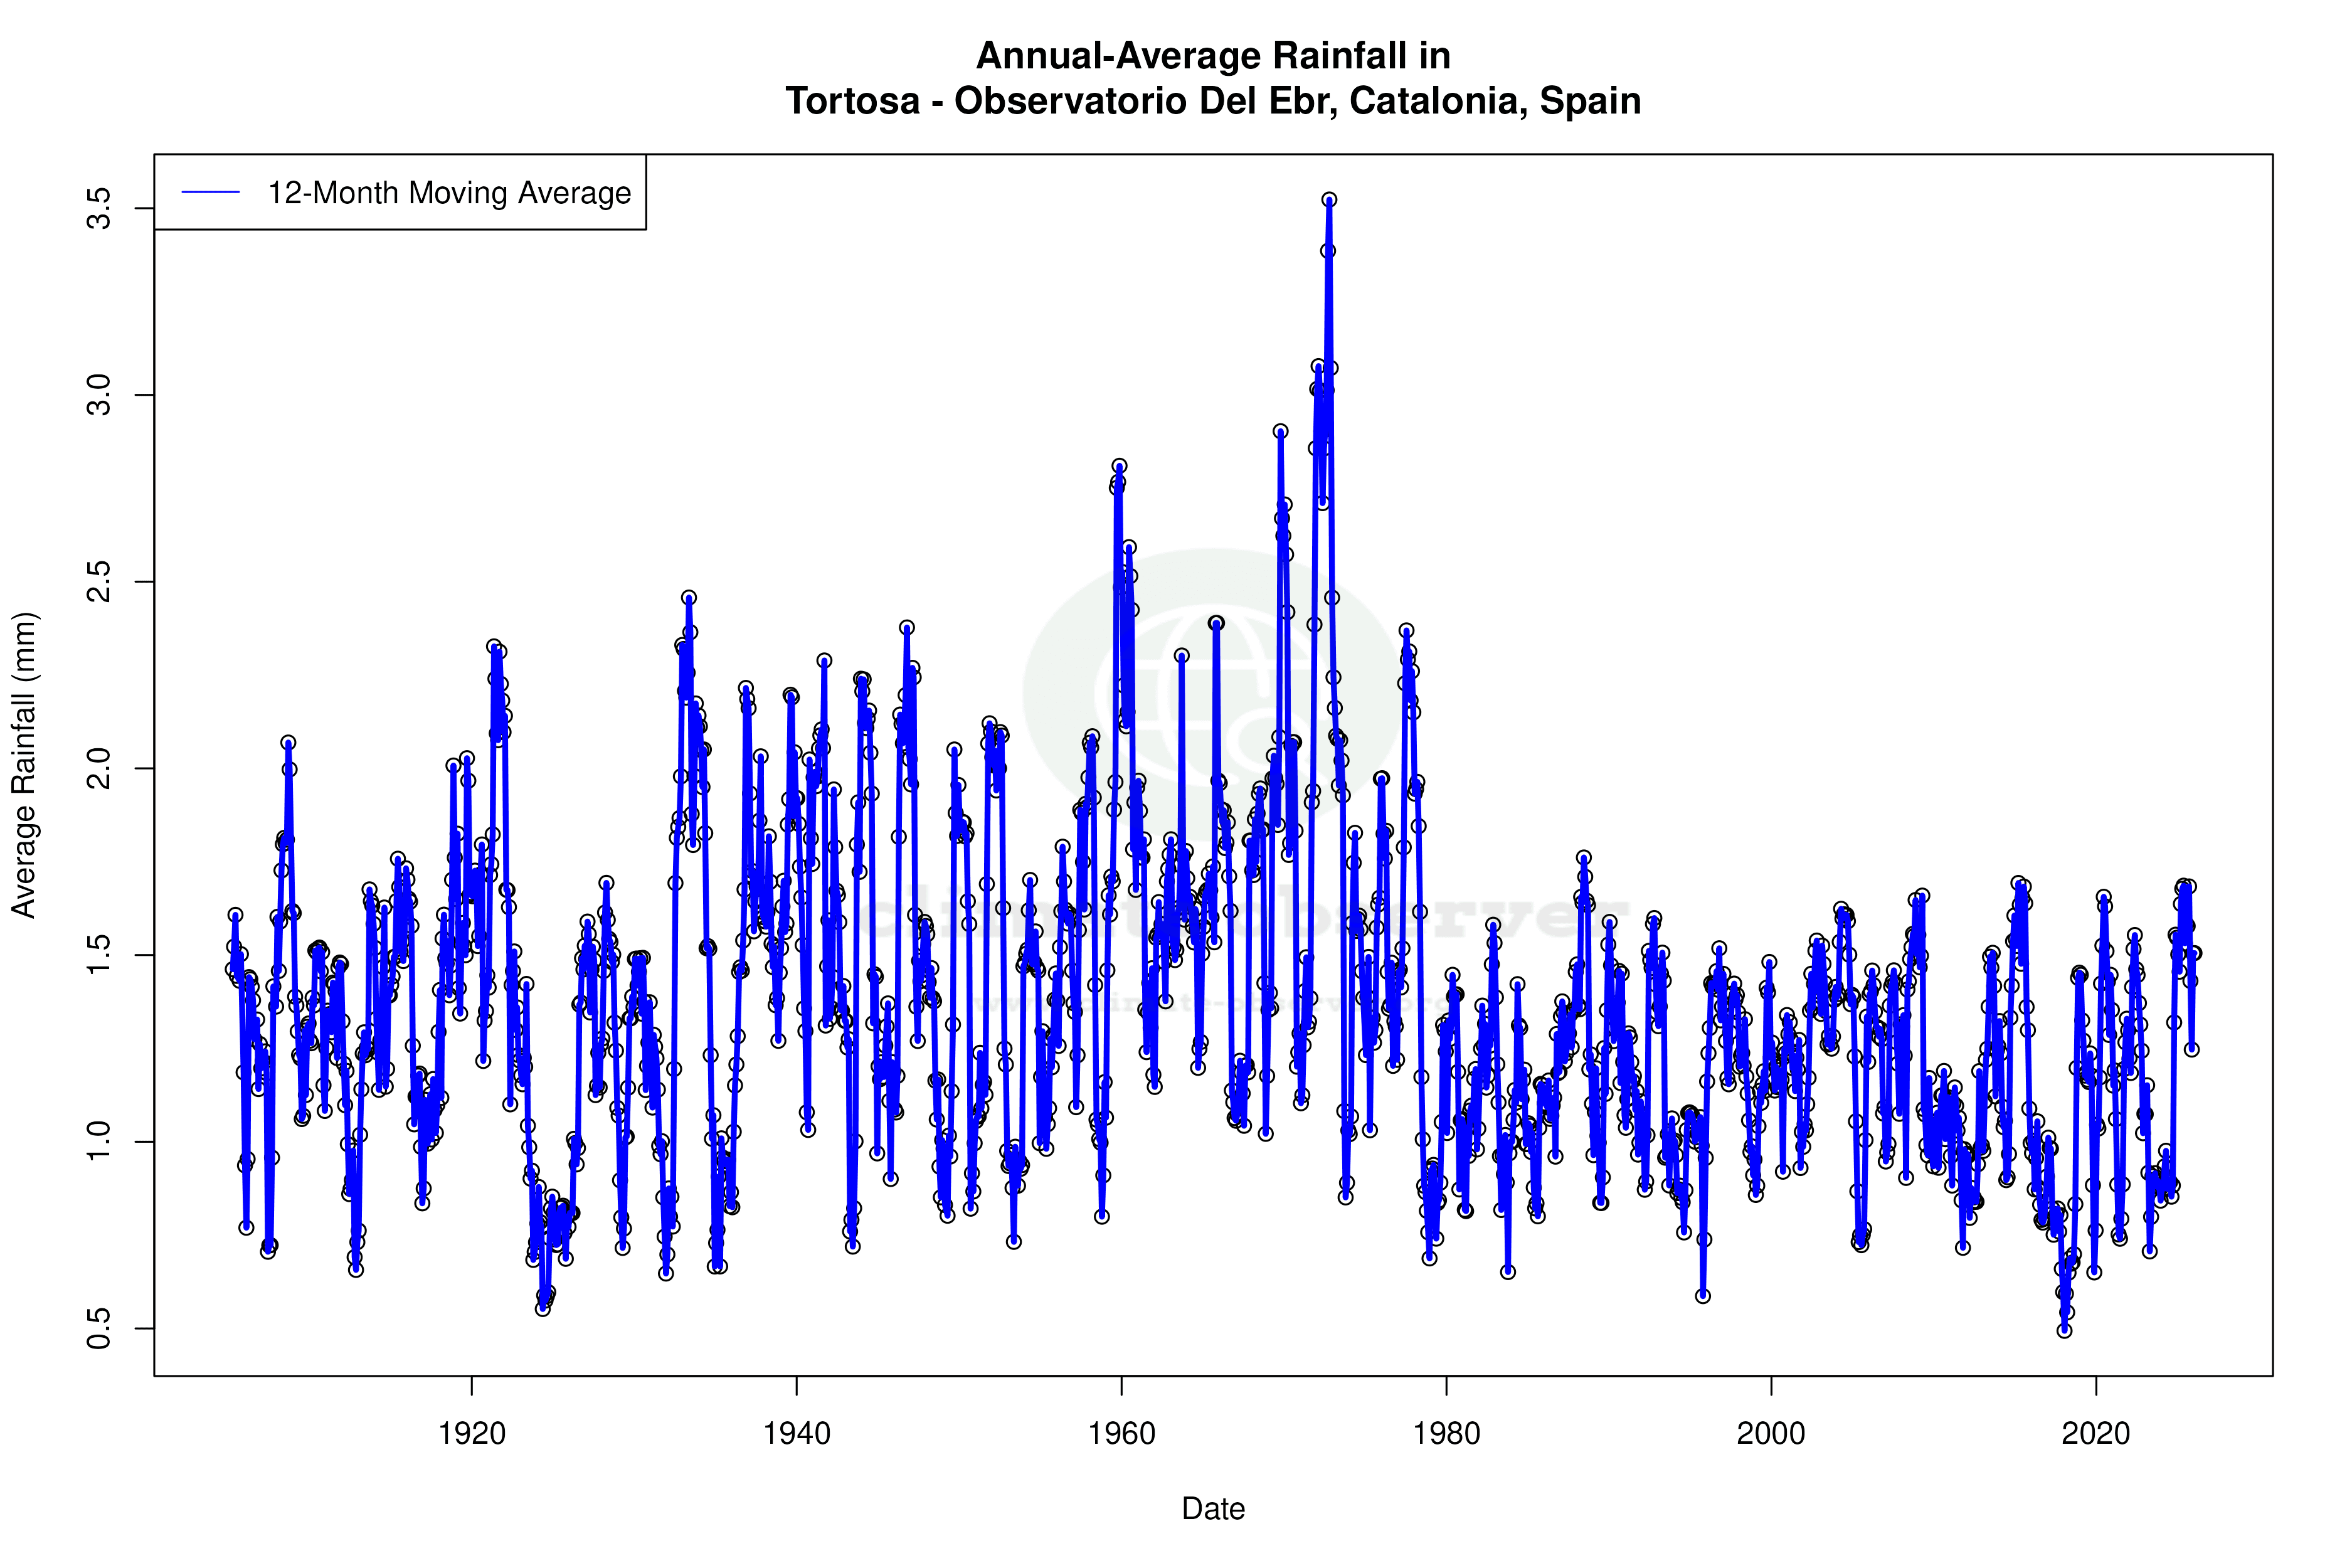
Precipitation Patterns and Distribution
The Precipitation Concentration Index (PCI) provides insight into the distribution of rainfall over time. A decrease in PCI from a baseline of 14.8 to a current value of 11.6 indicates a more even distribution of precipitation events. This shift suggests that rainfall is becoming less concentrated in intense, short-duration events and more spread out over time. Such a change can benefit local agriculture by reducing the risk of flash floods and improving water availability for crops.
Regional Climate Goals and Adaptation
Spain's regional climate goals focus on enhancing resilience to climate change impacts. The observed trends at Tortosa - Observatorio Del Ebr align with these objectives, as the region adapts to warmer temperatures and altered precipitation patterns. Efforts to mitigate these impacts include implementing water management strategies and promoting sustainable agricultural practices. Recent weather events, such as heatwaves and droughts, underscore the urgency of these initiatives.
Implications for the Future
As the climate continues to evolve, understanding these trends is crucial for planning and adaptation. The warming observed in Tortosa reflects broader global patterns, necessitating coordinated efforts to address the challenges posed by climate change. The region's ability to adapt will depend on the effective integration of climate science into policy and practice, ensuring sustainable development in the face of ongoing environmental changes.
Station Statistics
10-Year Trend
High: +1.49 °F/decade
Low: +1.84 °F/decade
Rain: +0.026 in/decade
25-Year Trend
High: +1.41 °F/decade
Low: +0.79 °F/decade
Rain: -0.001 in/decade
50-Year Trend
High: +0.96 °F/decade
Low: +0.69 °F/decade
Rain: -0.001 in/decade
All-Time Trend
High: +0.34 °F/decade
Low: +0.32 °F/decade
Rain: -0.001 in/decade
Percentage Above-Average Days
Last 12 Months: 52.3%
This Year: 53.3%
Precipitation Concentration Index (PCI) ℹ️
Last 12 Months: 15.0
Historical Average: 16.6
Percentile Rank of Last 12 Months ℹ️
High: 97th percentile
Low: 99th percentile
Rain: 79th percentile
Change in Variance ℹ️
High: +13.4%
Low: +2.5%
Intraday: +16.9%
Data Coverage
85.4%
First Year of Data
1905
Station Location
Historical Weather Records
| Max High | Avg High | Min High | Max Avg | Avg Avg | Min Avg | Max Low | Avg Low | Min Low | Max Precipitation | Avg Precipitation | Max Snow | Avg Snow | |
|---|---|---|---|---|---|---|---|---|---|---|---|---|---|
| Record | 111.02 °F | — | 32.90 °F | 93.92 °F | — | 31.64 °F | 80.24 °F | — | 18.50 °F | 10.43 in | — | — | — |
| January | 82.58 °F | 57.77 °F | 35.24 °F | 68.72 °F | 50.67 °F | 32.36 °F | 65.30 °F | 40.36 °F | 20.84 °F | 2.99 in | 0.03 in | — | — |
| February | 80.96 °F | 60.91 °F | 32.90 °F | 71.78 °F | 53.03 °F | 34.36 °F | 61.70 °F | 41.72 °F | 18.50 °F | 3.93 in | 0.04 in | — | — |
| March | 90.50 °F | 65.82 °F | 36.32 °F | 75.02 °F | 57.22 °F | 32.18 °F | 65.30 °F | 45.02 °F | 27.50 °F | 2.37 in | 0.05 in | — | — |
| April | 95.36 °F | 70.57 °F | 47.12 °F | 78.08 °F | 61.32 °F | 43.52 °F | 66.56 °F | 49.12 °F | 27.14 °F | 2.63 in | 0.06 in | — | — |
| May | 96.98 °F | 76.44 °F | 50.36 °F | 84.56 °F | 67.89 °F | 47.30 °F | 70.88 °F | 55.18 °F | 37.58 °F | 4.70 in | 0.07 in | — | — |
| June | 108.32 °F | 83.95 °F | 60.44 °F | 90.68 °F | 75.79 °F | 57.74 °F | 77.36 °F | 61.98 °F | 46.40 °F | 4.77 in | 0.05 in | — | — |
| July | 110.48 °F | 89.10 °F | 66.02 °F | 93.92 °F | 80.88 °F | 65.84 °F | 78.26 °F | 67.03 °F | 52.70 °F | 3.40 in | 0.02 in | — | — |
| August | 111.02 °F | 89.39 °F | 68.72 °F | 93.92 °F | 80.62 °F | 61.34 °F | 80.24 °F | 67.78 °F | 53.42 °F | 3.66 in | 0.03 in | — | — |
| September | 106.52 °F | 83.58 °F | 58.46 °F | 87.62 °F | 74.41 °F | 55.94 °F | 75.56 °F | 62.98 °F | 47.66 °F | 10.43 in | 0.09 in | — | — |
| October | 94.10 °F | 74.95 °F | 53.06 °F | 84.20 °F | 66.67 °F | 49.46 °F | 75.74 °F | 55.62 °F | 37.76 °F | 8.24 in | 0.09 in | — | — |
| November | 84.20 °F | 64.92 °F | 42.08 °F | 75.74 °F | 57.49 °F | 39.74 °F | 69.08 °F | 47.72 °F | 28.40 °F | 5.52 in | 0.06 in | — | — |
| December | 76.82 °F | 58.58 °F | 34.52 °F | 71.60 °F | 51.69 °F | 31.64 °F | 68.18 °F | 42.48 °F | 23.00 °F | 4.14 in | 0.05 in | — | — |
Data Visualisations
Remove WatermarksCurrent Year Climate Trends vs Historical


Max Temperature this Year | 1 of 6
Climate 12-Month Moving Averages


Max Temperature 12-Month MA | 1 of 6
Daily Data Points and Averages Throughout the Year


Average Max Temperature Throughout Year | 1 of 5
