Climate for Station: Barencburg, Svalbard [Norway]
Loading live weather...
Climate Analysis & Overview
Barentsburg, nestled within the Arctic archipelago of Svalbard, is witnessing a subtle warming trend over the long term, with a more recent cooling pattern. Precipitation is becoming more evenly distributed, indicating changes in local weather dynamics.
Arctic Thermal Dynamics
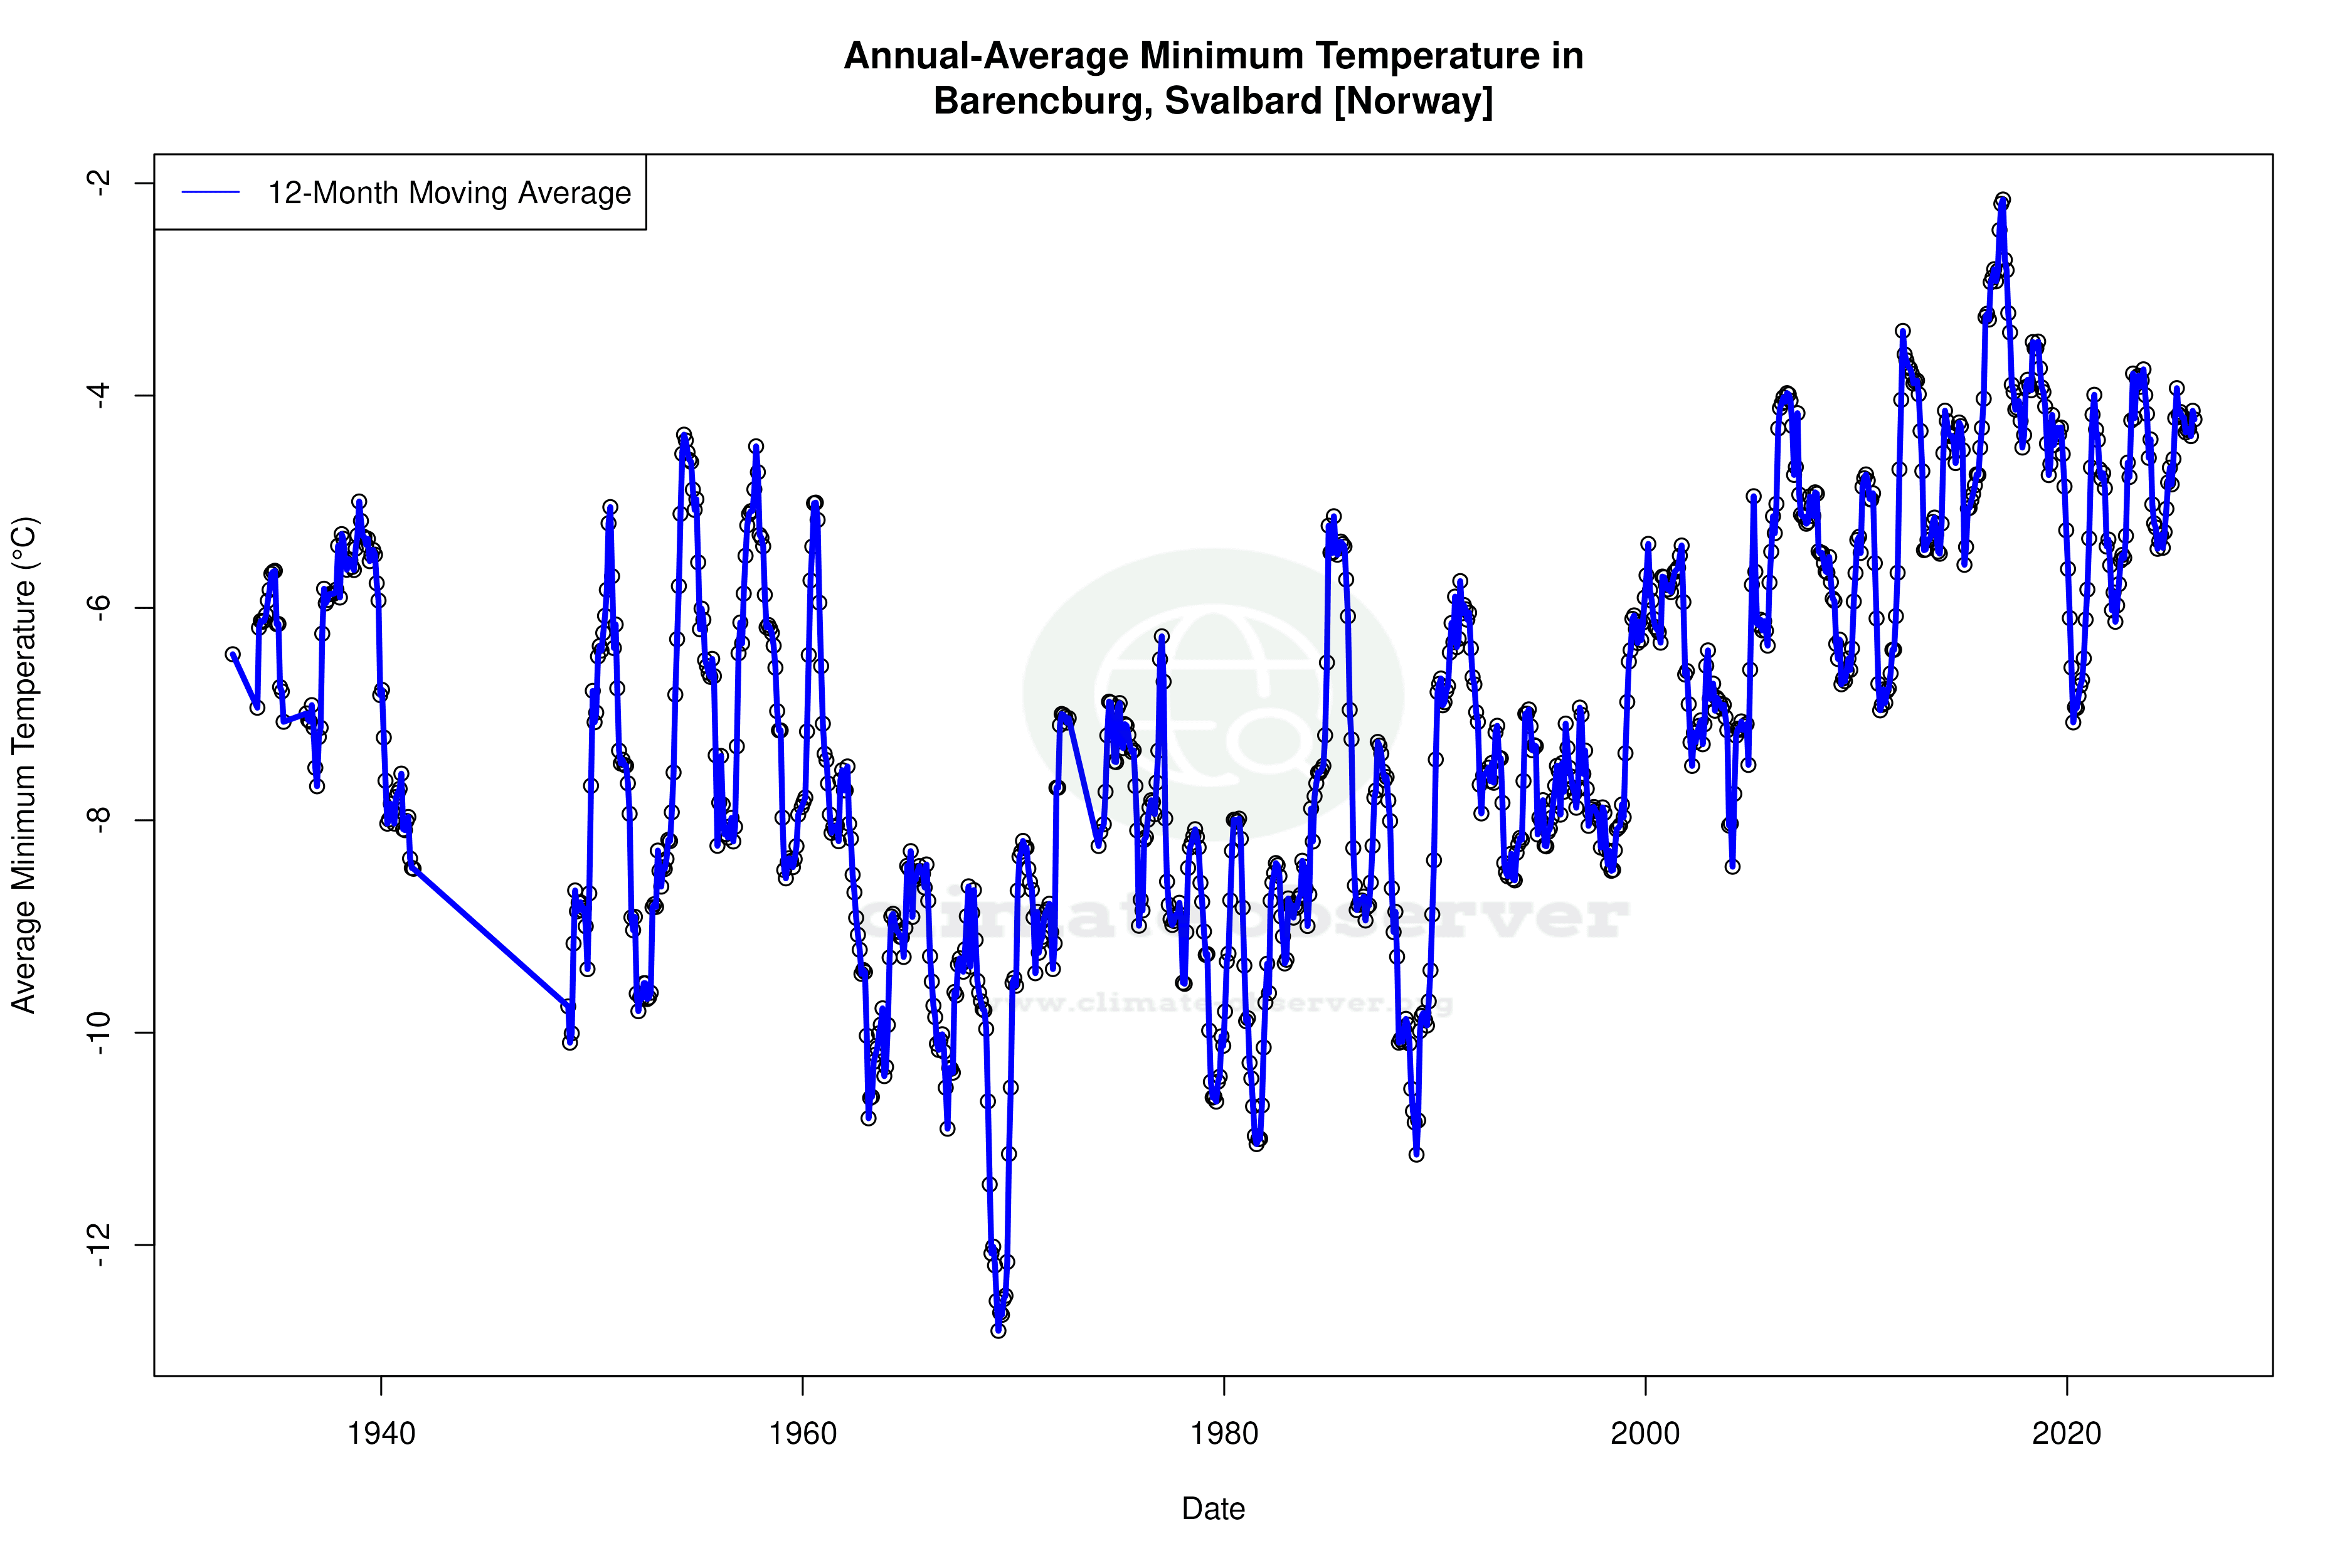
Barentsburg, located at 78.1°N, 14.3°E, experiences a polar tundra climate, classified as ET in the Köppen climate system. This classification is characterised by long, harsh winters and short, cool summers. The all-time temperature trends reveal a warming of 0.21°C (0.38°F) for highs and 0.34°C (0.61°F) for lows. This suggests a gradual rise in temperatures over the historical record. However, the recent 10-year trends tell a different story, with a cooling of -1.05°C (-1.88°F) in highs and -1.34°C (-2.41°F) in lows, indicating a short-term reversal of the long-term warming trend.
Precipitation Patterns Evolve
The Precipitation Concentration Index (PCI) is a measure of how precipitation is distributed over time. A decrease in PCI from a baseline of 10.89 to a current value of 9.01 indicates that precipitation events are becoming more evenly distributed throughout the year. This shift suggests a change in precipitation dynamics, potentially affecting local ecosystems and human activities. With a PCI under 10, Barentsburg's precipitation is now considered very even, a notable shift from past patterns.
Temperature Extremes and Records
Barentsburg's temperature records highlight the extremes of its polar climate. The highest recorded temperature is 19.5°C (67.1°F), while the lowest is a frigid -39.8°C (-39.6°F). These extremes underscore the variability and harshness of the Arctic environment, where temperatures can swing dramatically between seasons.
Regional Climate Context
Svalbard, as part of Norway, is committed to regional climate goals aimed at mitigating the impacts of climate change. The observed warming trend aligns with broader Arctic warming, a region experiencing some of the most rapid climate changes on Earth. Recent weather events, such as unusual winter thaws or prolonged cold spells, provide a backdrop to Barentsburg's climate data, illustrating the complexities of Arctic climate dynamics.
Implications for the Future
The contrasting trends in Barentsburg's climate data highlight the challenges of understanding and predicting Arctic climate changes. While the long-term warming trend is consistent with global patterns, the recent cooling suggests localised factors at play. These trends have implications for local wildlife, human habitation, and future research priorities in the region.
Station Statistics
10-Year Trend
High: -1.47 °F/decade
Low: -1.72 °F/decade
Rain: -0.031 in/decade
25-Year Trend
High: +1.17 °F/decade
Low: +1.59 °F/decade
Rain: -0.002 in/decade
50-Year Trend
High: +1.31 °F/decade
Low: +1.93 °F/decade
Rain: -0.001 in/decade
All-Time Trend
High: +0.39 °F/decade
Low: +0.62 °F/decade
Rain: +0.001 in/decade
Percentage Above-Average Days
Last 12 Months: 64.9%
This Year: 29.5%
Precipitation Concentration Index (PCI) ℹ️
Last 12 Months: 9.9
Historical Average: 11.8
Percentile Rank of Last 12 Months ℹ️
High: 91st percentile
Low: 93rd percentile
Rain: 15th percentile
Change in Variance ℹ️
High: -20.3%
Low: -28.3%
Intraday: -44.3%
Data Coverage
92.7%
First Year of Data
1932
Station Location
Historical Weather Records
| Max High | Avg High | Min High | Max Avg | Avg Avg | Min Avg | Max Low | Avg Low | Min Low | Max Precipitation | Avg Precipitation | Max Snow | Avg Snow | |
|---|---|---|---|---|---|---|---|---|---|---|---|---|---|
| Record | 67.10 °F | — | -30.64 °F | 59.54 °F | — | -34.24 °F | 53.78 °F | — | -39.64 °F | 1.84 in | — | — | — |
| January | 44.24 °F | 16.15 °F | -27.04 °F | 37.76 °F | 10.71 °F | -31.90 °F | 35.78 °F | 5.18 °F | -34.78 °F | 1.30 in | 0.07 in | — | — |
| February | 42.08 °F | 15.43 °F | -27.58 °F | 37.76 °F | 9.73 °F | -33.88 °F | 36.14 °F | 3.87 °F | -38.74 °F | 1.43 in | 0.06 in | — | — |
| March | 45.50 °F | 14.39 °F | -30.64 °F | 37.22 °F | 8.87 °F | -34.24 °F | 34.52 °F | 3.35 °F | -39.64 °F | 1.38 in | 0.06 in | — | — |
| April | 56.48 °F | 19.49 °F | -18.40 °F | 38.30 °F | 14.12 °F | -23.62 °F | 35.06 °F | 9.13 °F | -27.94 °F | 0.91 in | 0.05 in | — | — |
| May | 49.82 °F | 29.85 °F | 1.40 °F | 44.60 °F | 25.96 °F | -1.66 °F | 42.08 °F | 22.50 °F | -8.50 °F | 0.81 in | 0.04 in | — | — |
| June | 58.28 °F | 39.42 °F | 24.44 °F | 50.90 °F | 36.02 °F | 18.86 °F | 47.48 °F | 33.38 °F | 15.44 °F | 0.87 in | 0.03 in | — | — |
| July | 67.10 °F | 46.77 °F | 36.86 °F | 59.54 °F | 42.70 °F | 33.44 °F | 53.78 °F | 39.69 °F | 30.74 °F | 1.12 in | 0.03 in | — | — |
| August | 64.22 °F | 44.76 °F | 31.46 °F | 58.28 °F | 41.15 °F | 29.30 °F | 53.42 °F | 38.43 °F | 25.70 °F | 1.82 in | 0.05 in | — | — |
| September | 53.78 °F | 37.31 °F | 18.68 °F | 49.46 °F | 34.11 °F | 15.80 °F | 45.68 °F | 31.28 °F | 10.04 °F | 1.32 in | 0.07 in | — | — |
| October | 47.30 °F | 28.54 °F | -1.12 °F | 44.24 °F | 24.89 °F | -12.64 °F | 42.44 °F | 21.24 °F | -16.78 °F | 1.84 in | 0.07 in | — | — |
| November | 48.56 °F | 23.12 °F | -11.02 °F | 41.72 °F | 18.64 °F | -16.78 °F | 37.22 °F | 14.04 °F | -20.74 °F | 1.66 in | 0.08 in | — | — |
| December | 55.04 °F | 19.22 °F | -20.02 °F | 39.92 °F | 14.20 °F | -29.74 °F | 36.86 °F | 9.17 °F | -35.14 °F | 1.71 in | 0.07 in | — | — |
Data Visualisations
Remove WatermarksCurrent Year Climate Trends vs Historical


Max Temperature this Year | 1 of 6
Climate 12-Month Moving Averages


Max Temperature 12-Month MA | 1 of 6
Daily Data Points and Averages Throughout the Year

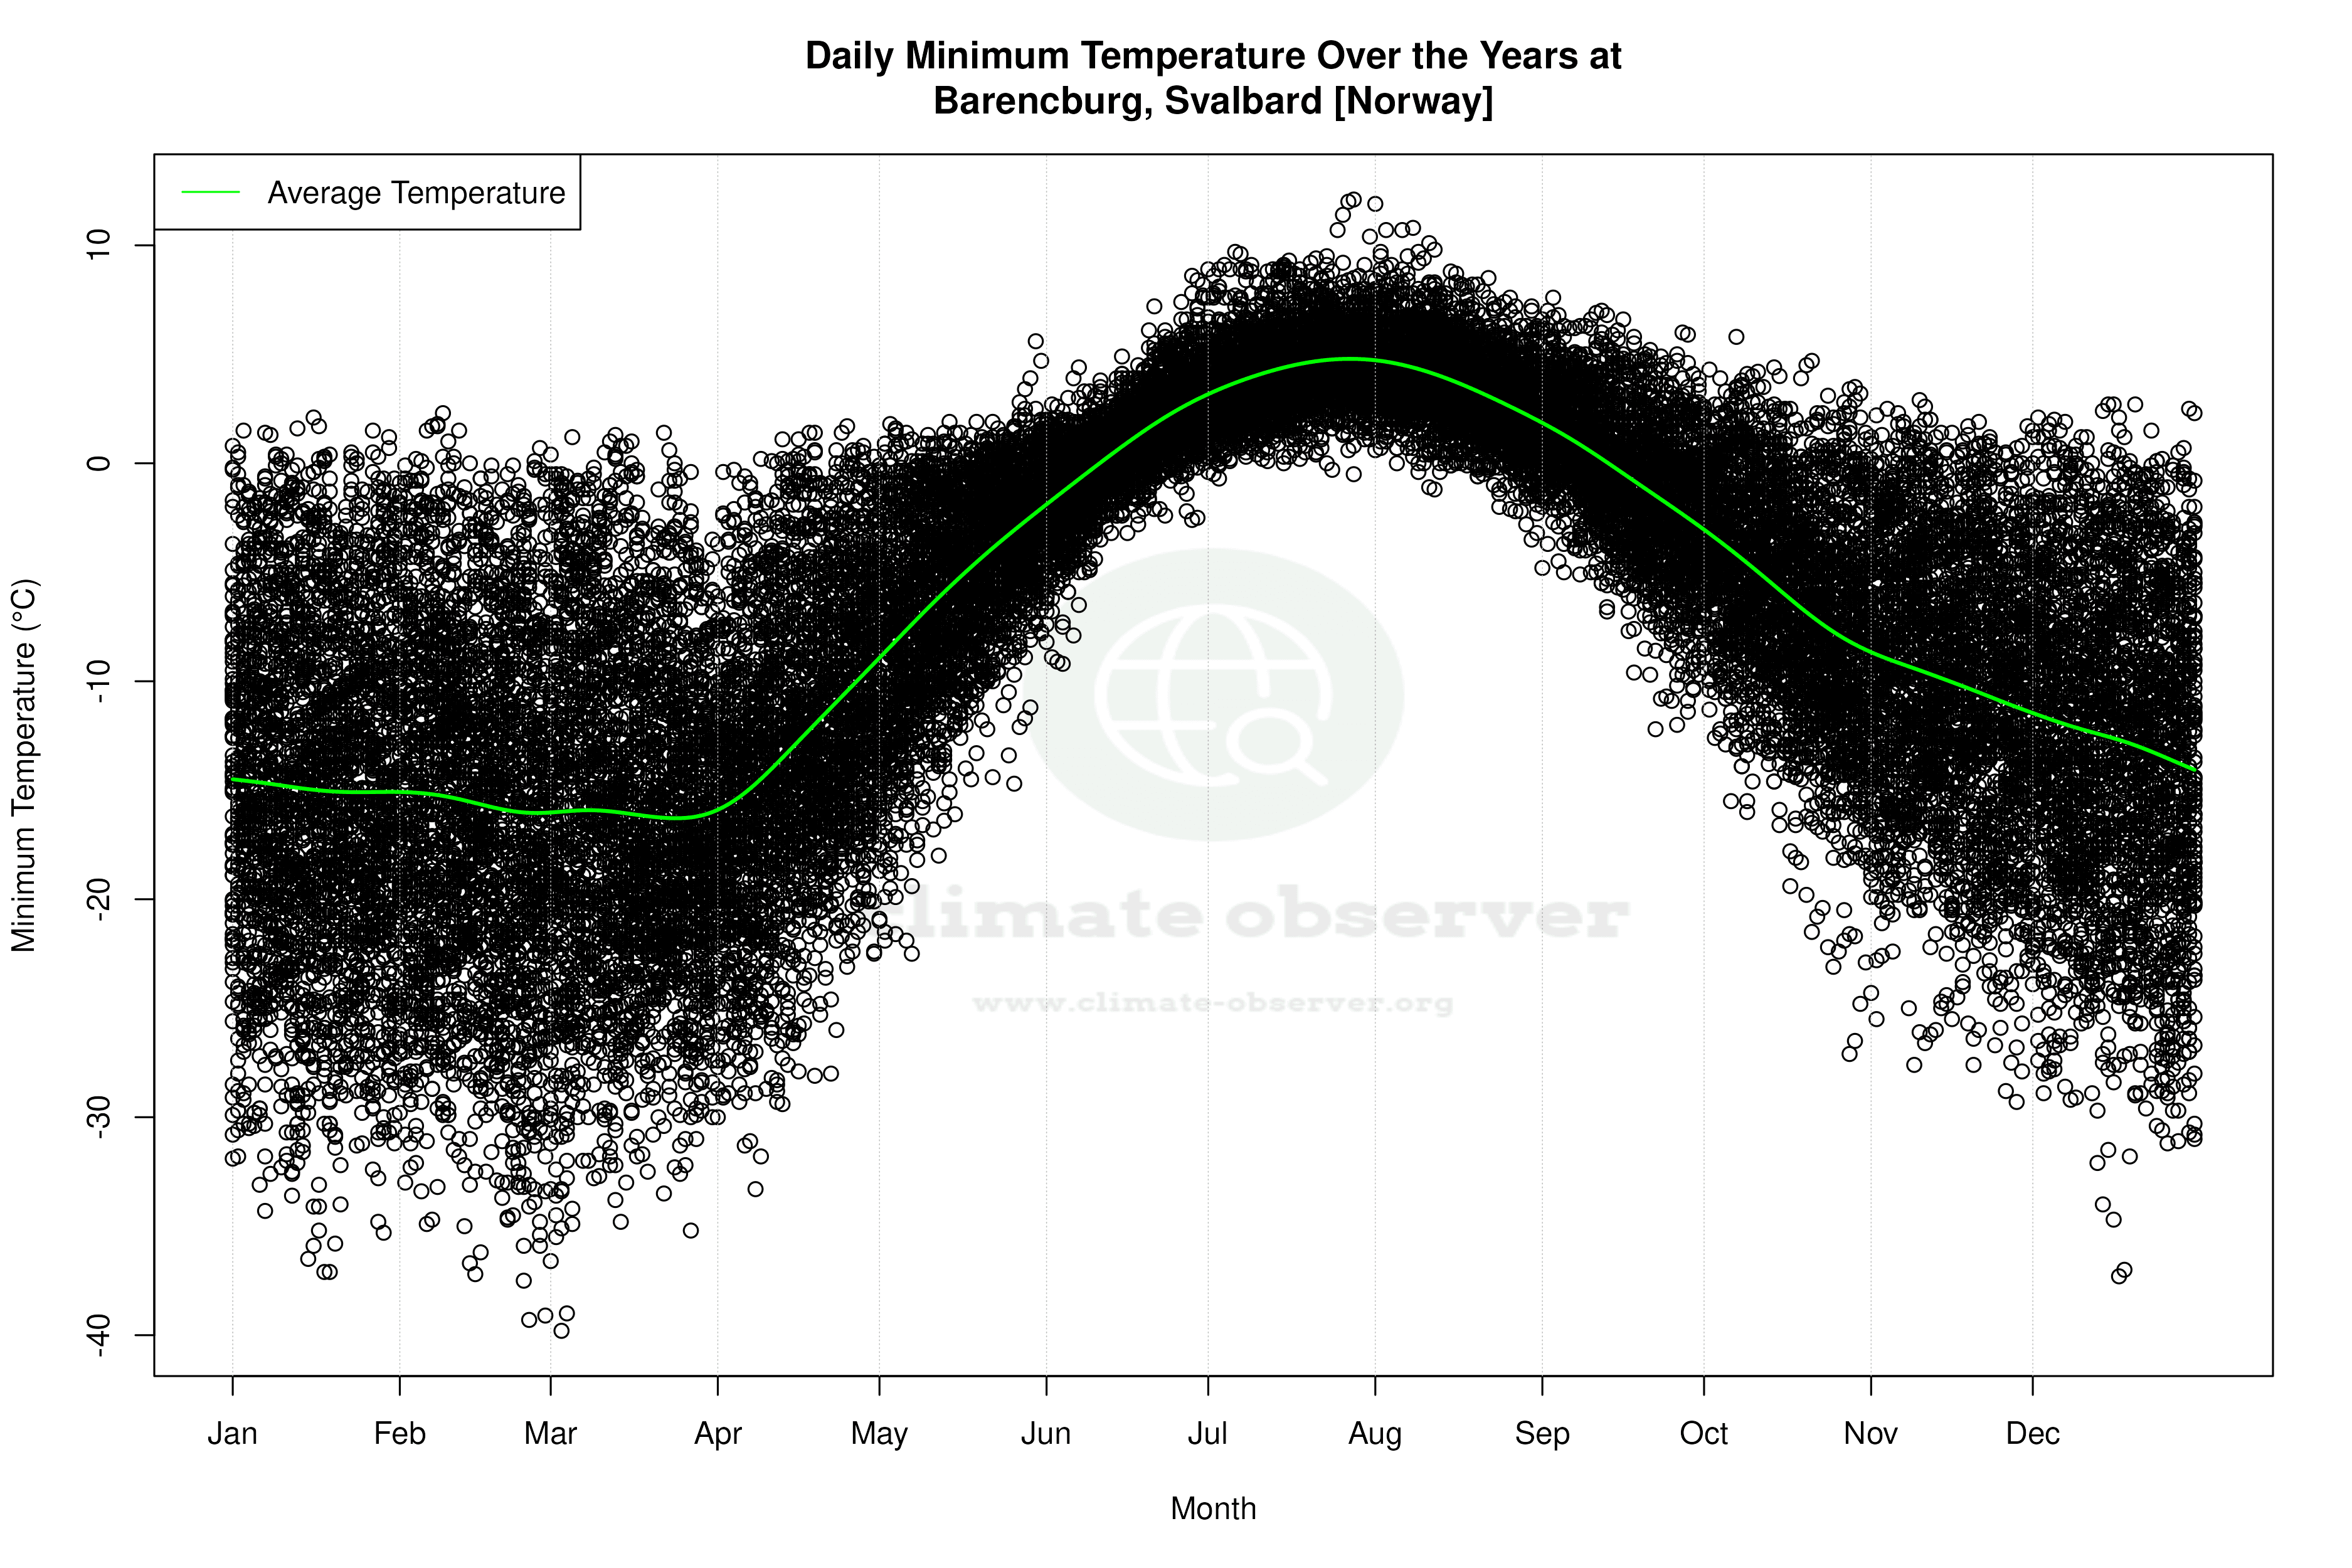


Average Max Temperature Throughout Year | 1 of 5
