Climate for Station: Jonkopings_flygplats, Sweden
Loading live weather...
Climate Analysis & Overview
The climate at Jönköping Airport is marked by a warming trend, with high temperatures rising by 0.21°C (0.38°F) over the long term, and a more pronounced increase of 0.63°C (1.13°F) over the past decade. The Precipitation Concentration Index has decreased, indicating a more even distribution of rainfall. These changes align with Sweden's climate goals of reducing climate impact and adapting to new weather patterns.
Köppen Climate Context and Local Geography
Jönköping Airport, located at 57.75°N, 14.07°E, falls under the Dfb classification in the Köppen climate system, indicative of a humid continental climate with no dry season and a warm summer. The airport's proximity to Lake Vättern influences its local climate, moderating temperatures and contributing to a more stable weather pattern. This geographical setting plays a crucial role in the observed temperature trends and precipitation patterns.
Thermal Trends: A Decade of Change
Over the past decade, Jönköping Airport has experienced a noticeable warming trend. High temperatures have increased by 0.63°C (1.13°F), while low temperatures have risen by 0.35°C (0.63°F). This recent trend is more pronounced than the all-time warming, where highs have risen by 0.21°C (0.38°F) and lows by 0.21°C (0.38°F). These changes suggest an acceleration in warming, potentially impacting local ecosystems and human activities.
Precipitation Patterns: A More Even Distribution
The Precipitation Concentration Index (PCI) at Jönköping Airport has decreased from a baseline of 11.70 to a current value of 9.63. This reduction indicates a more even distribution of rainfall throughout the year, as opposed to being concentrated in fewer, more intense events. Such a shift can benefit agriculture and water management, aligning with Sweden's goals of sustainable resource use and climate adaptation.
Temperature Extremes: Record Highs and Lows
Jönköping Airport has recorded extreme temperatures with a maximum of 35.3°C (95.5°F) and a minimum of -35.4°C (-31.7°F). These records highlight the range of climatic conditions the region can experience. The warming trends observed may lead to more frequent occurrences of such extreme temperatures, necessitating preparedness measures to mitigate potential impacts.
Regional Climate Goals and Future Outlook
Sweden's commitment to reducing greenhouse gas emissions and adapting to climate change is reflected in the trends observed at Jönköping Airport. The warming trends and changes in precipitation distribution align with national efforts to address climate variability. As the region continues to adapt, monitoring these trends will be crucial for informing policy and ensuring resilience against future climatic shifts.
Station Statistics
10-Year Trend
High: +0.64 °F/decade
Low: +0.21 °F/decade
Rain: -0.025 in/decade
25-Year Trend
High: +1.33 °F/decade
Low: +1.40 °F/decade
Rain: -0.017 in/decade
50-Year Trend
High: +0.99 °F/decade
Low: +0.91 °F/decade
Rain: +0.001 in/decade
All-Time Trend
High: +0.29 °F/decade
Low: +0.34 °F/decade
Rain: +0.003 in/decade
Percentage Above-Average Days
Last 12 Months: 51.9%
This Year: 62.4%
Precipitation Concentration Index (PCI) ℹ️
Last 12 Months: 9.2
Historical Average: 11.0
Percentile Rank of Last 12 Months ℹ️
High: 86th percentile
Low: 86th percentile
Rain: 2nd percentile
Change in Variance ℹ️
High: -1.8%
Low: -13.6%
Intraday: -4.2%
Data Coverage
88.0%
First Year of Data
1951
Station Location
Historical Weather Records
| Max High | Avg High | Min High | Max Avg | Avg Avg | Min Avg | Max Low | Avg Low | Min Low | Max Precipitation | Avg Precipitation | Max Snow | Avg Snow | |
|---|---|---|---|---|---|---|---|---|---|---|---|---|---|
| Record | 95.54 °F | — | -16.56 °F | 79.16 °F | — | -10.12 °F | 68.18 °F | — | -31.72 °F | 2.88 in | — | — | — |
| January | 50.18 °F | 32.29 °F | -16.56 °F | 45.68 °F | 28.05 °F | -10.12 °F | 43.52 °F | 22.60 °F | -19.12 °F | 0.86 in | 0.06 in | — | — |
| February | 58.46 °F | 32.90 °F | 1.40 °F | 47.84 °F | 27.75 °F | -8.14 °F | 44.24 °F | 21.39 °F | -31.72 °F | 1.05 in | 0.05 in | — | — |
| March | 65.66 °F | 39.32 °F | 9.32 °F | 52.88 °F | 32.67 °F | -2.02 °F | 45.68 °F | 25.25 °F | -21.10 °F | 0.76 in | 0.05 in | — | — |
| April | 79.34 °F | 49.14 °F | 25.16 °F | 64.76 °F | 40.63 °F | 23.18 °F | 51.44 °F | 31.10 °F | 1.58 °F | 1.19 in | 0.05 in | — | — |
| May | 83.48 °F | 59.95 °F | 34.16 °F | 71.24 °F | 50.40 °F | 32.18 °F | 59.72 °F | 38.82 °F | 19.40 °F | 1.27 in | 0.07 in | — | — |
| June | 91.22 °F | 67.29 °F | 44.96 °F | 76.28 °F | 57.14 °F | 41.54 °F | 66.20 °F | 46.01 °F | 26.60 °F | 2.13 in | 0.09 in | — | — |
| July | 95.54 °F | 70.13 °F | 54.50 °F | 79.16 °F | 60.61 °F | 48.20 °F | 68.18 °F | 50.08 °F | 34.70 °F | 2.88 in | 0.10 in | — | — |
| August | 93.56 °F | 68.28 °F | 50.36 °F | 74.48 °F | 58.79 °F | 43.34 °F | 65.12 °F | 49.15 °F | 27.86 °F | 1.60 in | 0.10 in | — | — |
| September | 85.10 °F | 59.85 °F | 38.84 °F | 71.24 °F | 51.62 °F | 33.98 °F | 61.16 °F | 43.56 °F | 18.86 °F | 1.57 in | 0.09 in | — | — |
| October | 70.52 °F | 49.93 °F | 29.12 °F | 60.44 °F | 43.86 °F | 21.02 °F | 57.02 °F | 37.81 °F | 8.06 °F | 1.68 in | 0.08 in | — | — |
| November | 60.26 °F | 40.18 °F | 17.06 °F | 55.76 °F | 36.21 °F | 3.38 °F | 51.08 °F | 31.48 °F | -5.26 °F | 1.28 in | 0.08 in | — | — |
| December | 53.60 °F | 34.86 °F | 8.60 °F | 49.46 °F | 30.44 °F | -7.78 °F | 47.48 °F | 25.74 °F | -18.94 °F | 1.18 in | 0.07 in | — | — |
Data Visualisations
Remove WatermarksCurrent Year Climate Trends vs Historical
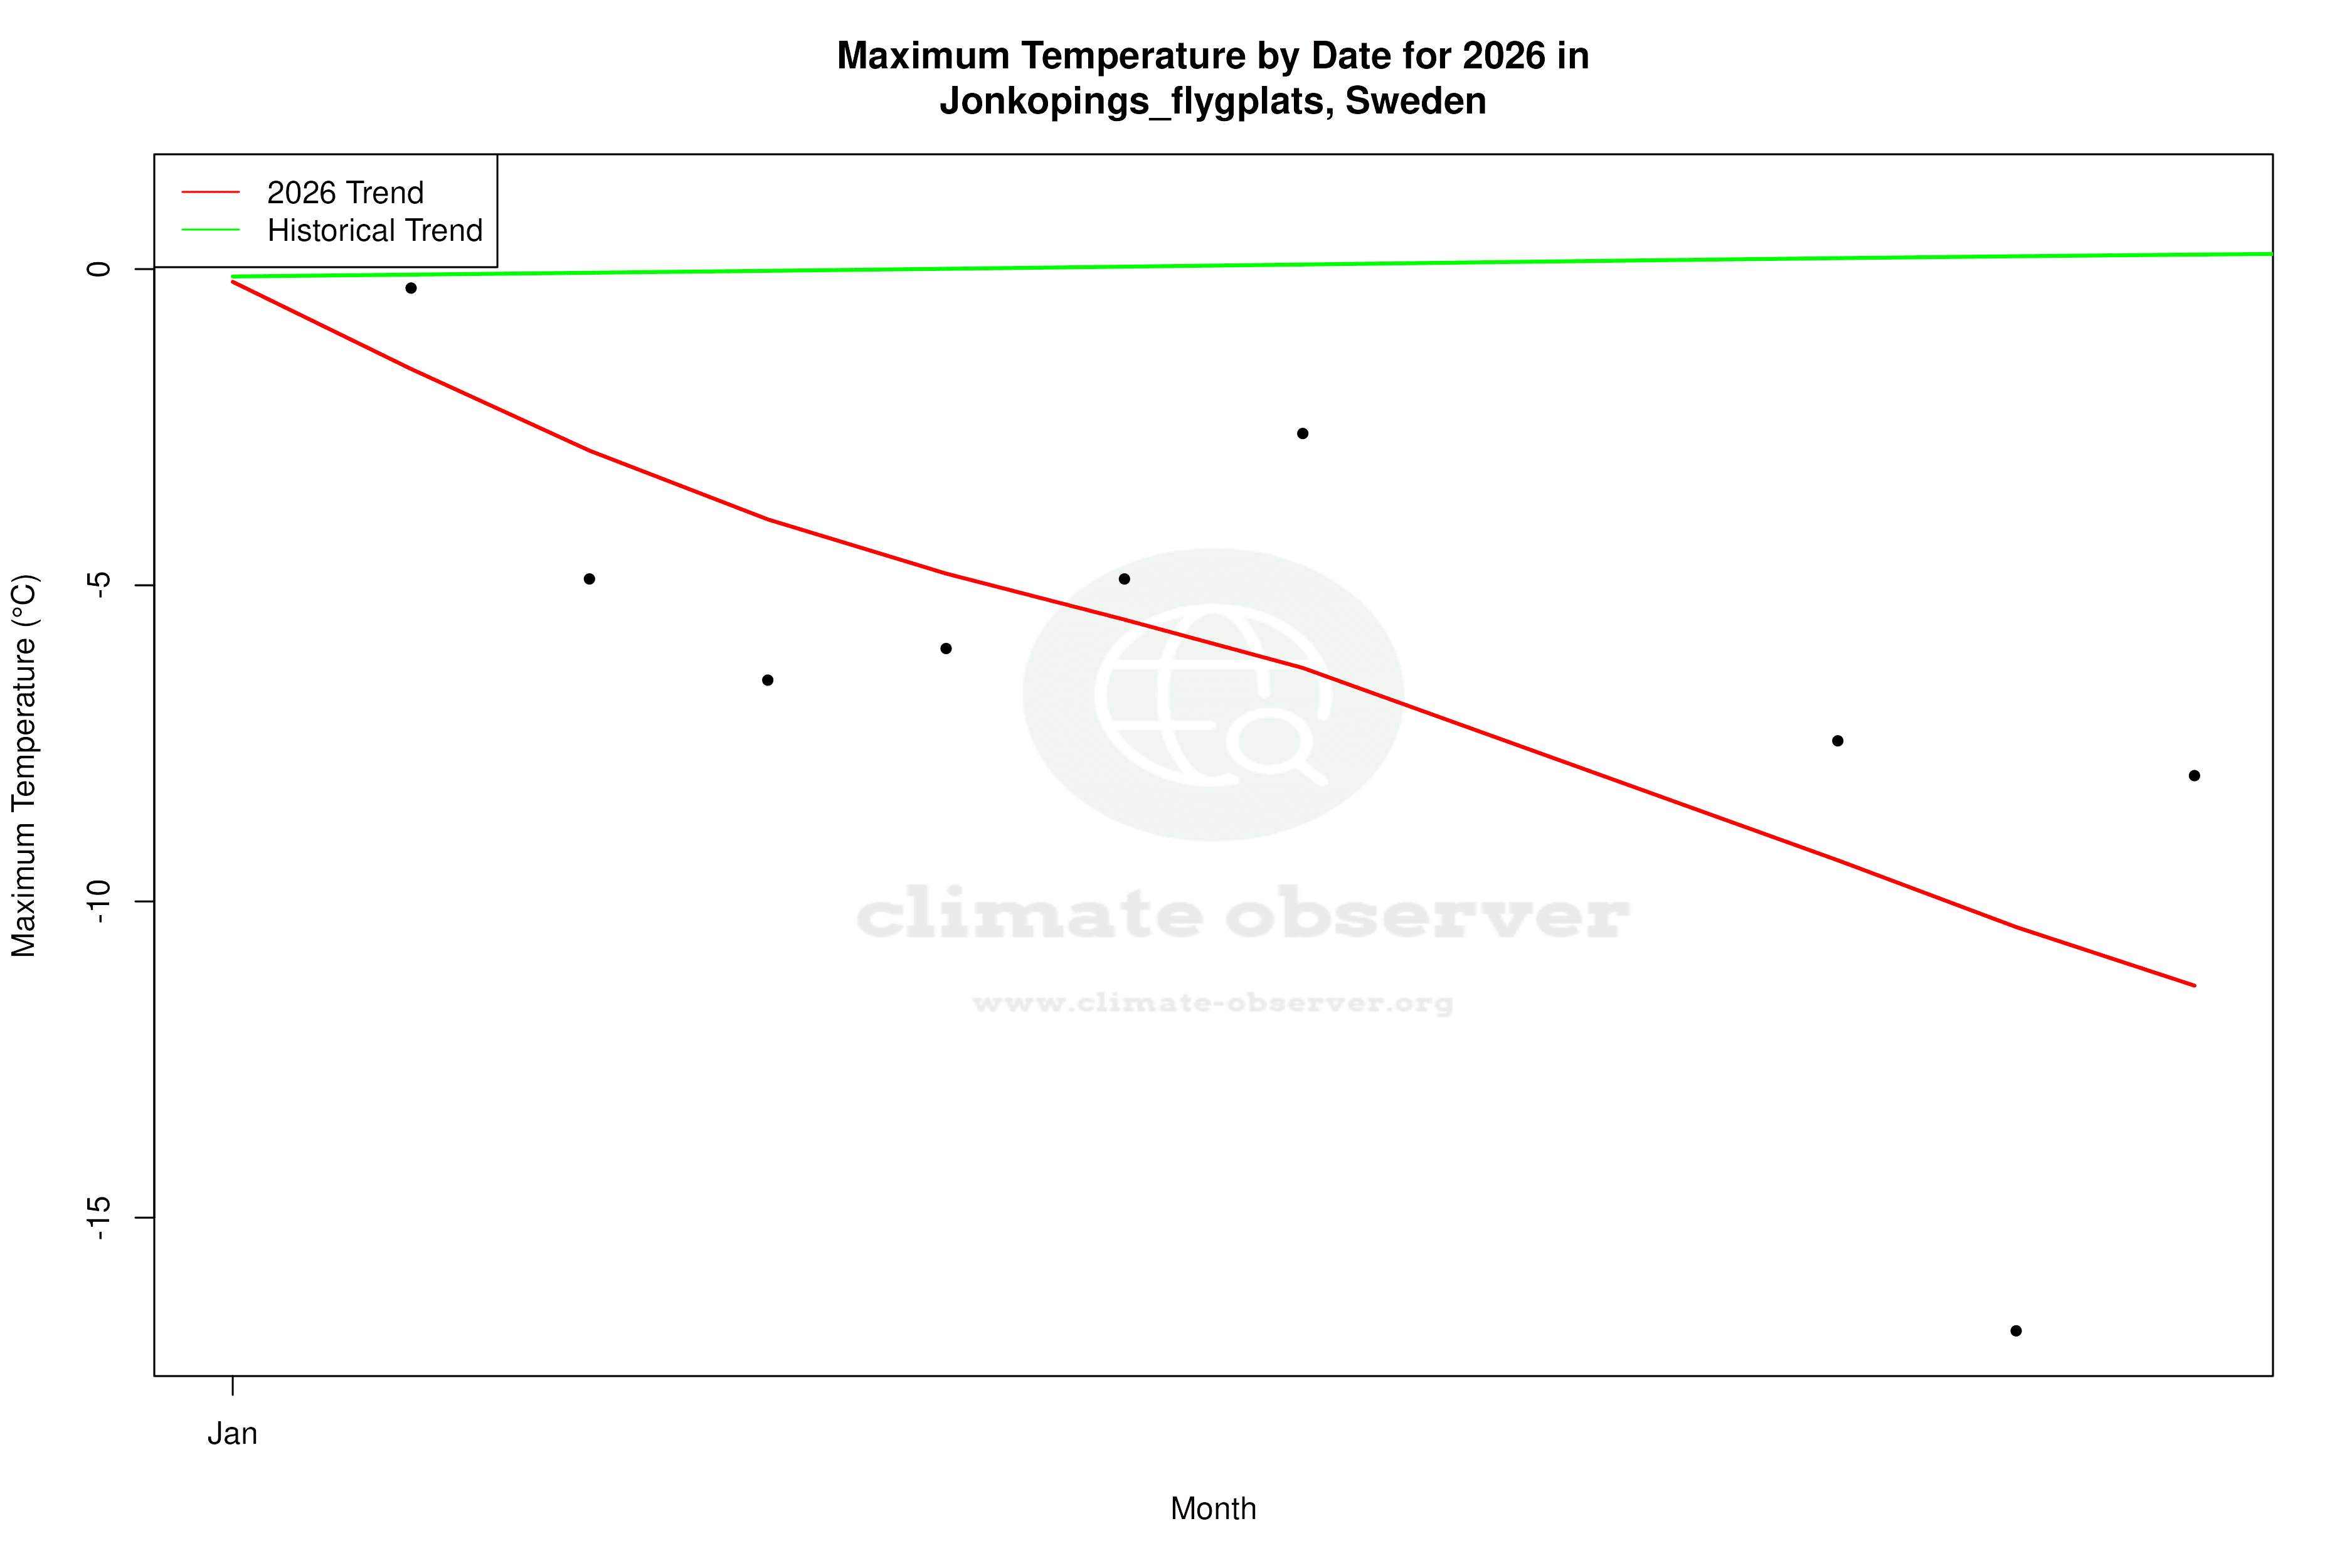


Max Temperature this Year | 1 of 6
Climate 12-Month Moving Averages


Max Temperature 12-Month MA | 1 of 6
Daily Data Points and Averages Throughout the Year


Average Max Temperature Throughout Year | 1 of 5
