Climate for Station: Lugano, Ticino, Switzerland
Loading live weather...
Climate Analysis & Overview
Lugano's climate profile reveals a nuanced interplay of slight cooling trends in historical highs and warming lows over the last decade. Precipitation patterns have become more evenly distributed, reflecting a shift in the local climate dynamics. These changes are set against the backdrop of Switzerland's regional climate goals, which aim to mitigate such fluctuations.
A Tale of Temperature Trends
Lugano, located at 46.0°N, 8.9667°E, is nestled in the Swiss canton of Ticino, characterised by its humid subtropical climate (Cfa) according to the Köppen classification. This region experiences warm summers and mild winters, influenced by its proximity to the Alps and Lake Lugano. Over the past decade, the area has witnessed a warming trend in low temperatures, with a rise of 0.78°C (1.41°F). Conversely, high temperatures have increased by 0.71°C (1.28°F) during the same period. However, when considering all-time trends, a slight cooling of high temperatures by 0.01°C (0.02°F) contrasts with a warming of lows by 0.33°C (0.59°F). This divergence suggests a complex thermal dynamic that may be influenced by regional climatic shifts.
Precipitation Patterns and Distribution
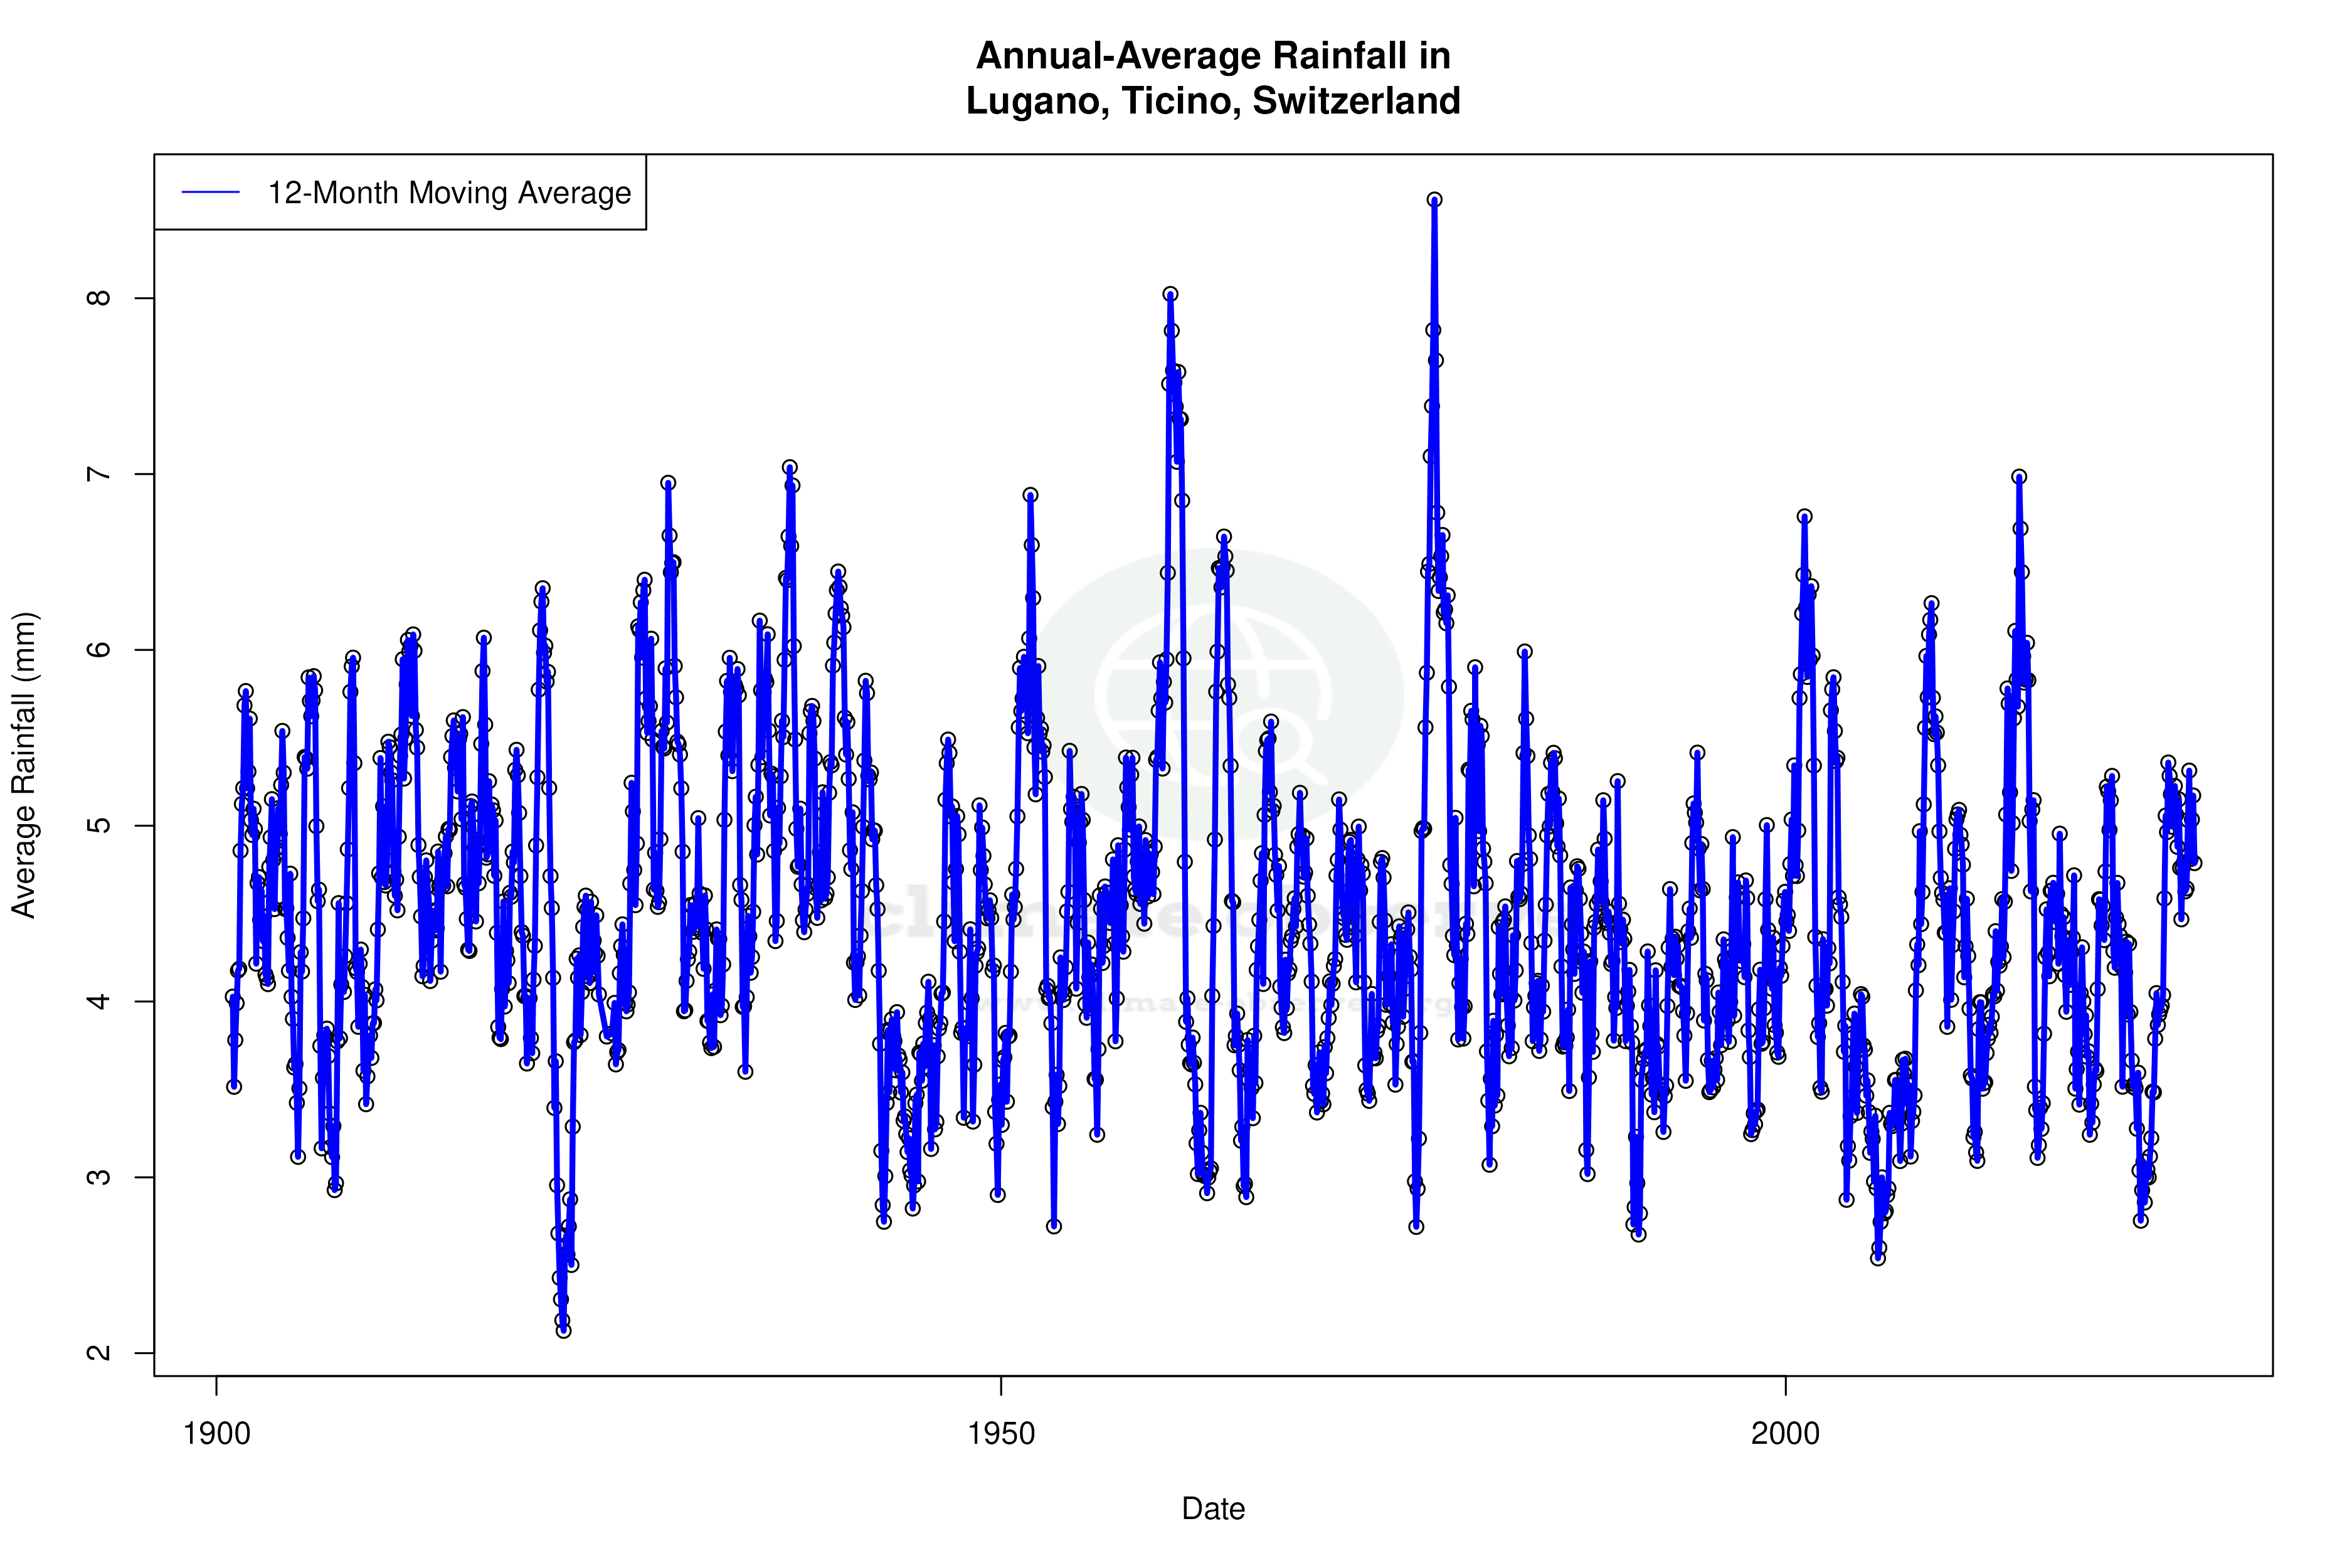
The Precipitation Concentration Index (PCI) provides insight into how rainfall is distributed throughout the year. A lower PCI indicates more evenly distributed precipitation. Lugano's PCI has decreased from a baseline of 12.3 to a current value of 10.3, suggesting a more even distribution of rainfall events. This change could be attributed to alterations in atmospheric circulation patterns or localised climatic adjustments, leading to less intense but more frequent rainfall.
Extreme Temperature Records
Lugano's temperature extremes reflect its climatic variability. The highest recorded temperature stands at 38.0°C (100.4°F), while the lowest plummets to -14.0°C (6.8°F). These records highlight the potential for significant thermal oscillations, which may impact local ecosystems and human activities. The presence of Lake Lugano moderates these extremes to some extent, but the influence of alpine weather systems can lead to abrupt temperature shifts.
Regional Climate Goals and Local Impacts
Switzerland's commitment to reducing greenhouse gas emissions and enhancing climate resilience is crucial in the context of Lugano's evolving climate profile. Recent weather events, such as unseasonal rainfall or heatwaves, underscore the importance of these goals. The observed trends in temperature and precipitation distribution align with broader climate patterns, necessitating adaptive strategies to mitigate potential impacts on agriculture, water resources, and urban infrastructure.
Geographical Influence on Climate Dynamics
Lugano's geographical setting, with the Alps to the north and Lake Lugano at its heart, plays a pivotal role in shaping its climate. The mountains act as a barrier, influencing wind patterns and precipitation, while the lake moderates temperature fluctuations. This unique interplay contributes to the area's climatic characteristics, which are now experiencing subtle yet significant changes. These shifts require ongoing monitoring and analysis to inform future climate adaptation strategies in the region.
Station Statistics
10-Year Trend
High: +1.08 °F/decade
Low: +1.27 °F/decade
Rain: +0.017 in/decade
25-Year Trend
High: +1.19 °F/decade
Low: +0.70 °F/decade
Rain: +0.006 in/decade
50-Year Trend
High: +1.01 °F/decade
Low: +0.80 °F/decade
Rain: -0.003 in/decade
All-Time Trend
High: -0.02 °F/decade
Low: +0.58 °F/decade
Rain: -0.002 in/decade
Percentage Above-Average Days
Last 12 Months: 46.1%
This Year: 55.7%
Precipitation Concentration Index (PCI) ℹ️
Last 12 Months: 12.7
Historical Average: 13.3
Percentile Rank of Last 12 Months ℹ️
High: 87th percentile
Low: 95th percentile
Rain: 69th percentile
Change in Variance ℹ️
High: -9.7%
Low: -1.4%
Intraday: -44.8%
Data Coverage
84.6%
First Year of Data
1901
Station Location
Historical Weather Records
| Max High | Avg High | Min High | Max Avg | Avg Avg | Min Avg | Max Low | Avg Low | Min Low | Max Precipitation | Avg Precipitation | Max Snow | Avg Snow | |
|---|---|---|---|---|---|---|---|---|---|---|---|---|---|
| Record | 100.40 °F | — | 21.56 °F | 84.38 °F | — | 18.68 °F | 77.00 °F | — | 6.80 °F | 10.35 in | — | — | — |
| January | 70.70 °F | 43.81 °F | 21.56 °F | 57.92 °F | 37.16 °F | 19.58 °F | 51.98 °F | 31.02 °F | 9.50 °F | 3.42 in | 0.08 in | — | — |
| February | 77.00 °F | 47.79 °F | 24.80 °F | 57.92 °F | 40.37 °F | 18.68 °F | 48.92 °F | 32.90 °F | 6.80 °F | 3.15 in | 0.09 in | — | — |
| March | 81.14 °F | 55.48 °F | 31.82 °F | 65.48 °F | 47.42 °F | 29.12 °F | 53.96 °F | 38.34 °F | 19.40 °F | 4.21 in | 0.13 in | — | — |
| April | 88.88 °F | 62.02 °F | 38.30 °F | 73.22 °F | 53.45 °F | 34.47 °F | 61.52 °F | 44.57 °F | 26.11 °F | 4.03 in | 0.20 in | — | — |
| May | 90.68 °F | 69.57 °F | 44.29 °F | 77.72 °F | 60.90 °F | 41.43 °F | 68.72 °F | 51.67 °F | 32.90 °F | 4.92 in | 0.25 in | — | — |
| June | 97.16 °F | 77.14 °F | 51.08 °F | 83.48 °F | 68.55 °F | 48.92 °F | 76.46 °F | 58.00 °F | 39.56 °F | 5.29 in | 0.23 in | — | — |
| July | 100.40 °F | 81.83 °F | 58.28 °F | 84.38 °F | 72.64 °F | 57.92 °F | 77.00 °F | 61.67 °F | 46.40 °F | 6.70 in | 0.21 in | — | — |
| August | 97.52 °F | 80.54 °F | 58.82 °F | 83.66 °F | 71.48 °F | 55.94 °F | 74.30 °F | 61.01 °F | 43.70 °F | 10.35 in | 0.23 in | — | — |
| September | 96.80 °F | 73.34 °F | 50.72 °F | 75.38 °F | 63.97 °F | 48.88 °F | 69.80 °F | 55.63 °F | 35.60 °F | 6.45 in | 0.21 in | — | — |
| October | 84.02 °F | 62.89 °F | 38.16 °F | 70.16 °F | 55.22 °F | 36.57 °F | 63.14 °F | 47.94 °F | 27.68 °F | 6.10 in | 0.21 in | — | — |
| November | 77.72 °F | 52.13 °F | 32.00 °F | 57.74 °F | 45.40 °F | 30.38 °F | 55.76 °F | 39.32 °F | 21.20 °F | 4.26 in | 0.18 in | — | — |
| December | 70.52 °F | 45.27 °F | 27.32 °F | 51.98 °F | 38.42 °F | 21.94 °F | 52.88 °F | 33.15 °F | 14.72 °F | 3.40 in | 0.10 in | — | — |
Data Visualisations
Remove WatermarksCurrent Year Climate Trends vs Historical
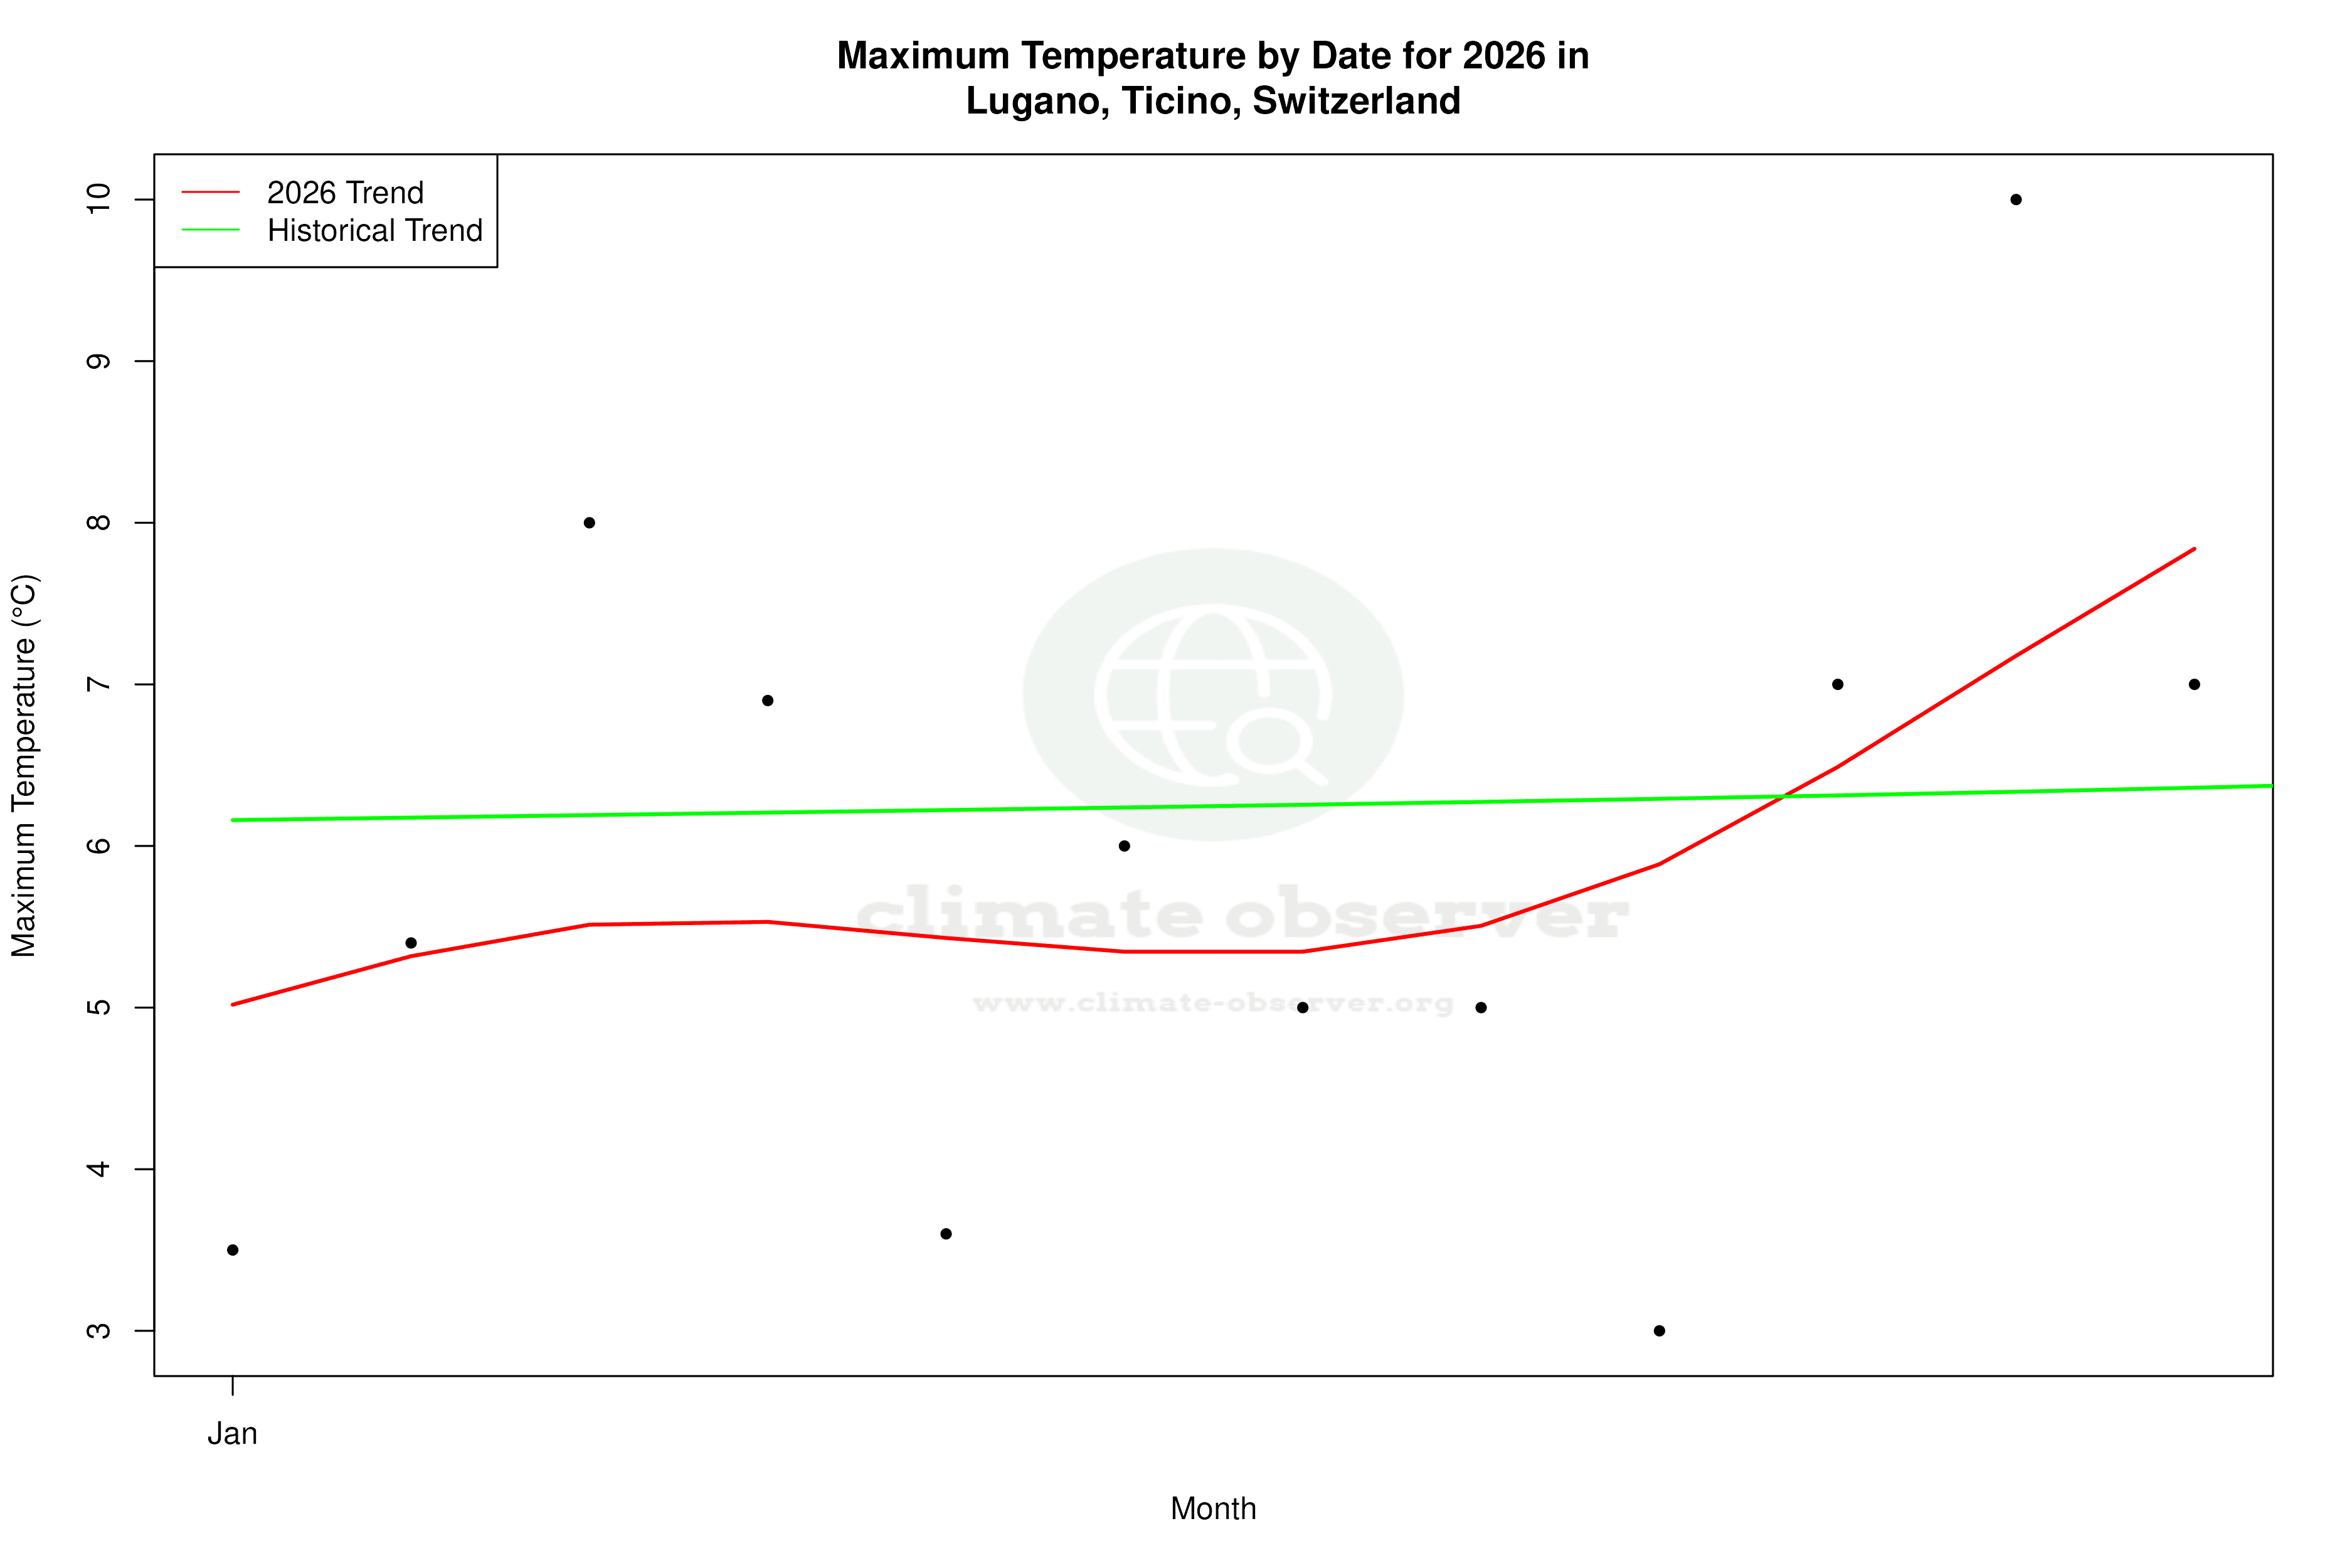


Max Temperature this Year | 1 of 6
Climate 12-Month Moving Averages


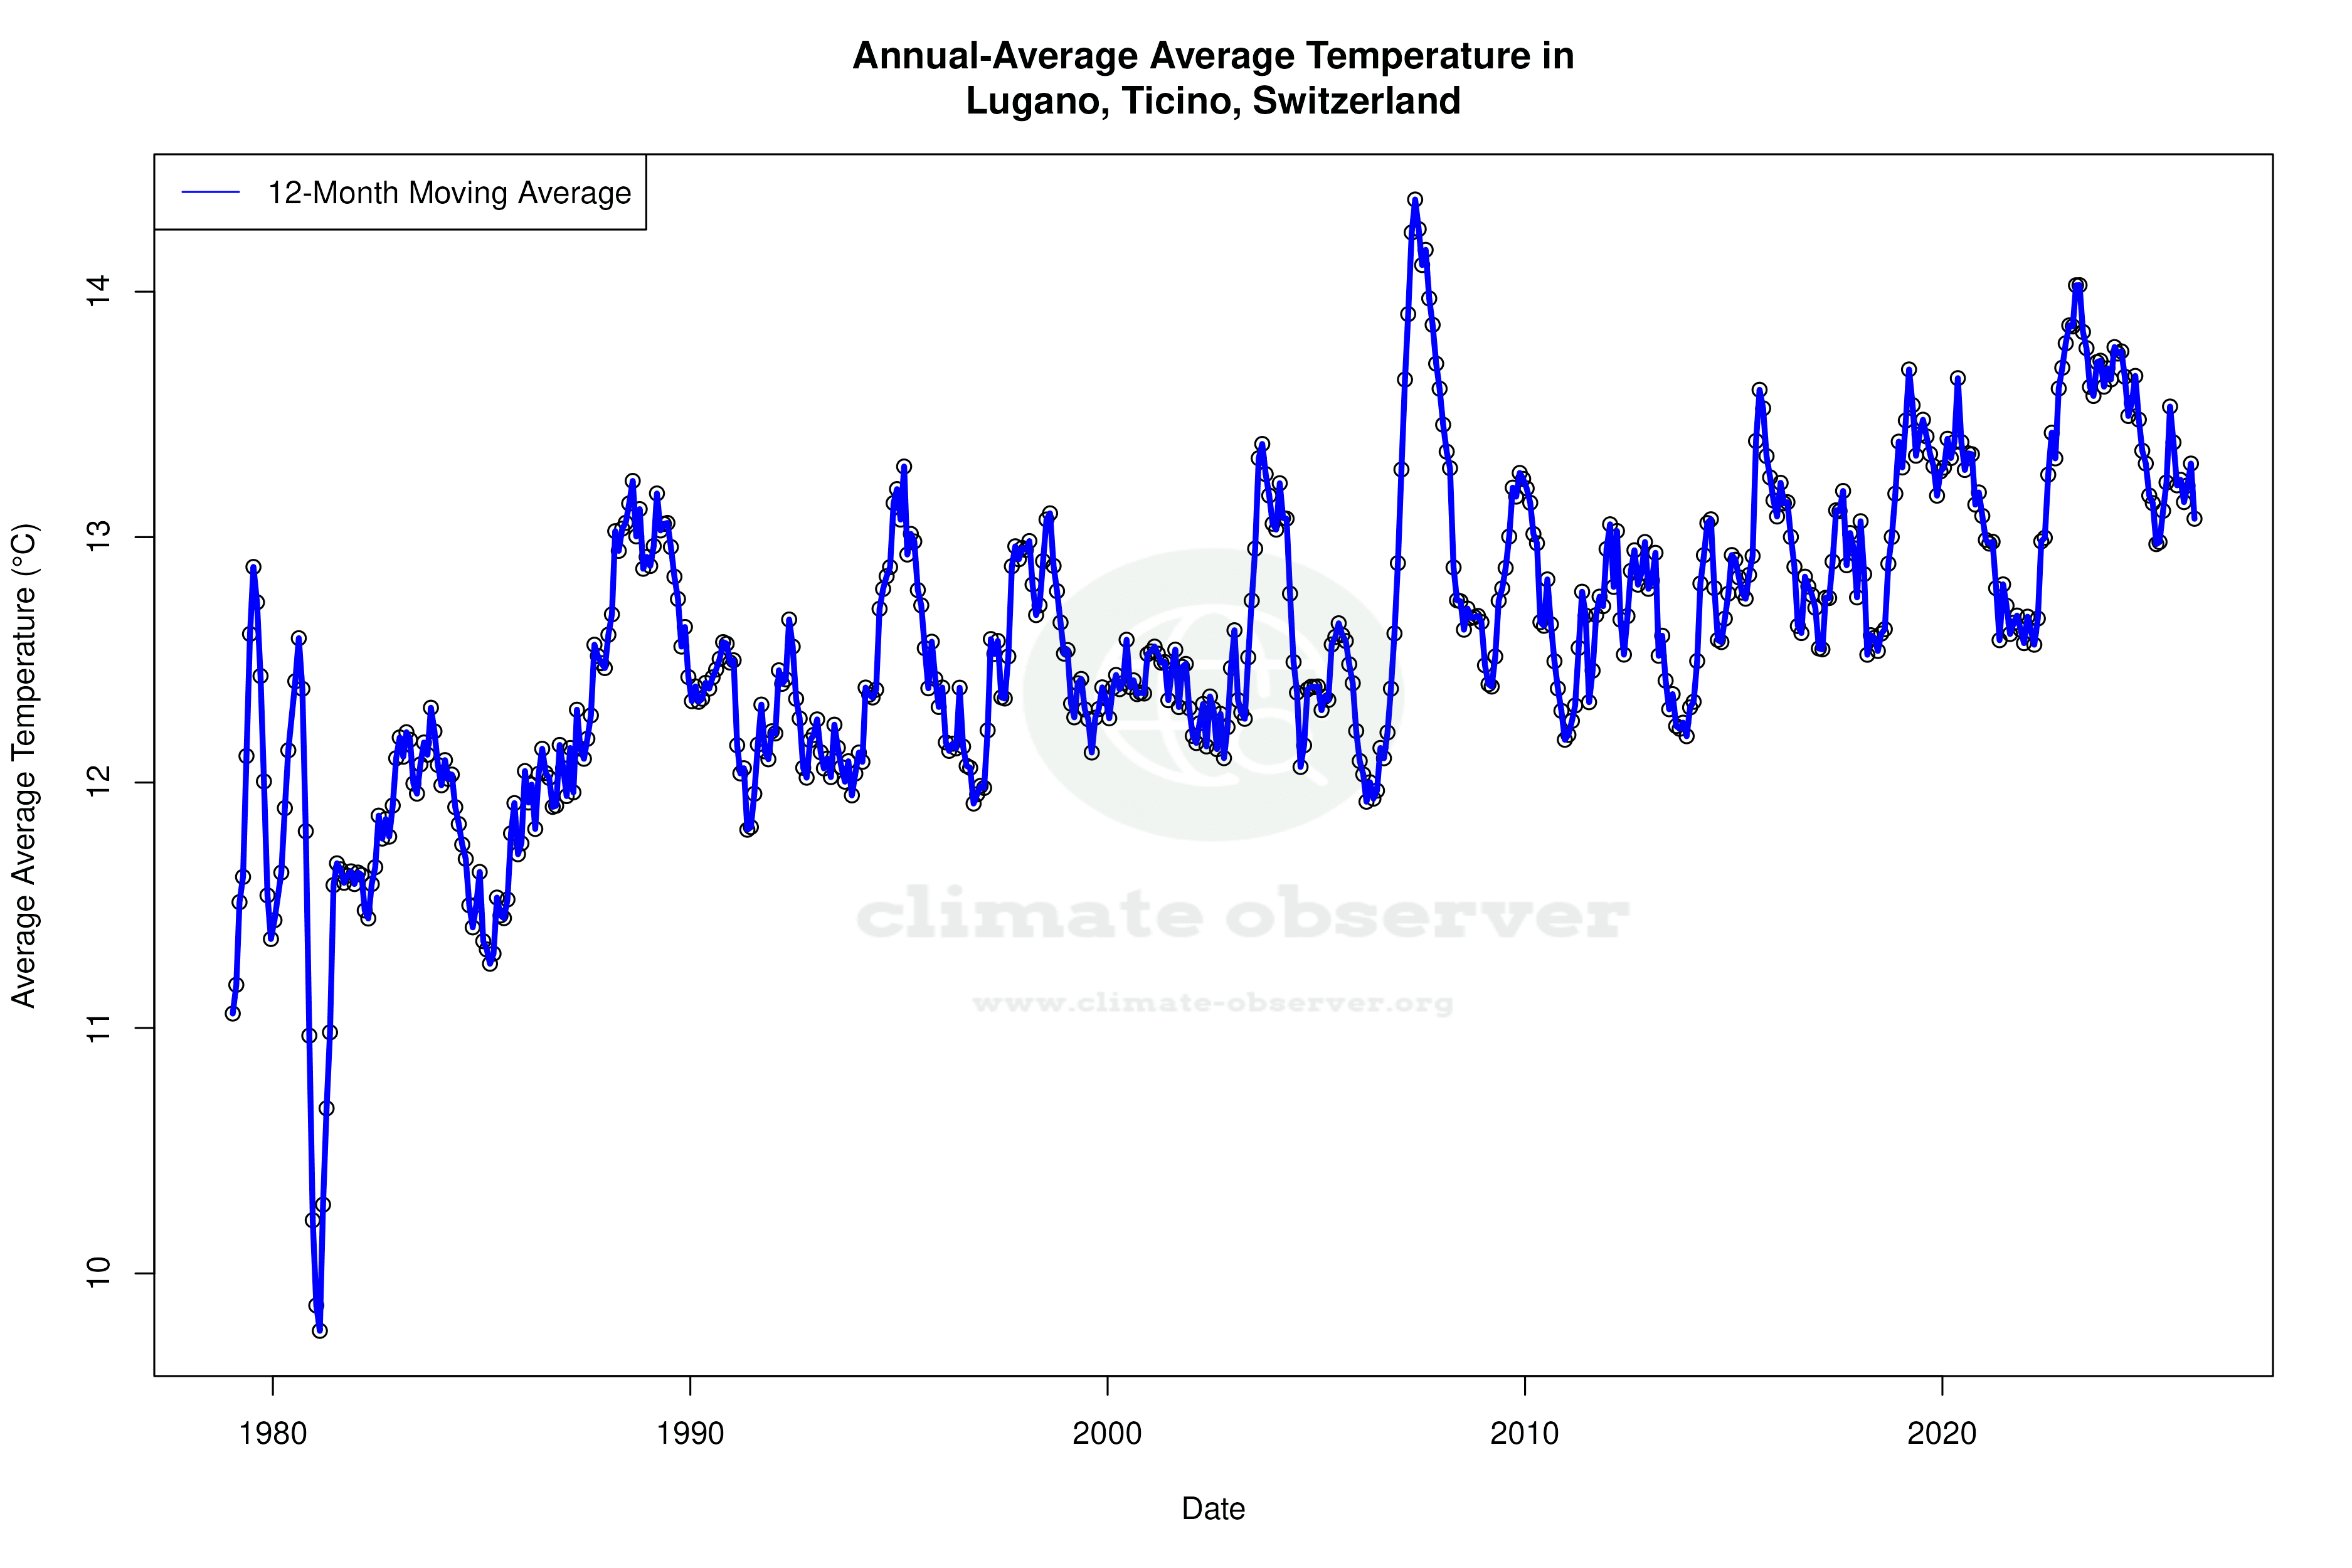

Max Temperature 12-Month MA | 1 of 6
Daily Data Points and Averages Throughout the Year


Average Max Temperature Throughout Year | 1 of 5
