Climate for Station: Sta Maria Val Muestair, Graubünden, Switzerland
Loading live weather...
Climate Analysis & Overview
Sta Maria Val Müstair is experiencing a notable warming trend, with significant increases in both high and low temperatures over the past decade. The region's precipitation patterns have become more evenly distributed, which may influence local ecological and hydrological systems.
Warming Trends in the Alpine Region
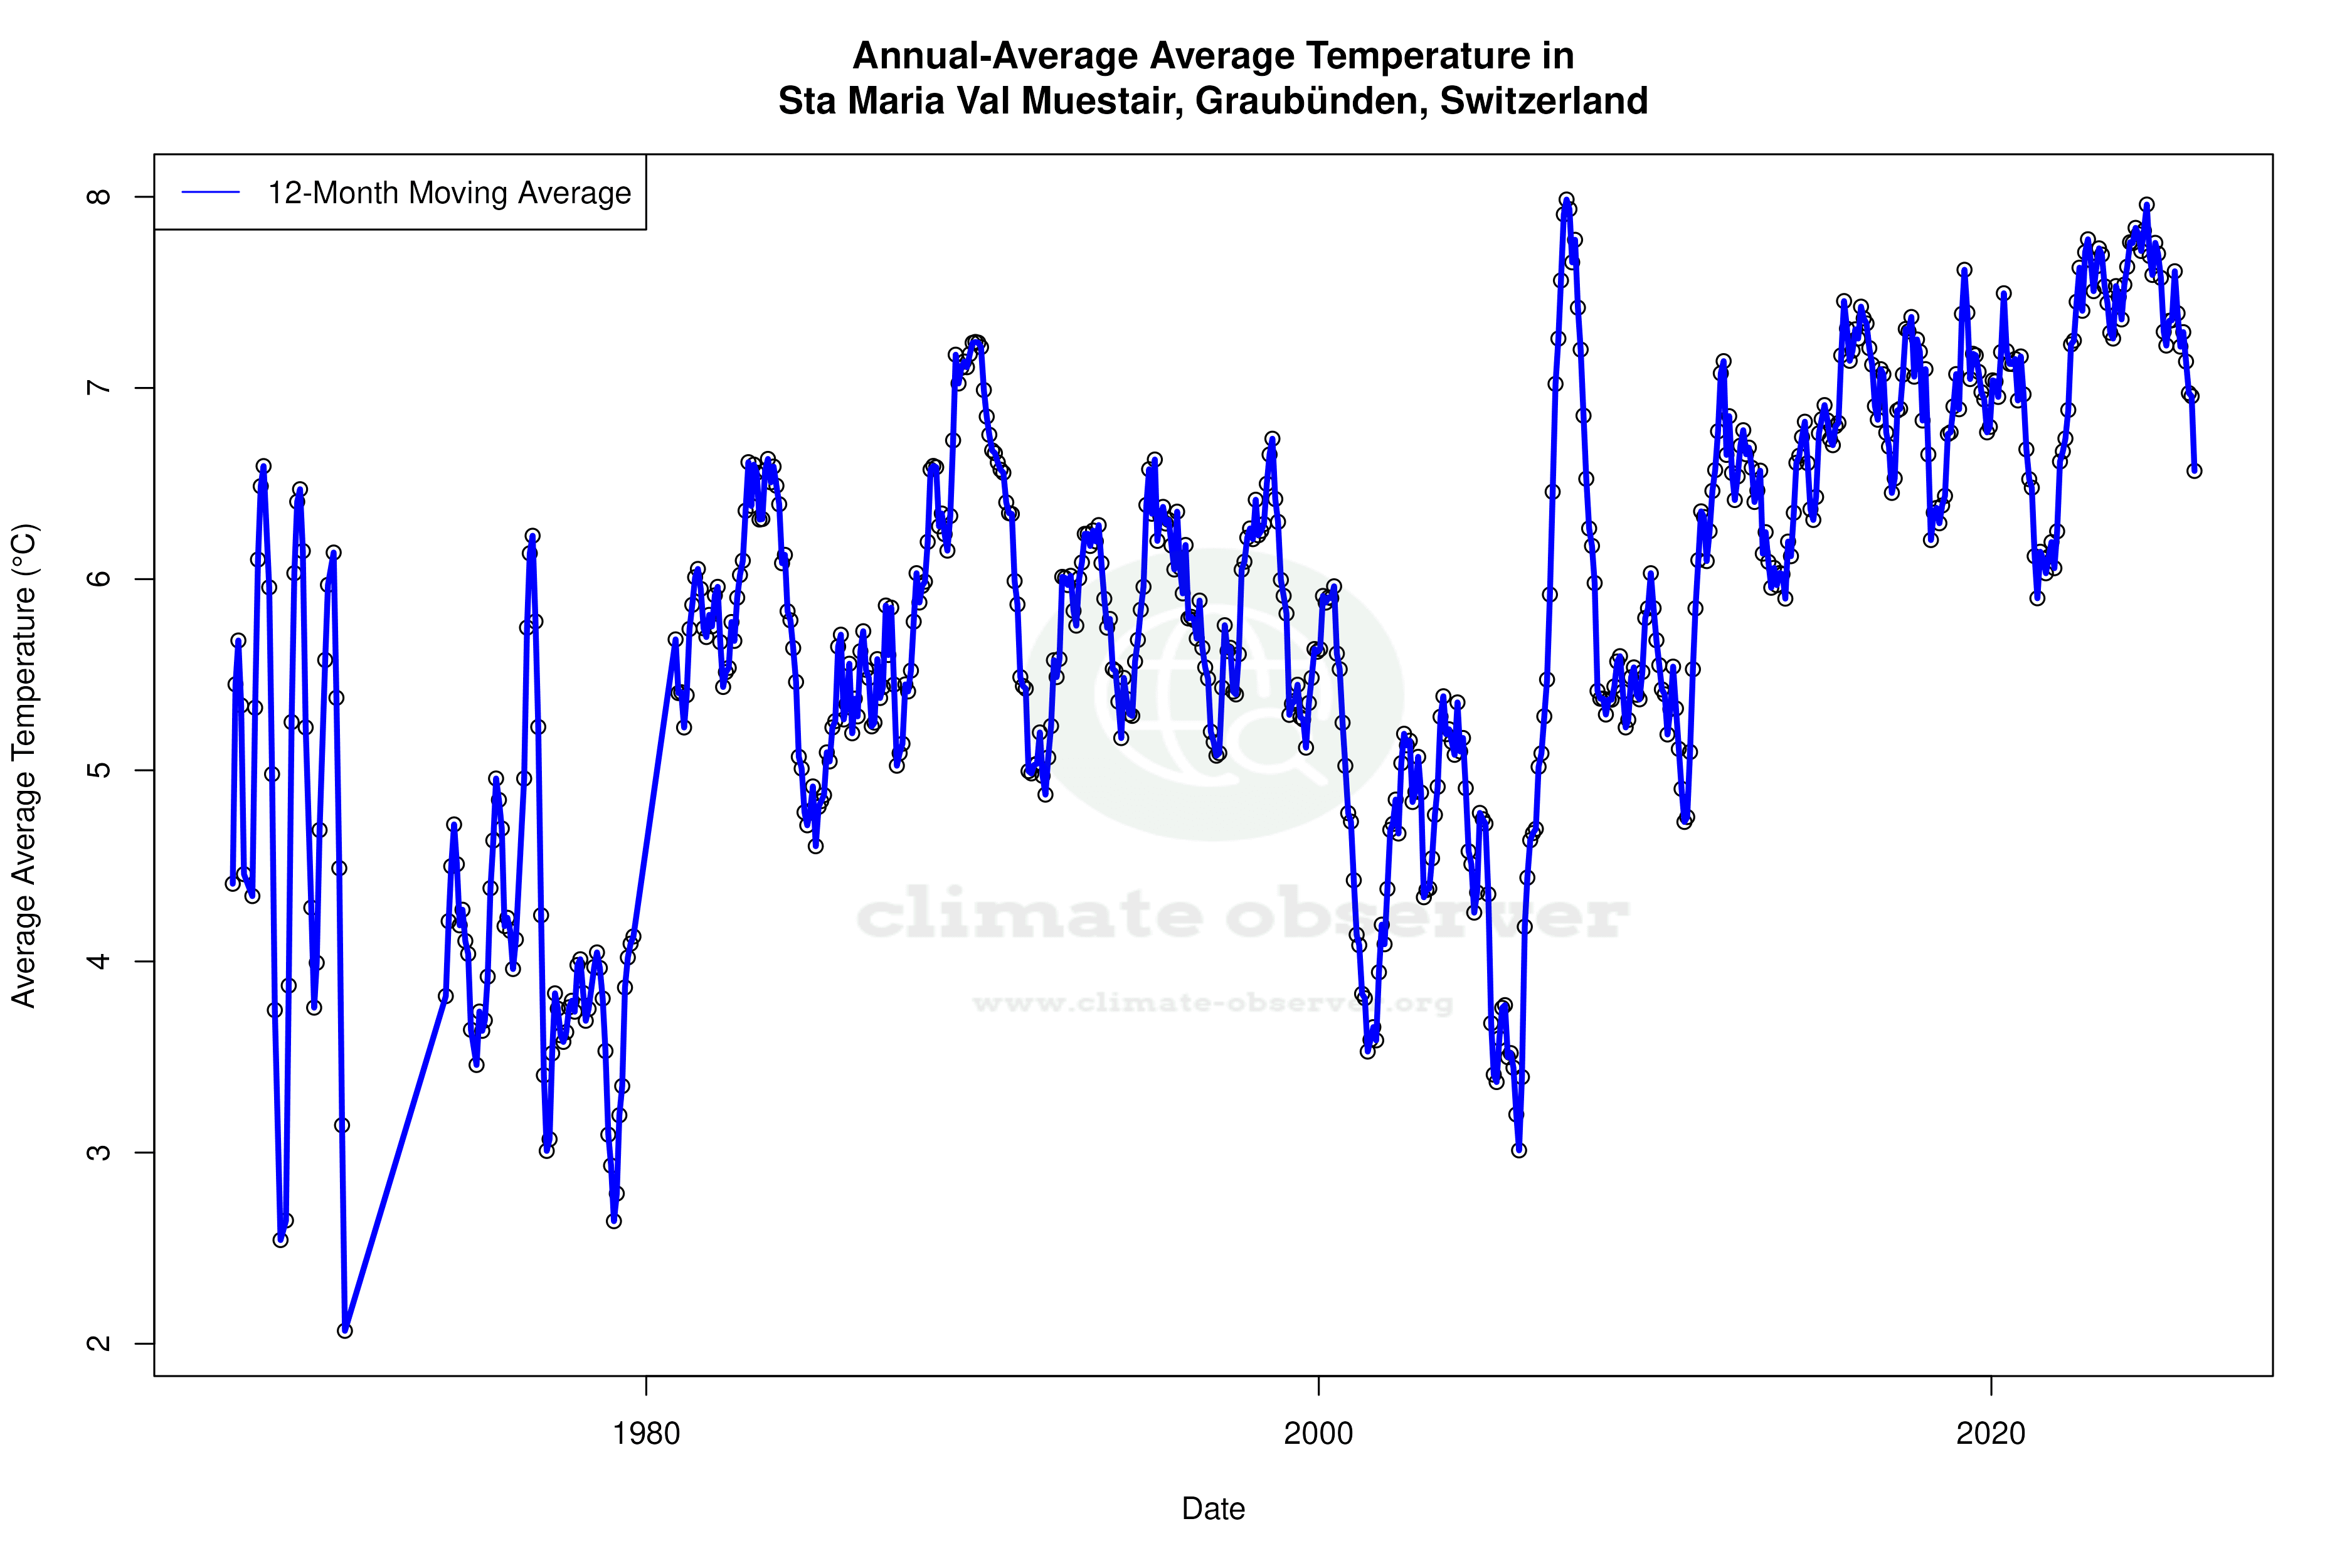
Sta Maria Val Müstair, located in the Engiadina Bassa/Val Müstair region of Switzerland, is classified under the Köppen climate classification as Dfb, indicating a humid continental climate with warm summers. The area's mountainous terrain significantly influences its climatic patterns, often leading to cooler temperatures and varied precipitation distribution. Over the past decade, the station has recorded a warming trend, with high temperatures increasing by 1.21°C (2.18°F) and low temperatures rising by 1.46°C (2.63°F). This recent warming is more pronounced than the all-time trends, which show increases of 0.61°C (1.10°F) for highs and 1.02°C (1.83°F) for lows. This suggests an acceleration in temperature rise, likely influenced by broader regional climatic changes and global warming.
Temperature Extremes and Records
The station's historical temperature records reveal the extremities of its climate. The highest recorded temperature is 32.6°C (90.7°F), while the lowest plummets to -30.47°C (-22.85°F). These extremes highlight the area's capacity for significant thermal oscillations, a characteristic feature of continental climates. Such variations can affect local biodiversity and human activities, particularly in agriculture and tourism, which are vital to the region's economy.
Precipitation Patterns and Distribution
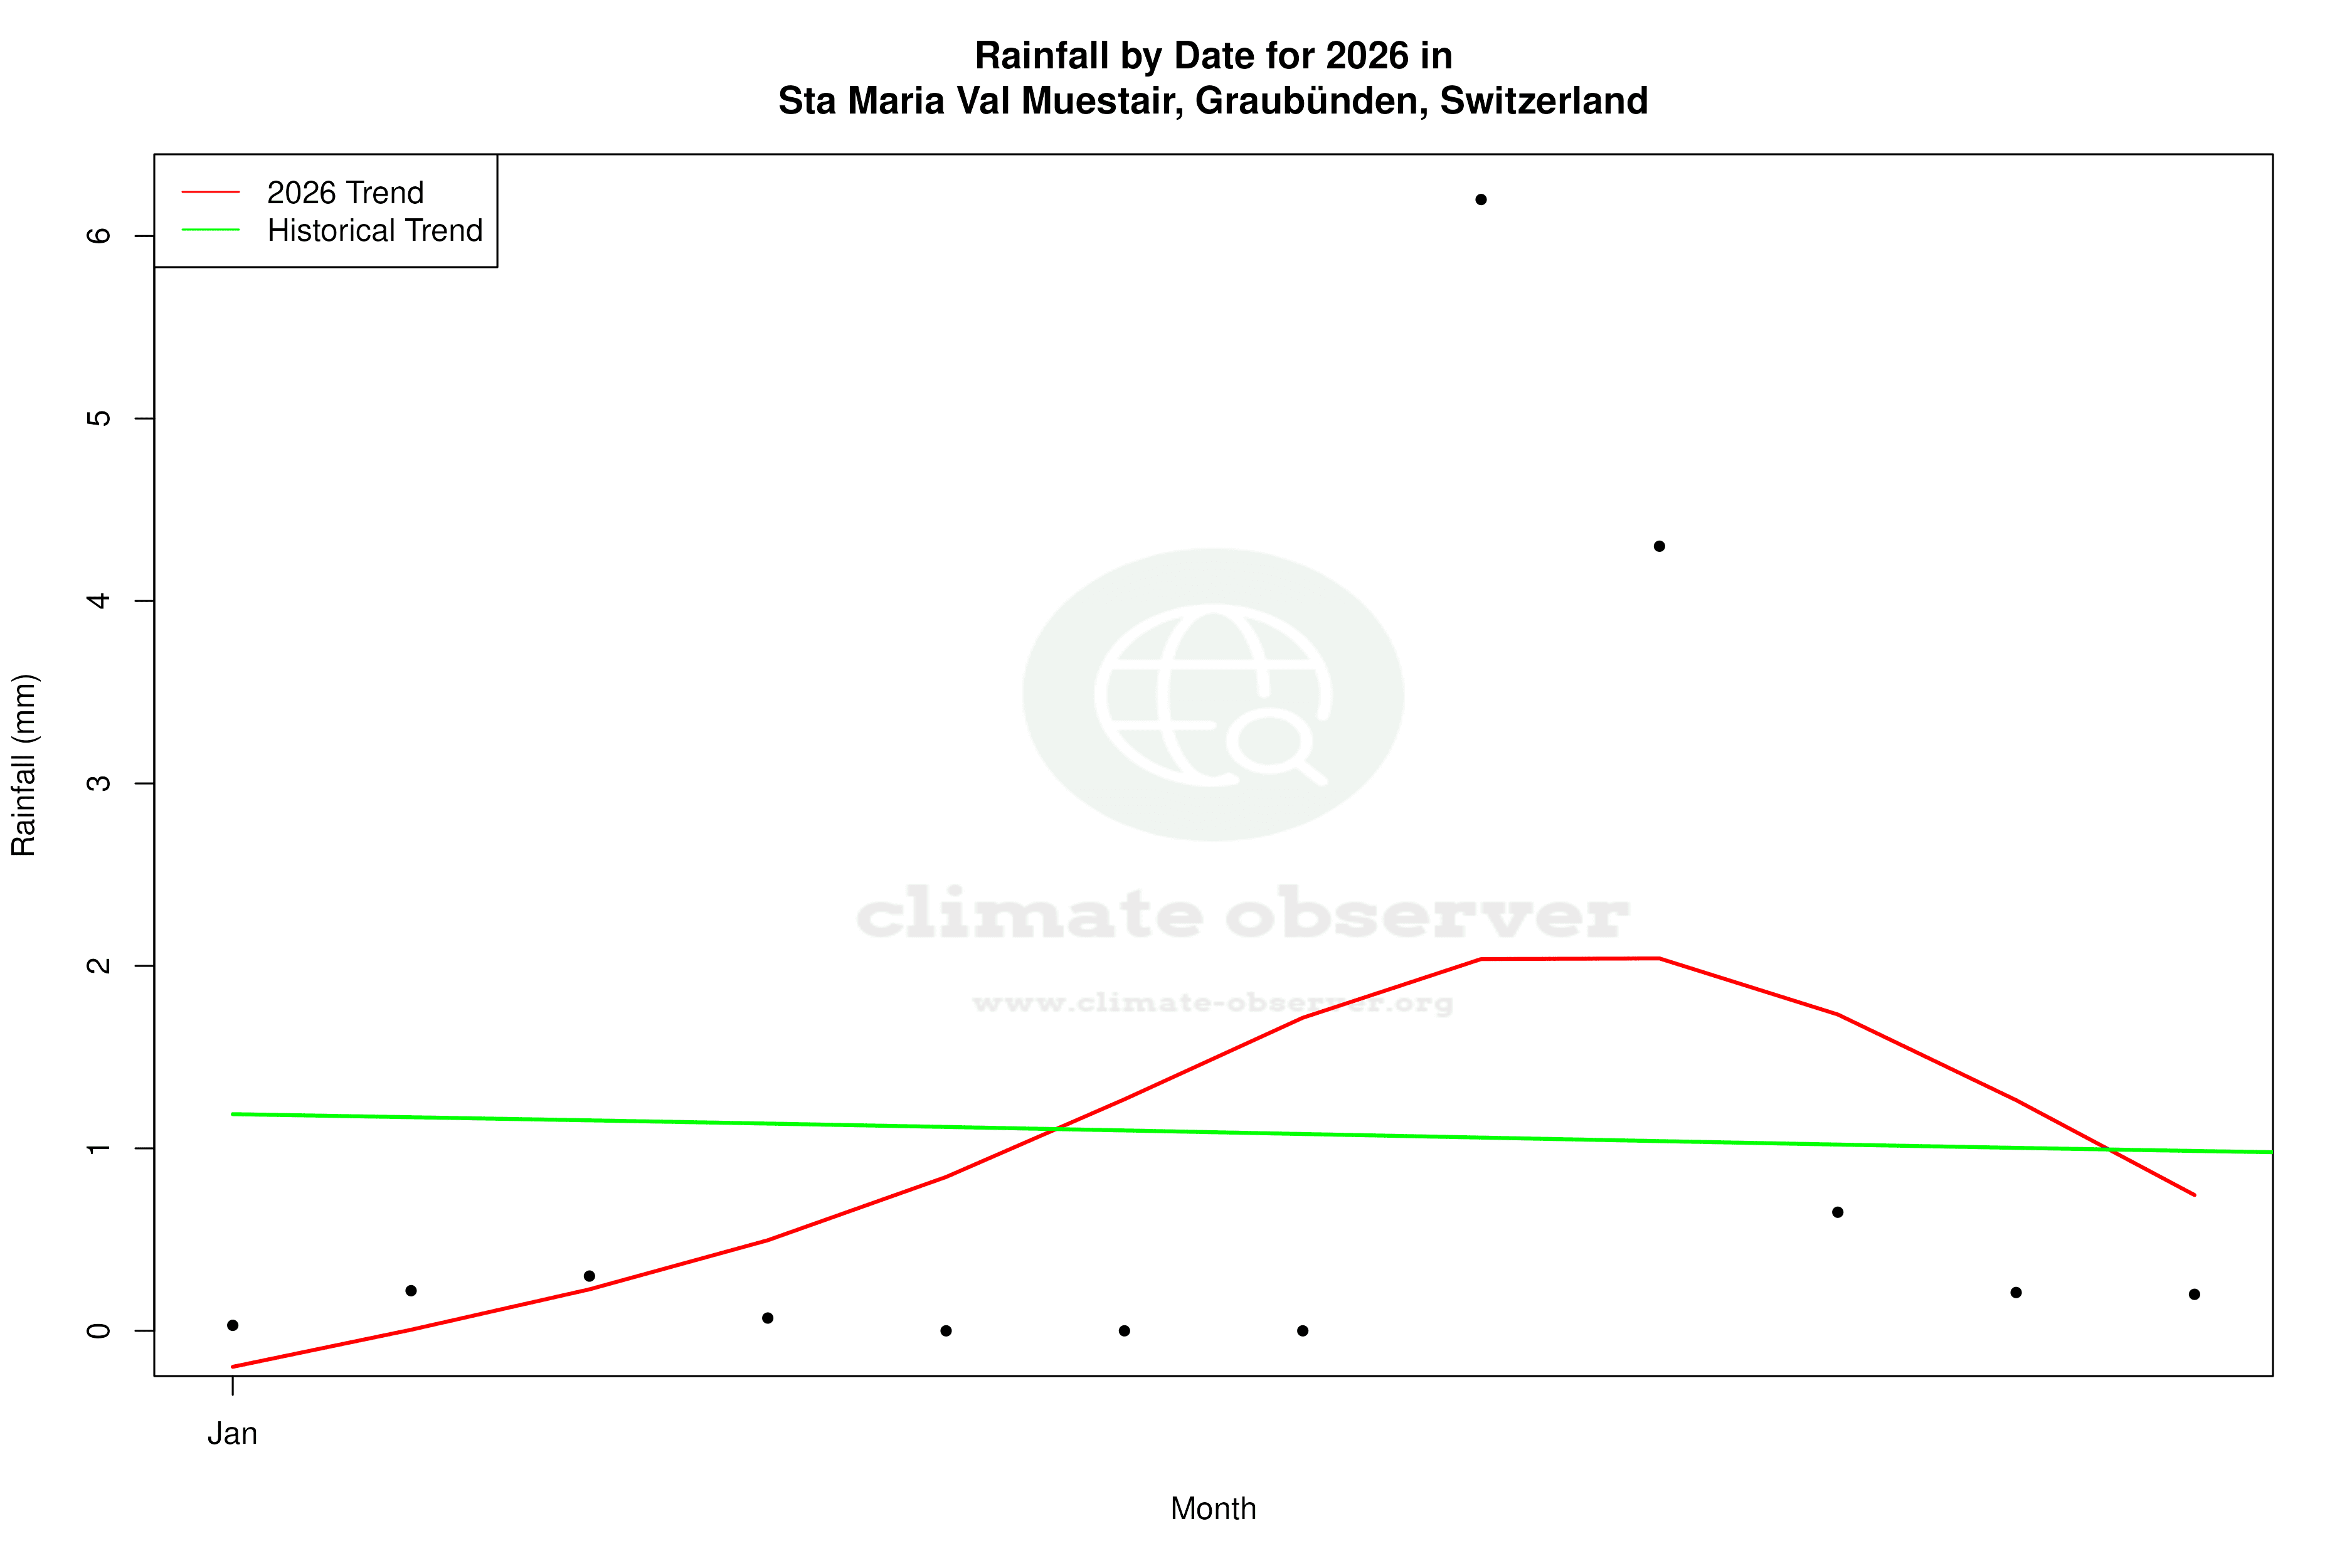
The Precipitation Concentration Index (PCI) for Sta Maria Val Müstair has shown a decrease from a baseline of 11.87 to a current value of 10.75. The PCI measures how precipitation is distributed over time, with lower values indicating a more even distribution. This marginal decrease suggests that rainfall is becoming slightly more evenly spread throughout the year. This change can have profound implications for water resource management, soil moisture levels, and the health of alpine ecosystems, which are sensitive to shifts in precipitation patterns.
Regional Climate Context and Implications
Switzerland's commitment to reducing greenhouse gas emissions and adapting to climate change is crucial in the context of these observed trends. The warming in Sta Maria Val Müstair aligns with broader regional goals to mitigate climate impacts and enhance resilience. Recent weather events, such as increased frequency of heatwaves, underscore the importance of these efforts. As the region continues to warm, understanding and adapting to these climatic changes will be essential for maintaining ecological balance and supporting sustainable development in the area.
Station Statistics
10-Year Trend
High: +1.56 °F/decade
Low: +1.97 °F/decade
Rain: +0.034 in/decade
25-Year Trend
High: +0.86 °F/decade
Low: +2.79 °F/decade
Rain: +0.009 in/decade
50-Year Trend
High: +1.08 °F/decade
Low: +1.96 °F/decade
Rain: -0.004 in/decade
All-Time Trend
High: +1.02 °F/decade
Low: +1.81 °F/decade
Rain: -0.003 in/decade
Percentage Above-Average Days
Last 12 Months: 50.1%
This Year: 50.3%
Precipitation Concentration Index (PCI) ℹ️
Last 12 Months: 10.7
Historical Average: 12.6
Percentile Rank of Last 12 Months ℹ️
High: 77th percentile
Low: 89th percentile
Rain: 78th percentile
Change in Variance ℹ️
High: -5.4%
Low: -22.5%
Intraday: -31.7%
Data Coverage
92.8%
First Year of Data
1967
Station Location
Historical Weather Records
| Max High | Avg High | Min High | Max Avg | Avg Avg | Min Avg | Max Low | Avg Low | Min Low | Max Precipitation | Avg Precipitation | Max Snow | Avg Snow | |
|---|---|---|---|---|---|---|---|---|---|---|---|---|---|
| Record | 90.68 °F | — | -3.60 °F | 77.36 °F | — | -3.42 °F | 64.94 °F | — | -22.85 °F | 2.95 in | — | — | — |
| January | 56.12 °F | 31.63 °F | -3.60 °F | 47.12 °F | 25.55 °F | -3.24 °F | 39.74 °F | 16.62 °F | -22.85 °F | 1.06 in | 0.04 in | — | — |
| February | 60.80 °F | 34.30 °F | 4.48 °F | 49.82 °F | 27.18 °F | -3.42 °F | 42.26 °F | 17.87 °F | -15.97 °F | 1.42 in | 0.04 in | — | — |
| March | 68.00 °F | 40.72 °F | 5.00 °F | 53.24 °F | 33.42 °F | -0.98 °F | 42.80 °F | 24.18 °F | -13.86 °F | 1.30 in | 0.04 in | — | — |
| April | 74.12 °F | 48.29 °F | 22.01 °F | 60.80 °F | 40.32 °F | 6.44 °F | 49.64 °F | 31.30 °F | -0.60 °F | 0.94 in | 0.06 in | — | — |
| May | 79.88 °F | 56.55 °F | 31.08 °F | 69.80 °F | 48.62 °F | 27.68 °F | 56.12 °F | 39.26 °F | 17.60 °F | 1.81 in | 0.09 in | — | — |
| June | 88.16 °F | 63.81 °F | 37.04 °F | 77.18 °F | 55.19 °F | 34.34 °F | 64.94 °F | 45.24 °F | 25.50 °F | 2.32 in | 0.11 in | — | — |
| July | 90.68 °F | 67.64 °F | 44.47 °F | 77.36 °F | 59.02 °F | 40.46 °F | 61.16 °F | 48.66 °F | 27.88 °F | 2.76 in | 0.12 in | — | — |
| August | 89.96 °F | 66.68 °F | 41.00 °F | 74.12 °F | 58.12 °F | 39.02 °F | 64.40 °F | 48.80 °F | 23.85 °F | 2.95 in | 0.12 in | — | — |
| September | 86.00 °F | 60.50 °F | 37.40 °F | 71.42 °F | 51.96 °F | 32.23 °F | 59.00 °F | 43.23 °F | 22.26 °F | 2.42 in | 0.09 in | — | — |
| October | 77.36 °F | 51.88 °F | 26.60 °F | 61.88 °F | 44.01 °F | 19.22 °F | 56.12 °F | 36.57 °F | 9.82 °F | 2.20 in | 0.08 in | — | — |
| November | 66.56 °F | 40.76 °F | 13.12 °F | 54.32 °F | 34.38 °F | 10.09 °F | 47.66 °F | 27.42 °F | -5.46 °F | 1.30 in | 0.06 in | — | — |
| December | 55.76 °F | 33.15 °F | 0.32 °F | 47.66 °F | 27.66 °F | -1.30 °F | 41.36 °F | 19.79 °F | -21.86 °F | 1.40 in | 0.05 in | — | — |
Data Visualisations
Remove WatermarksCurrent Year Climate Trends vs Historical


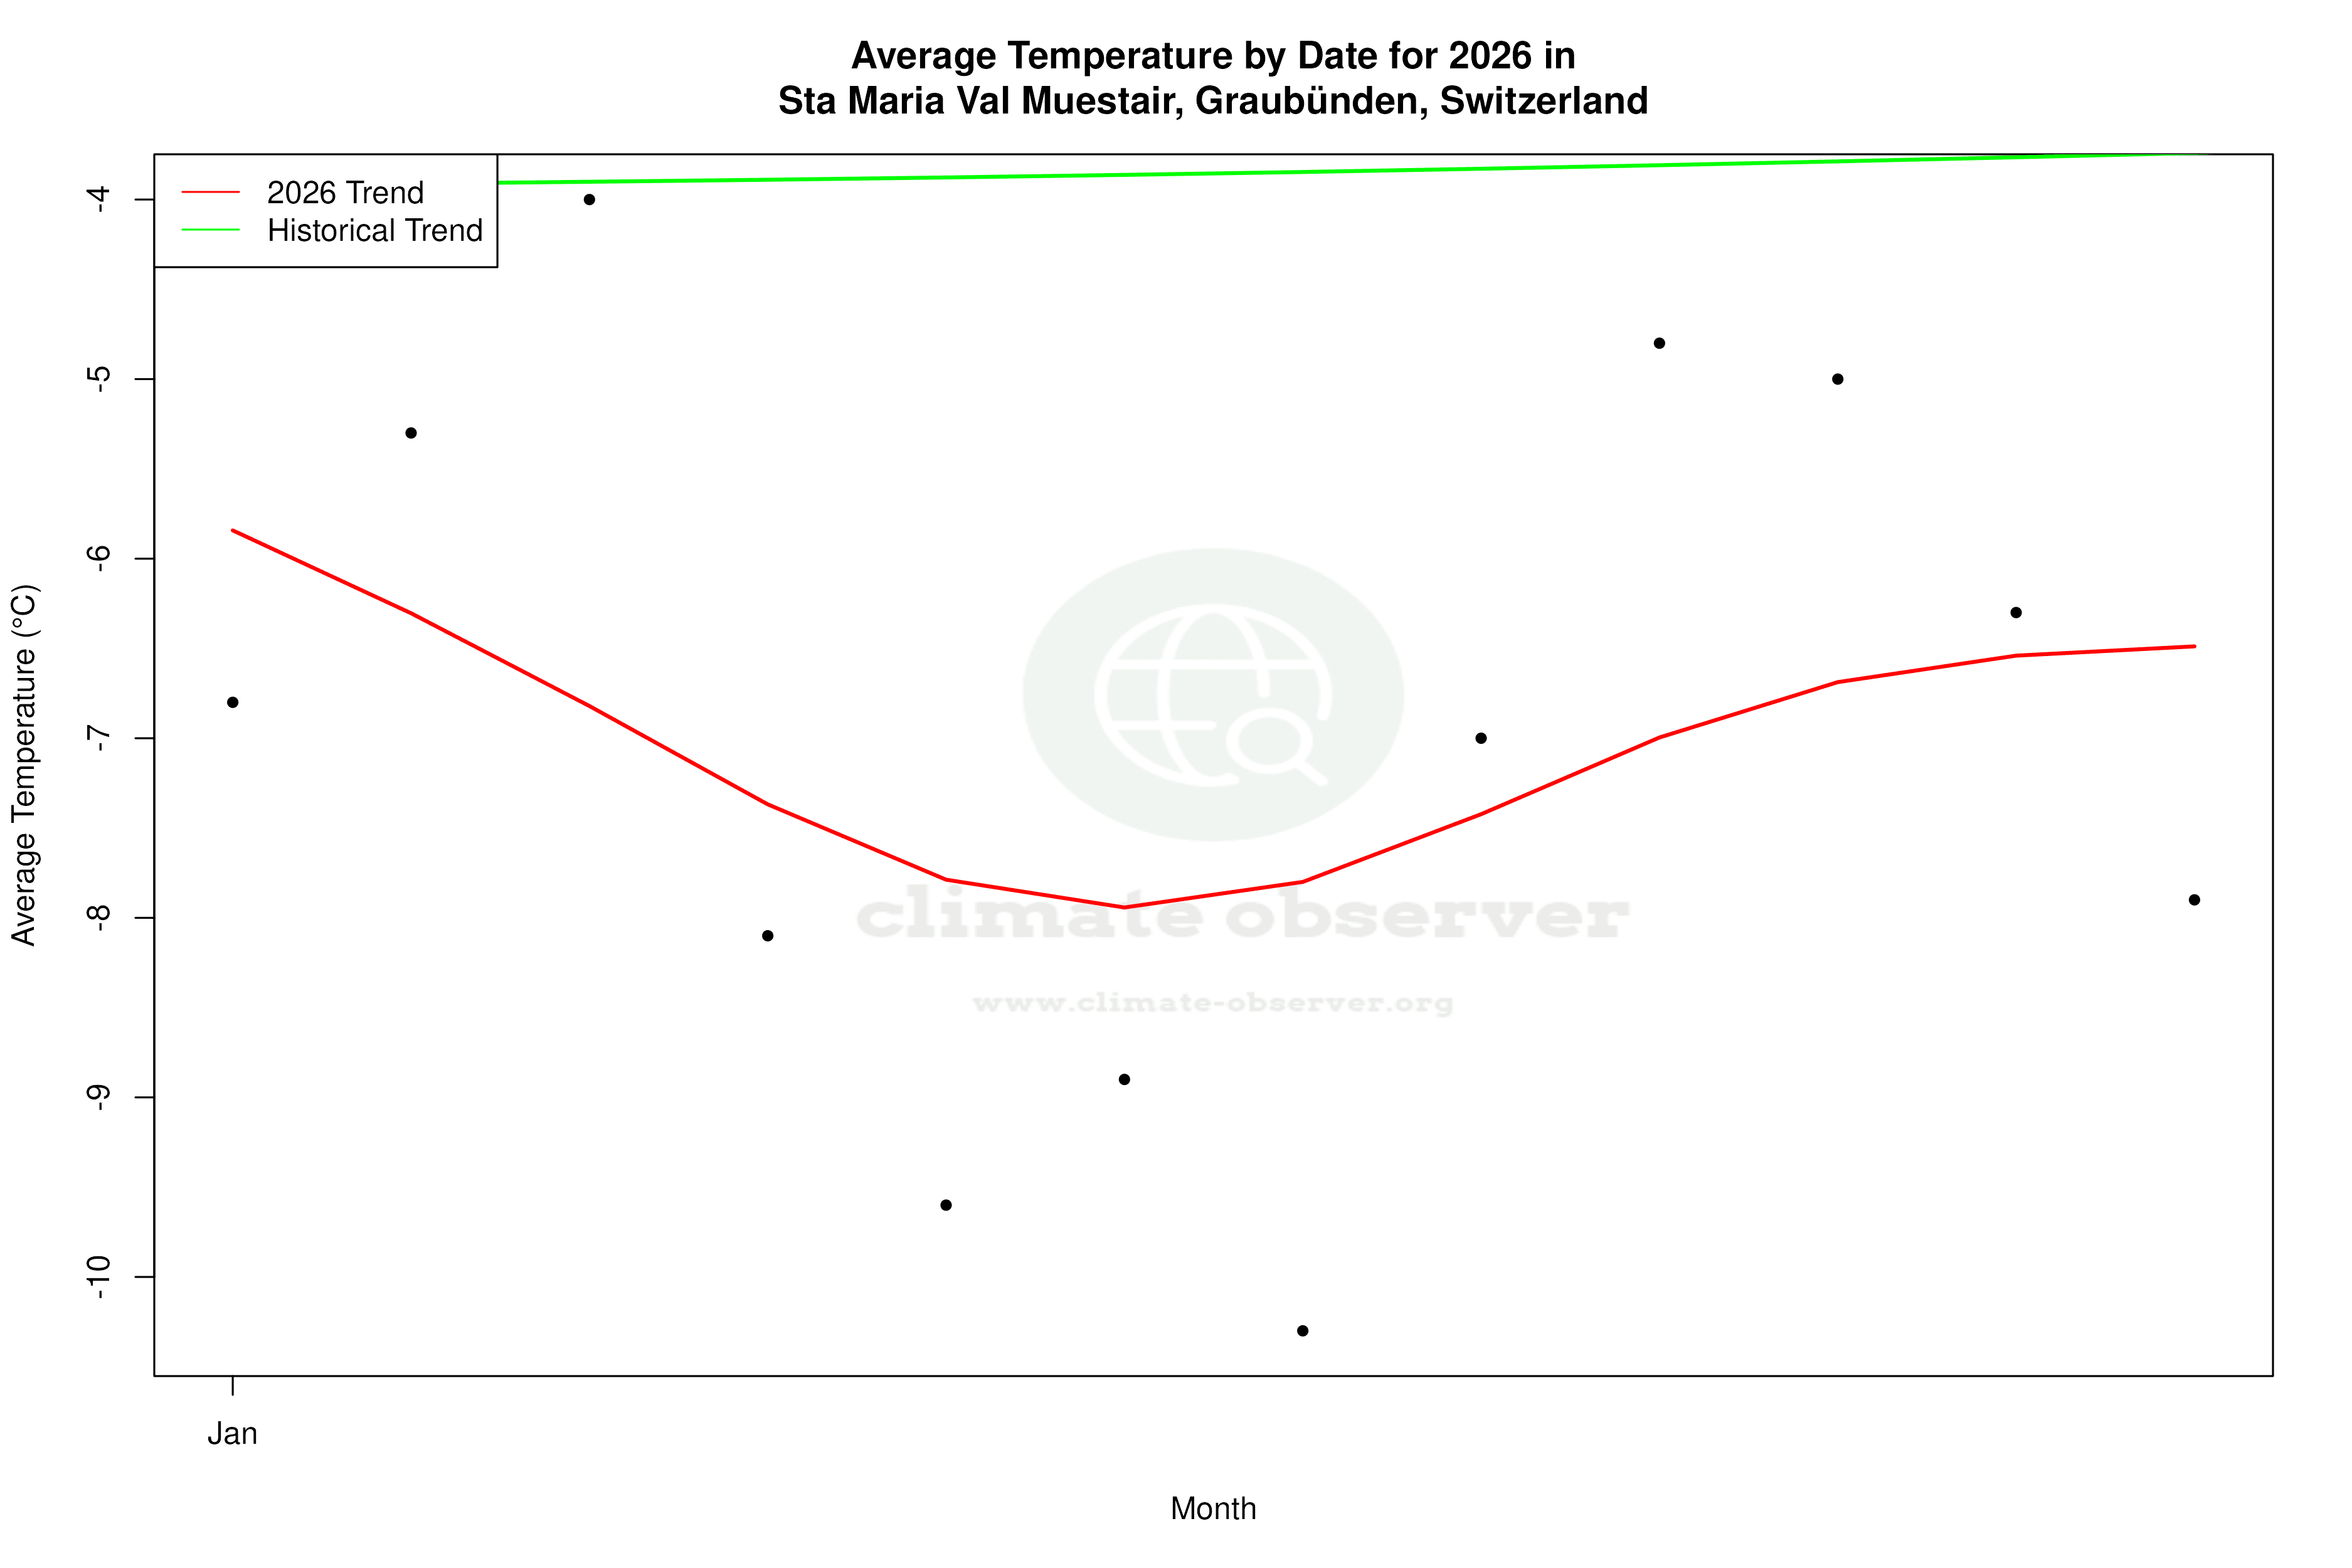


Max Temperature this Year | 1 of 6
Climate 12-Month Moving Averages

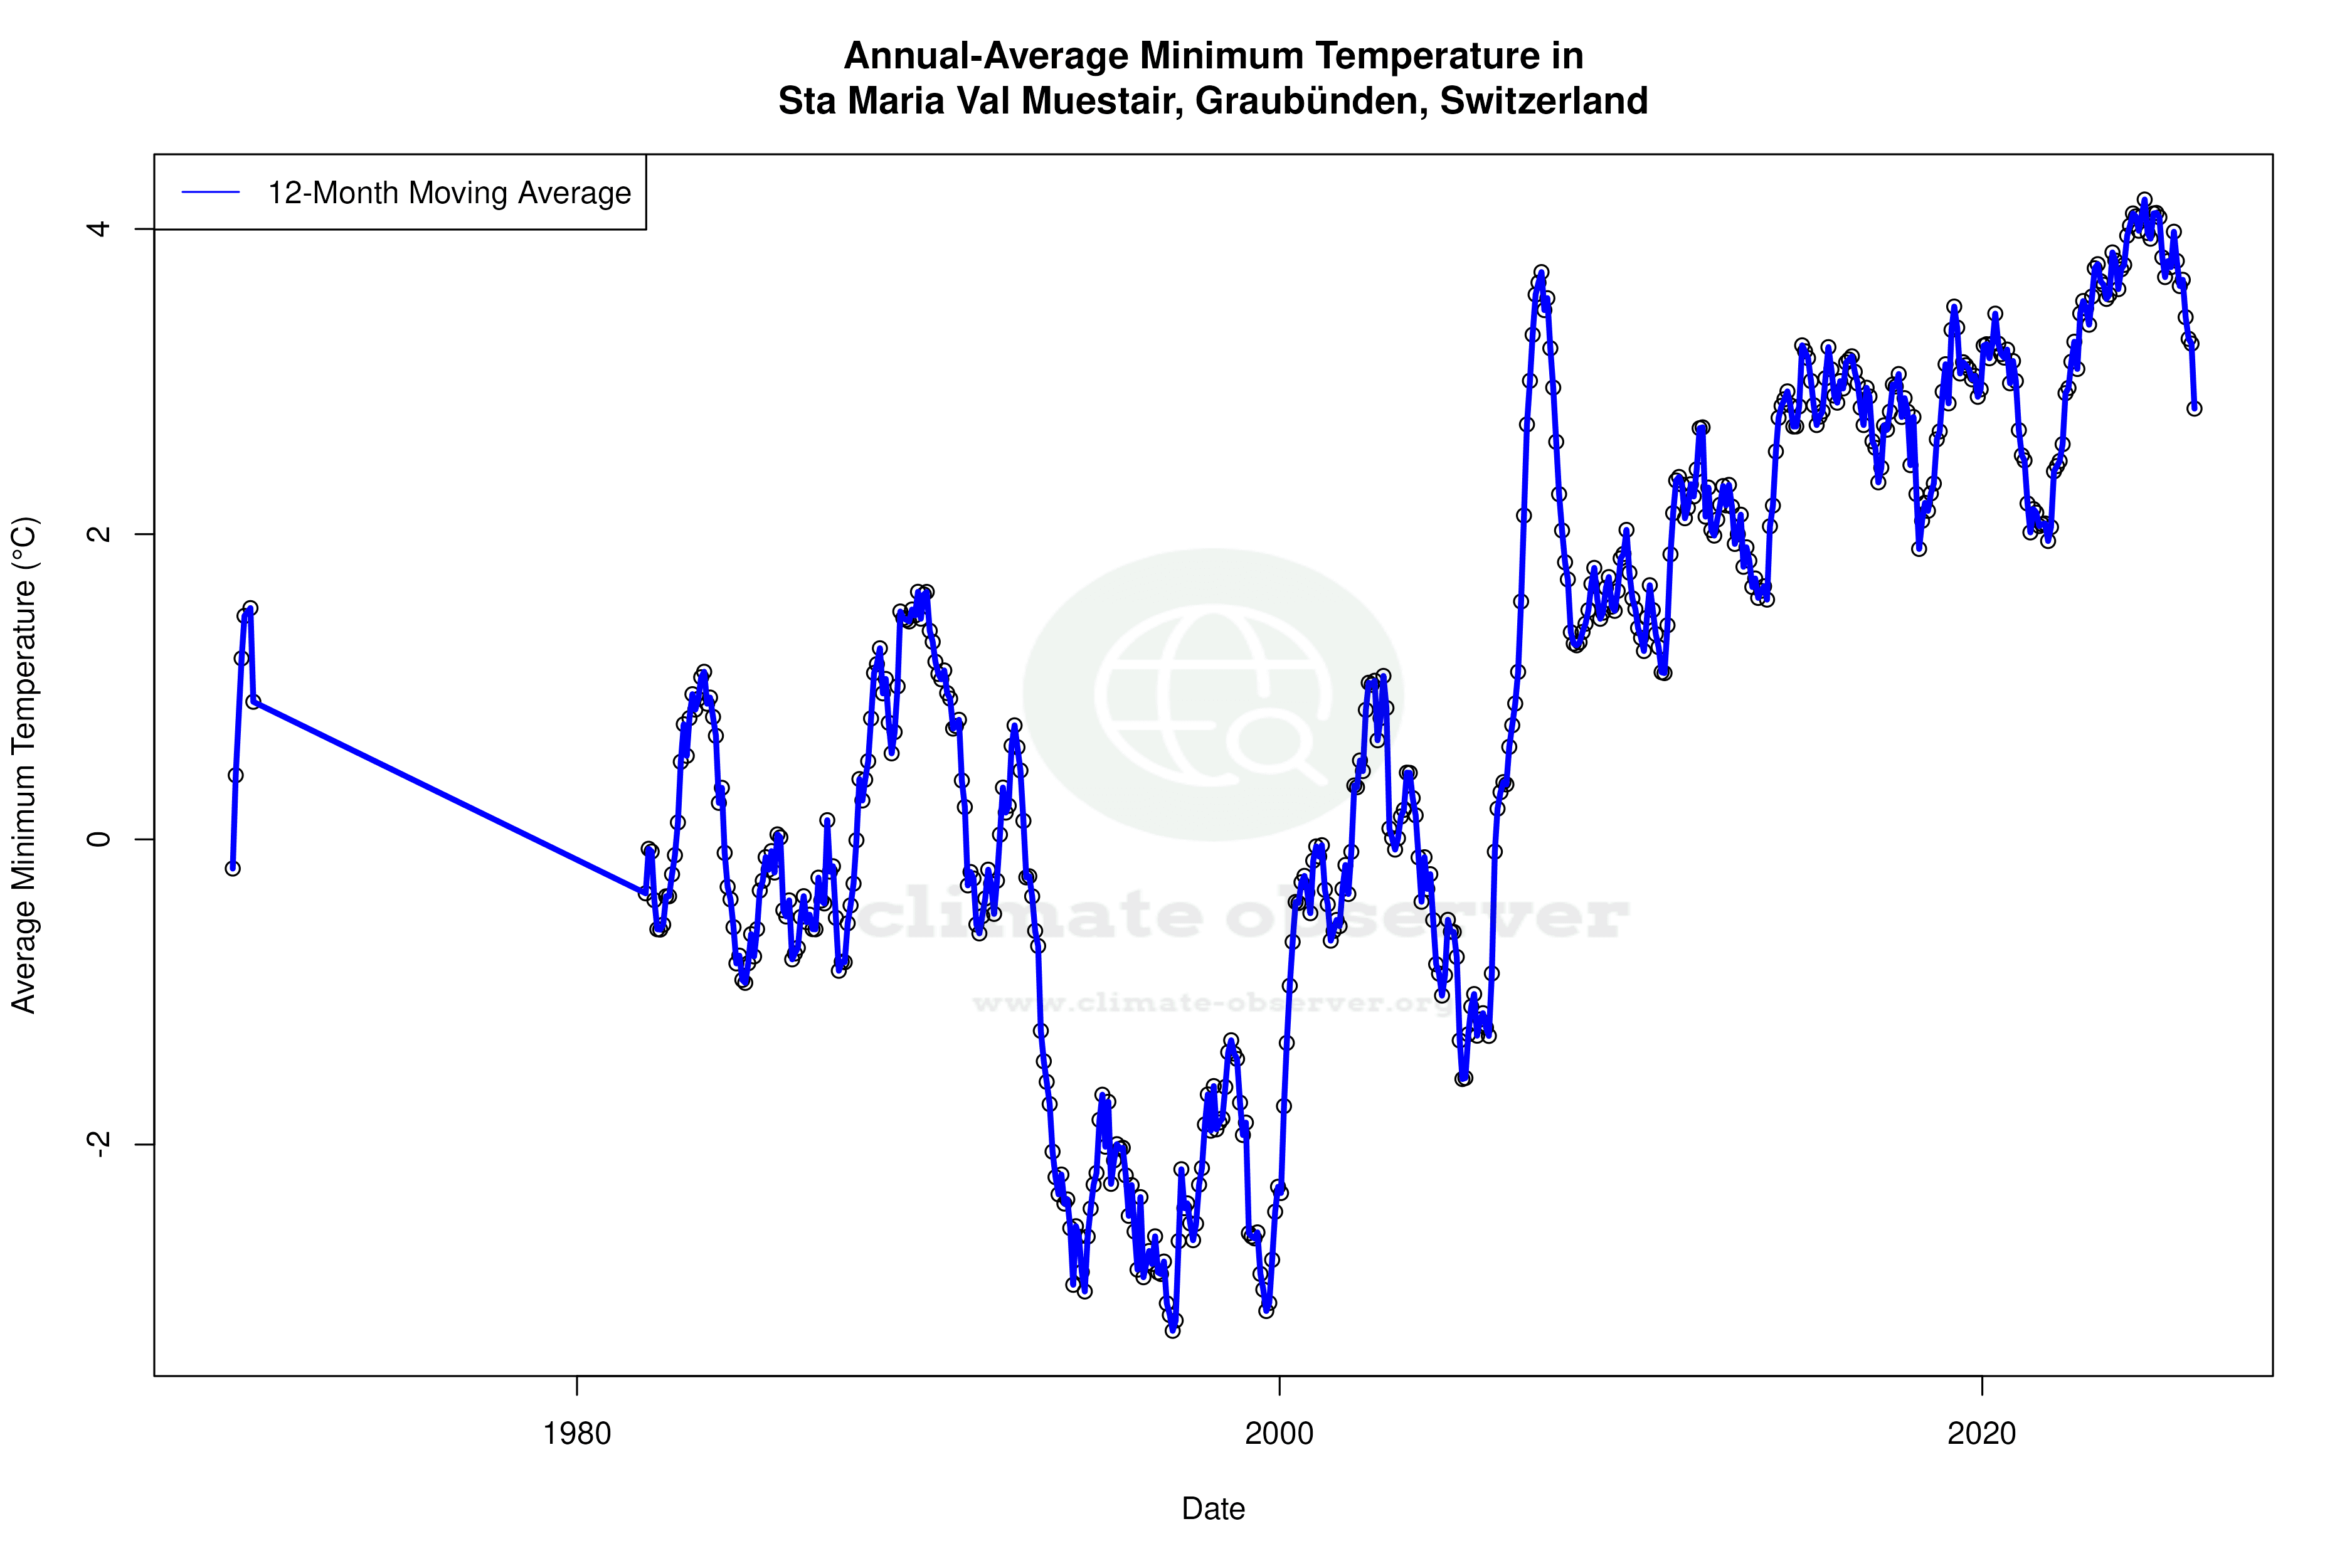


Max Temperature 12-Month MA | 1 of 6
Daily Data Points and Averages Throughout the Year


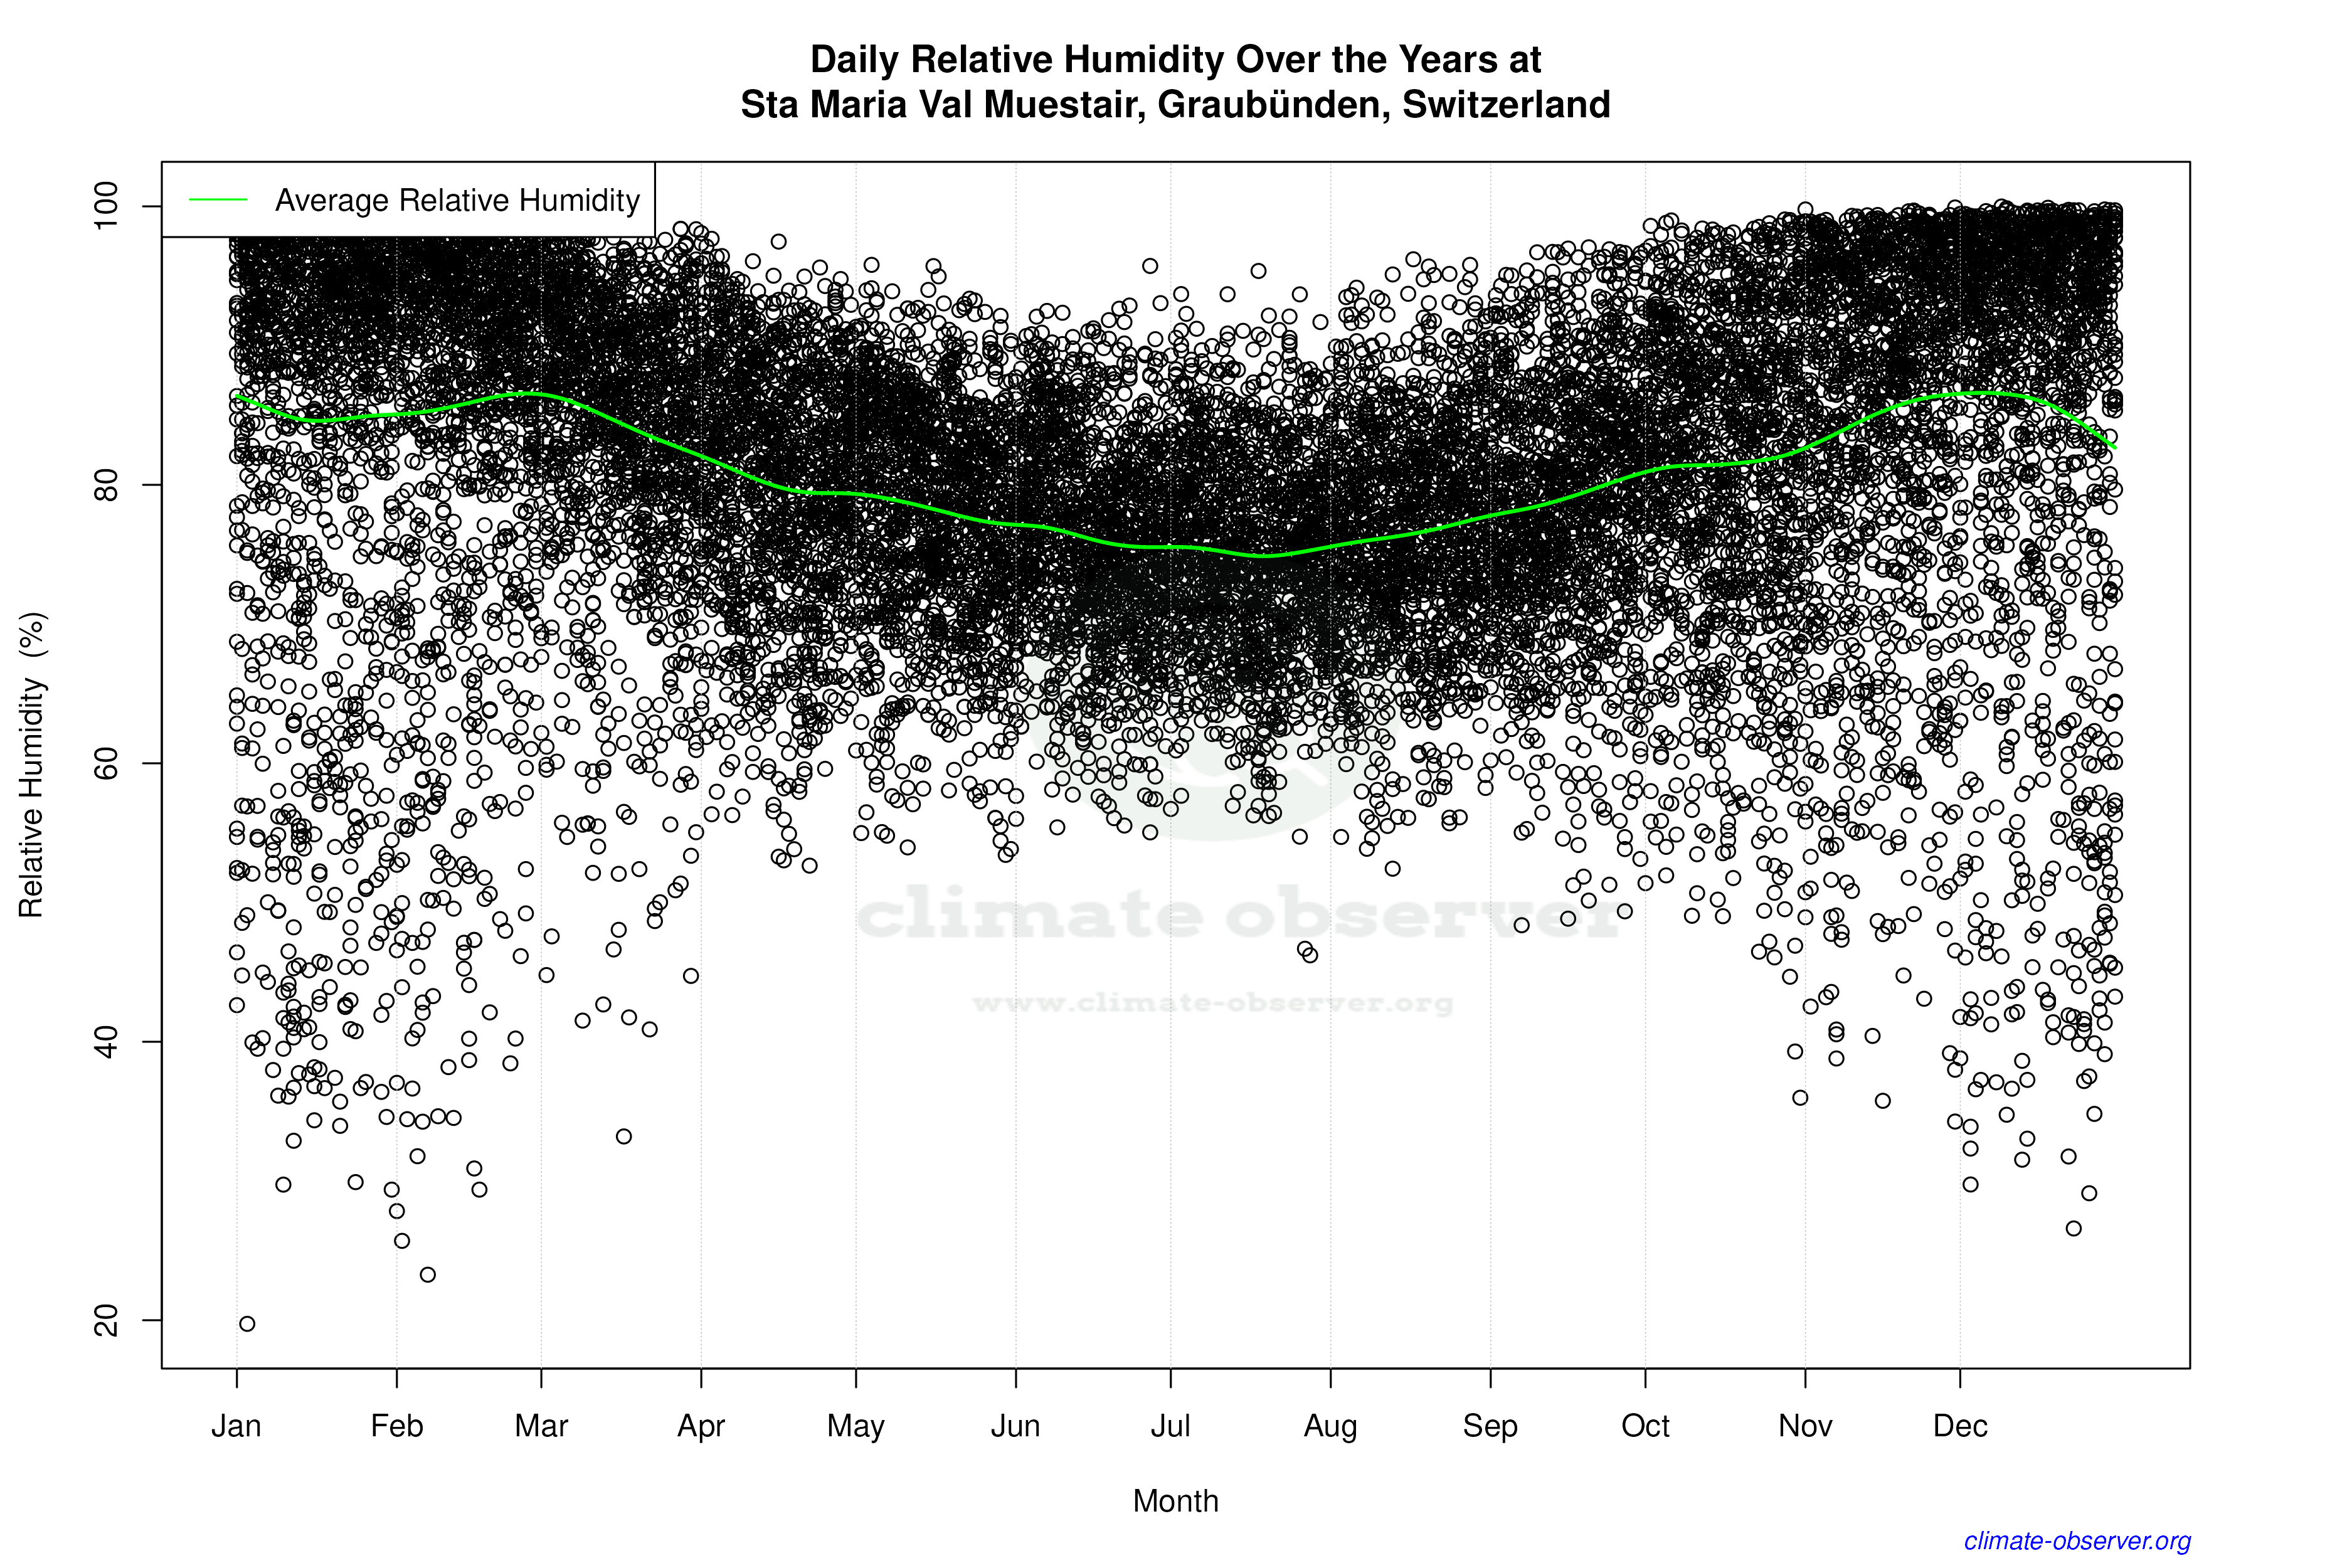

Average Max Temperature Throughout Year | 1 of 5
