Climate for Station: Kurgan-Tyube, Khatlon, Tajikistan
Loading live weather...
Climate Analysis & Overview
Kurgan-Tyube, located in southern Tajikistan, is experiencing a notable warming trend, particularly in low temperatures. The region's precipitation is slightly more concentrated, indicating potential shifts in seasonal rainfall patterns. These changes align with broader regional climate goals aimed at understanding and adapting to climate variability.
Warming Low Temperatures
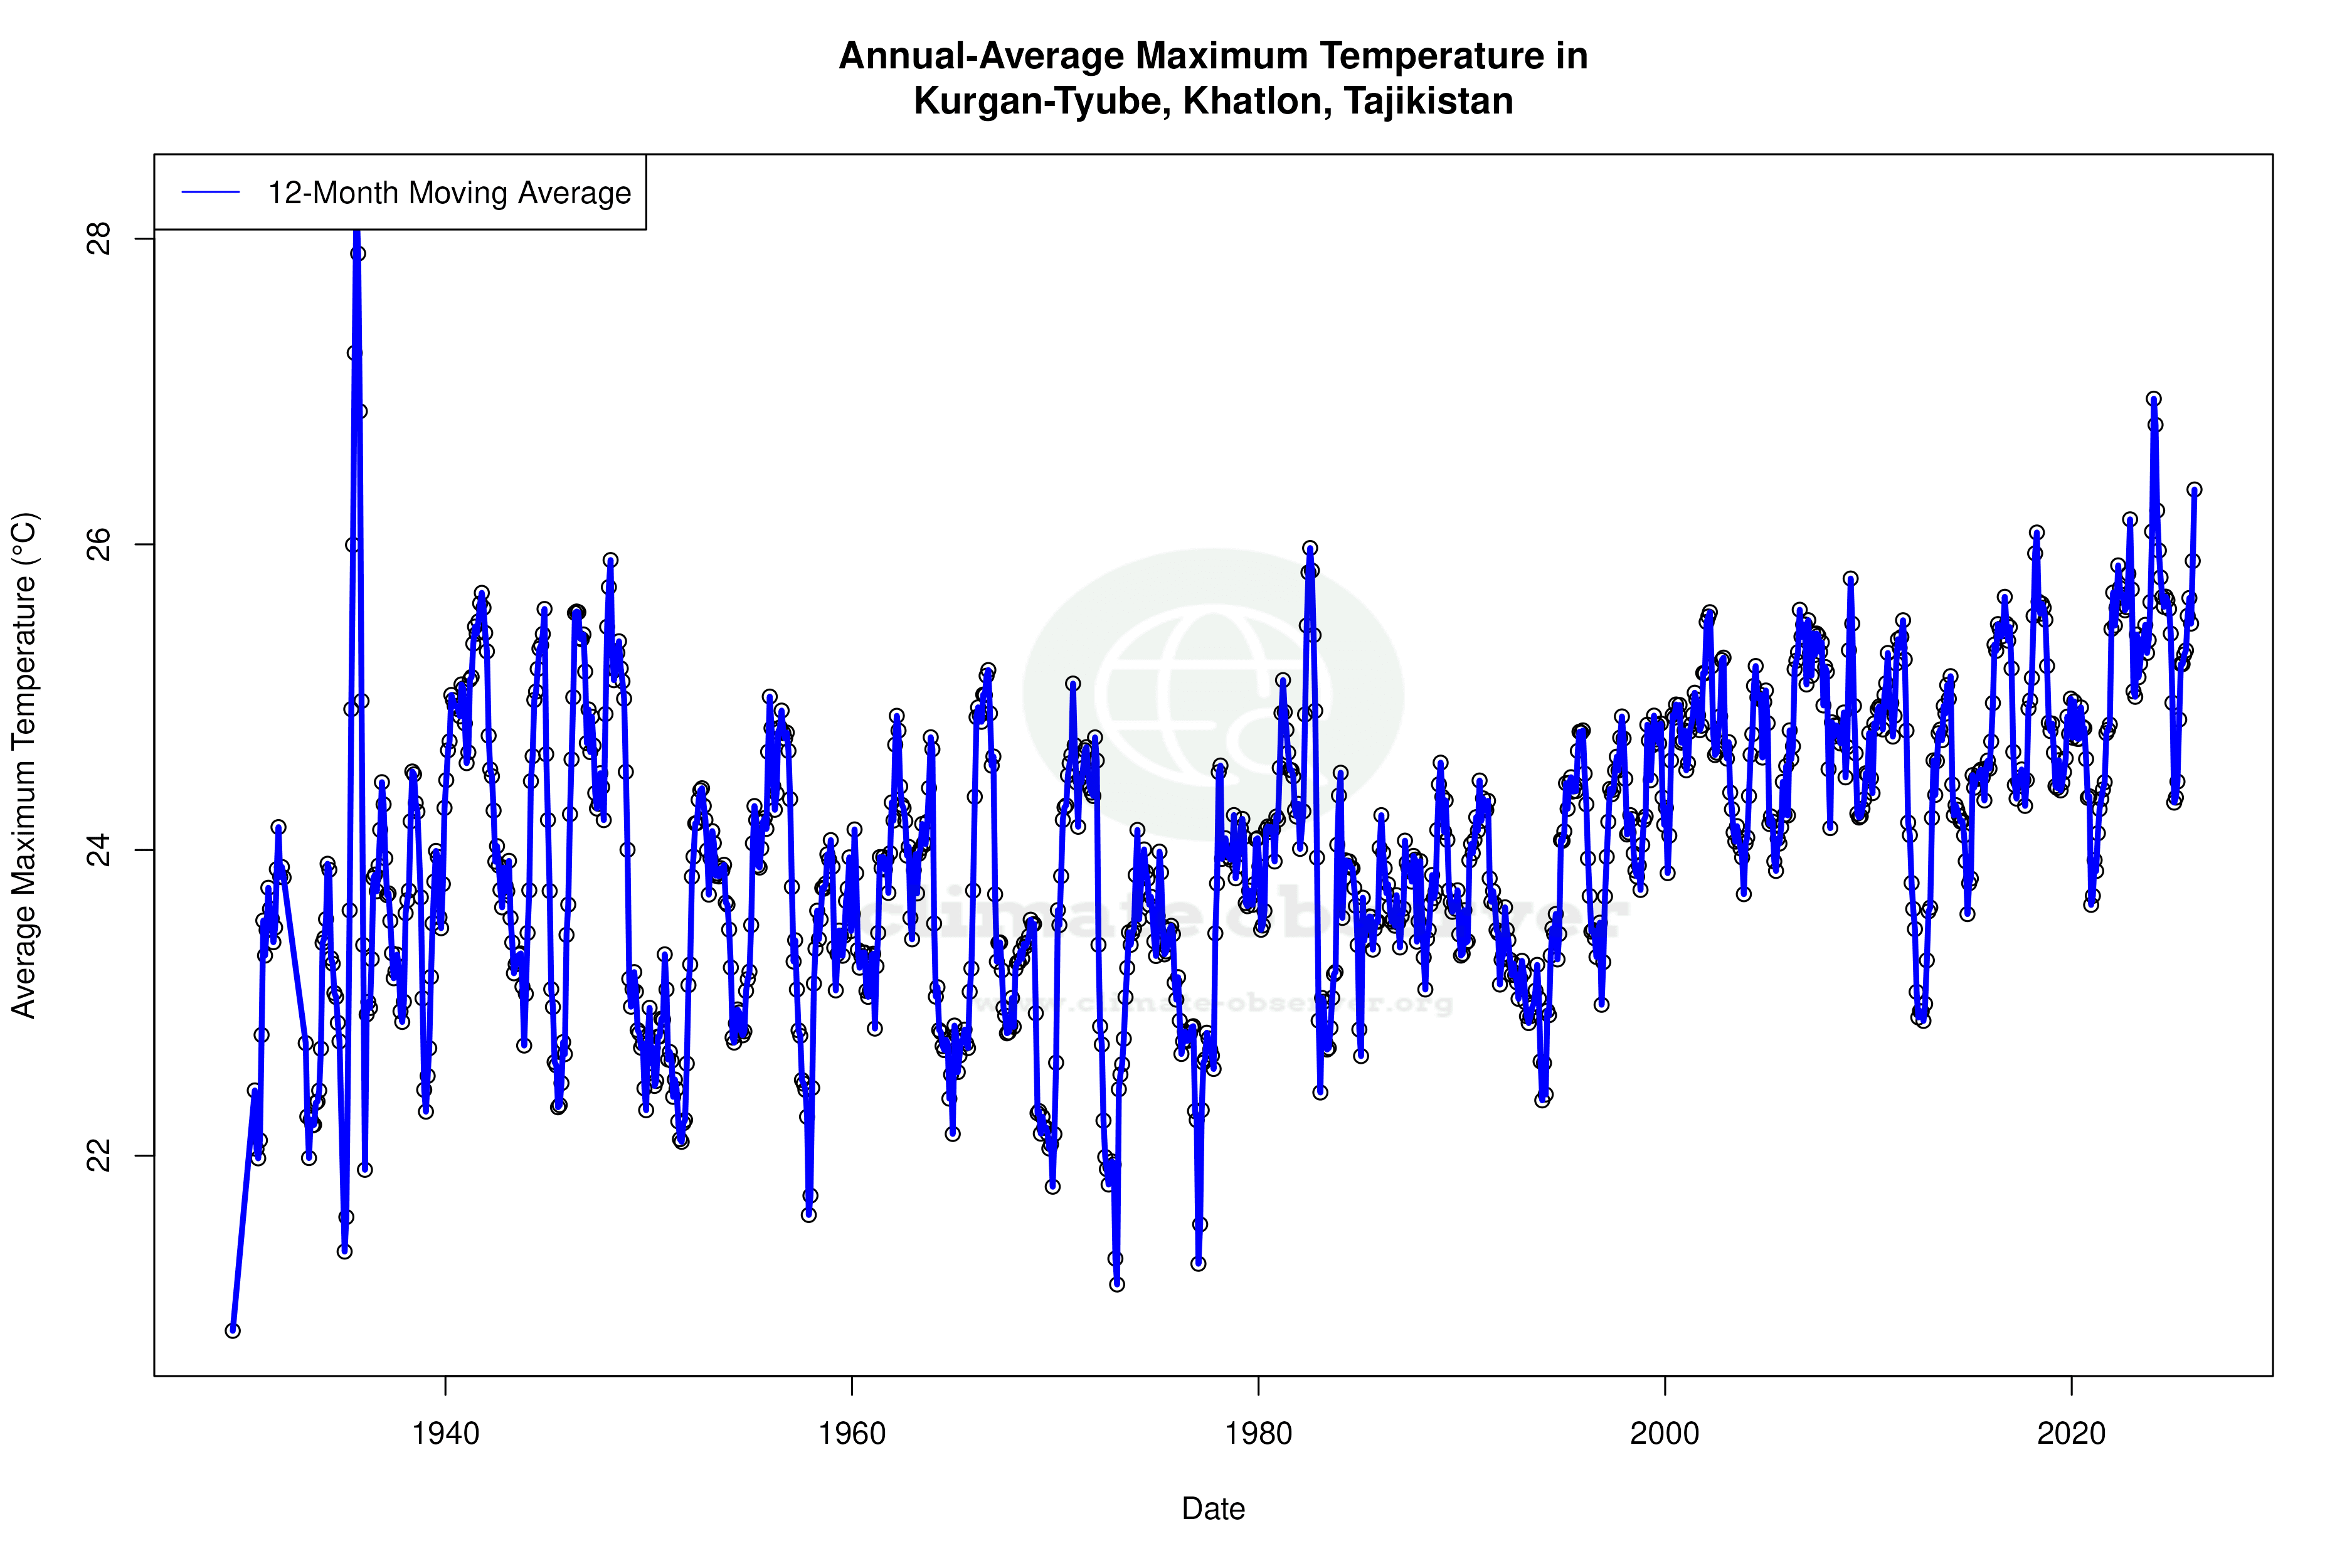
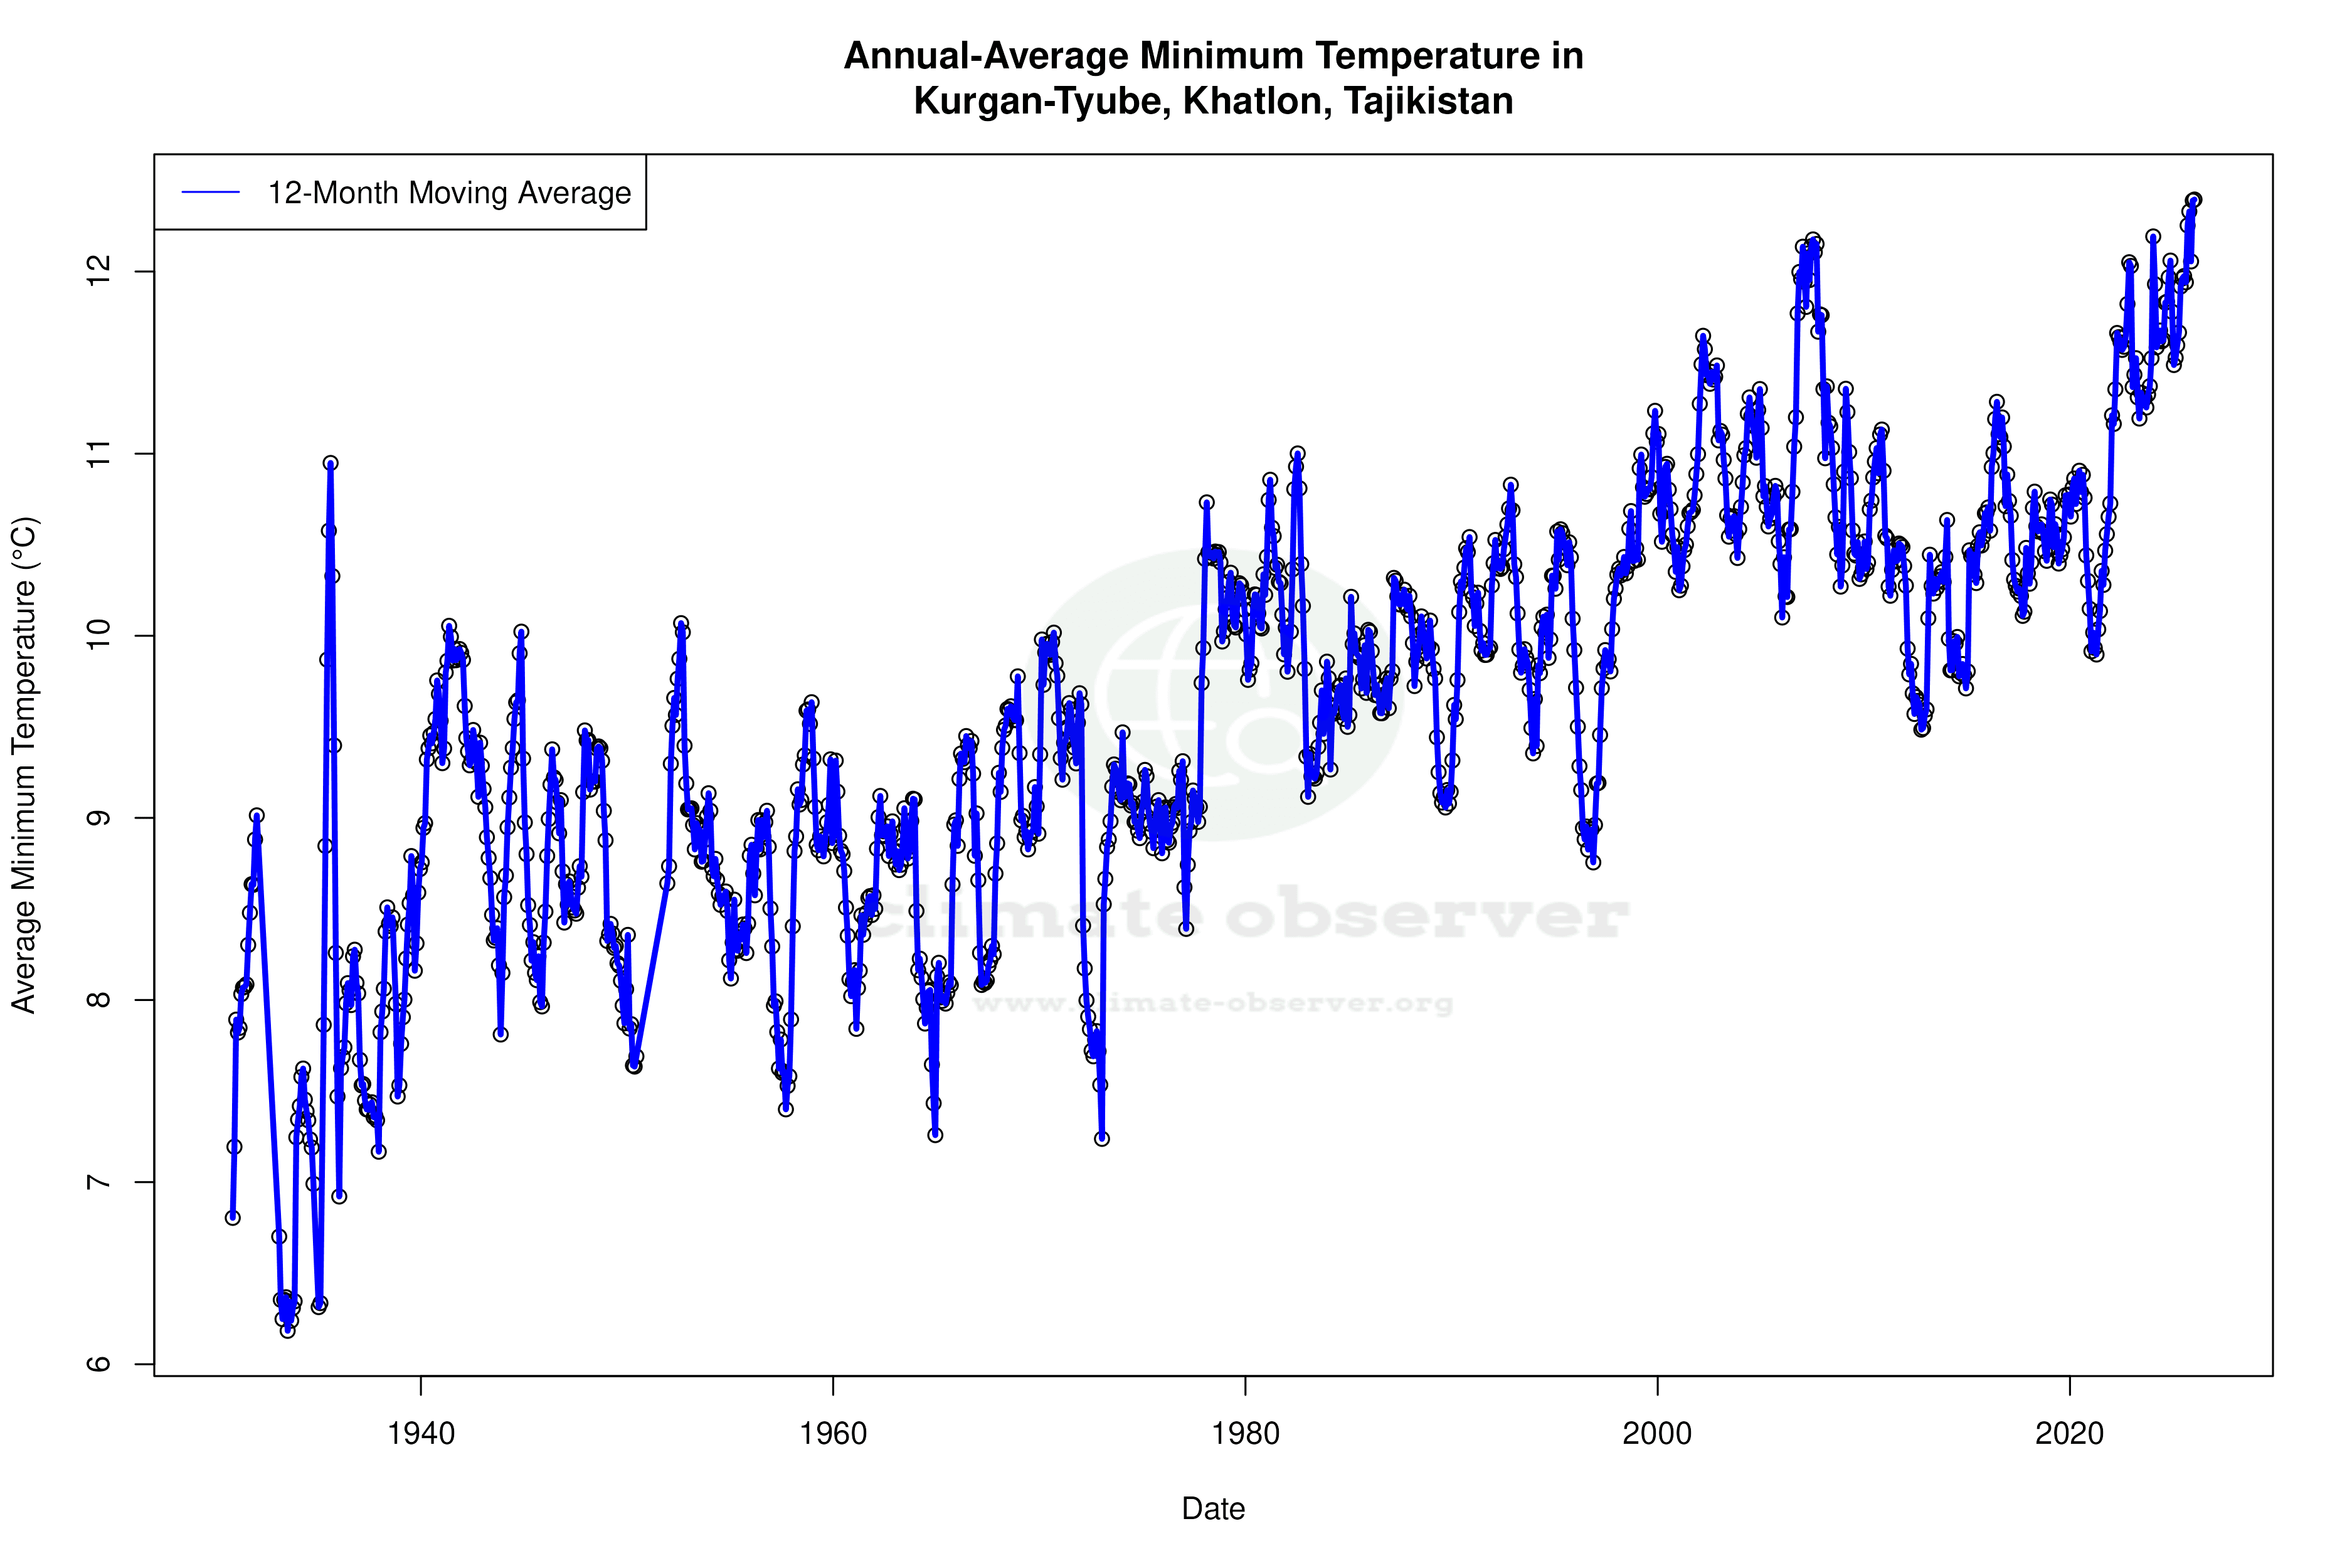
Kurgan-Tyube, situated in a region characterised by a cold desert climate (BWk) under the Köppen classification, is witnessing significant thermal changes. Over the past decade, the low temperatures have increased by 1.92°C (3.46°F), a substantial rise compared to the all-time trend of 0.35°C (0.63°F). This suggests a pronounced warming in the cooler parts of the day, which may affect local agriculture and water resources. The high temperatures have seen a smaller increase, with a 10-year trend of 0.10°C (0.18°F) and an all-time trend of 0.15°C (0.27°F), indicating a consistent but less dramatic warming of daytime temperatures.
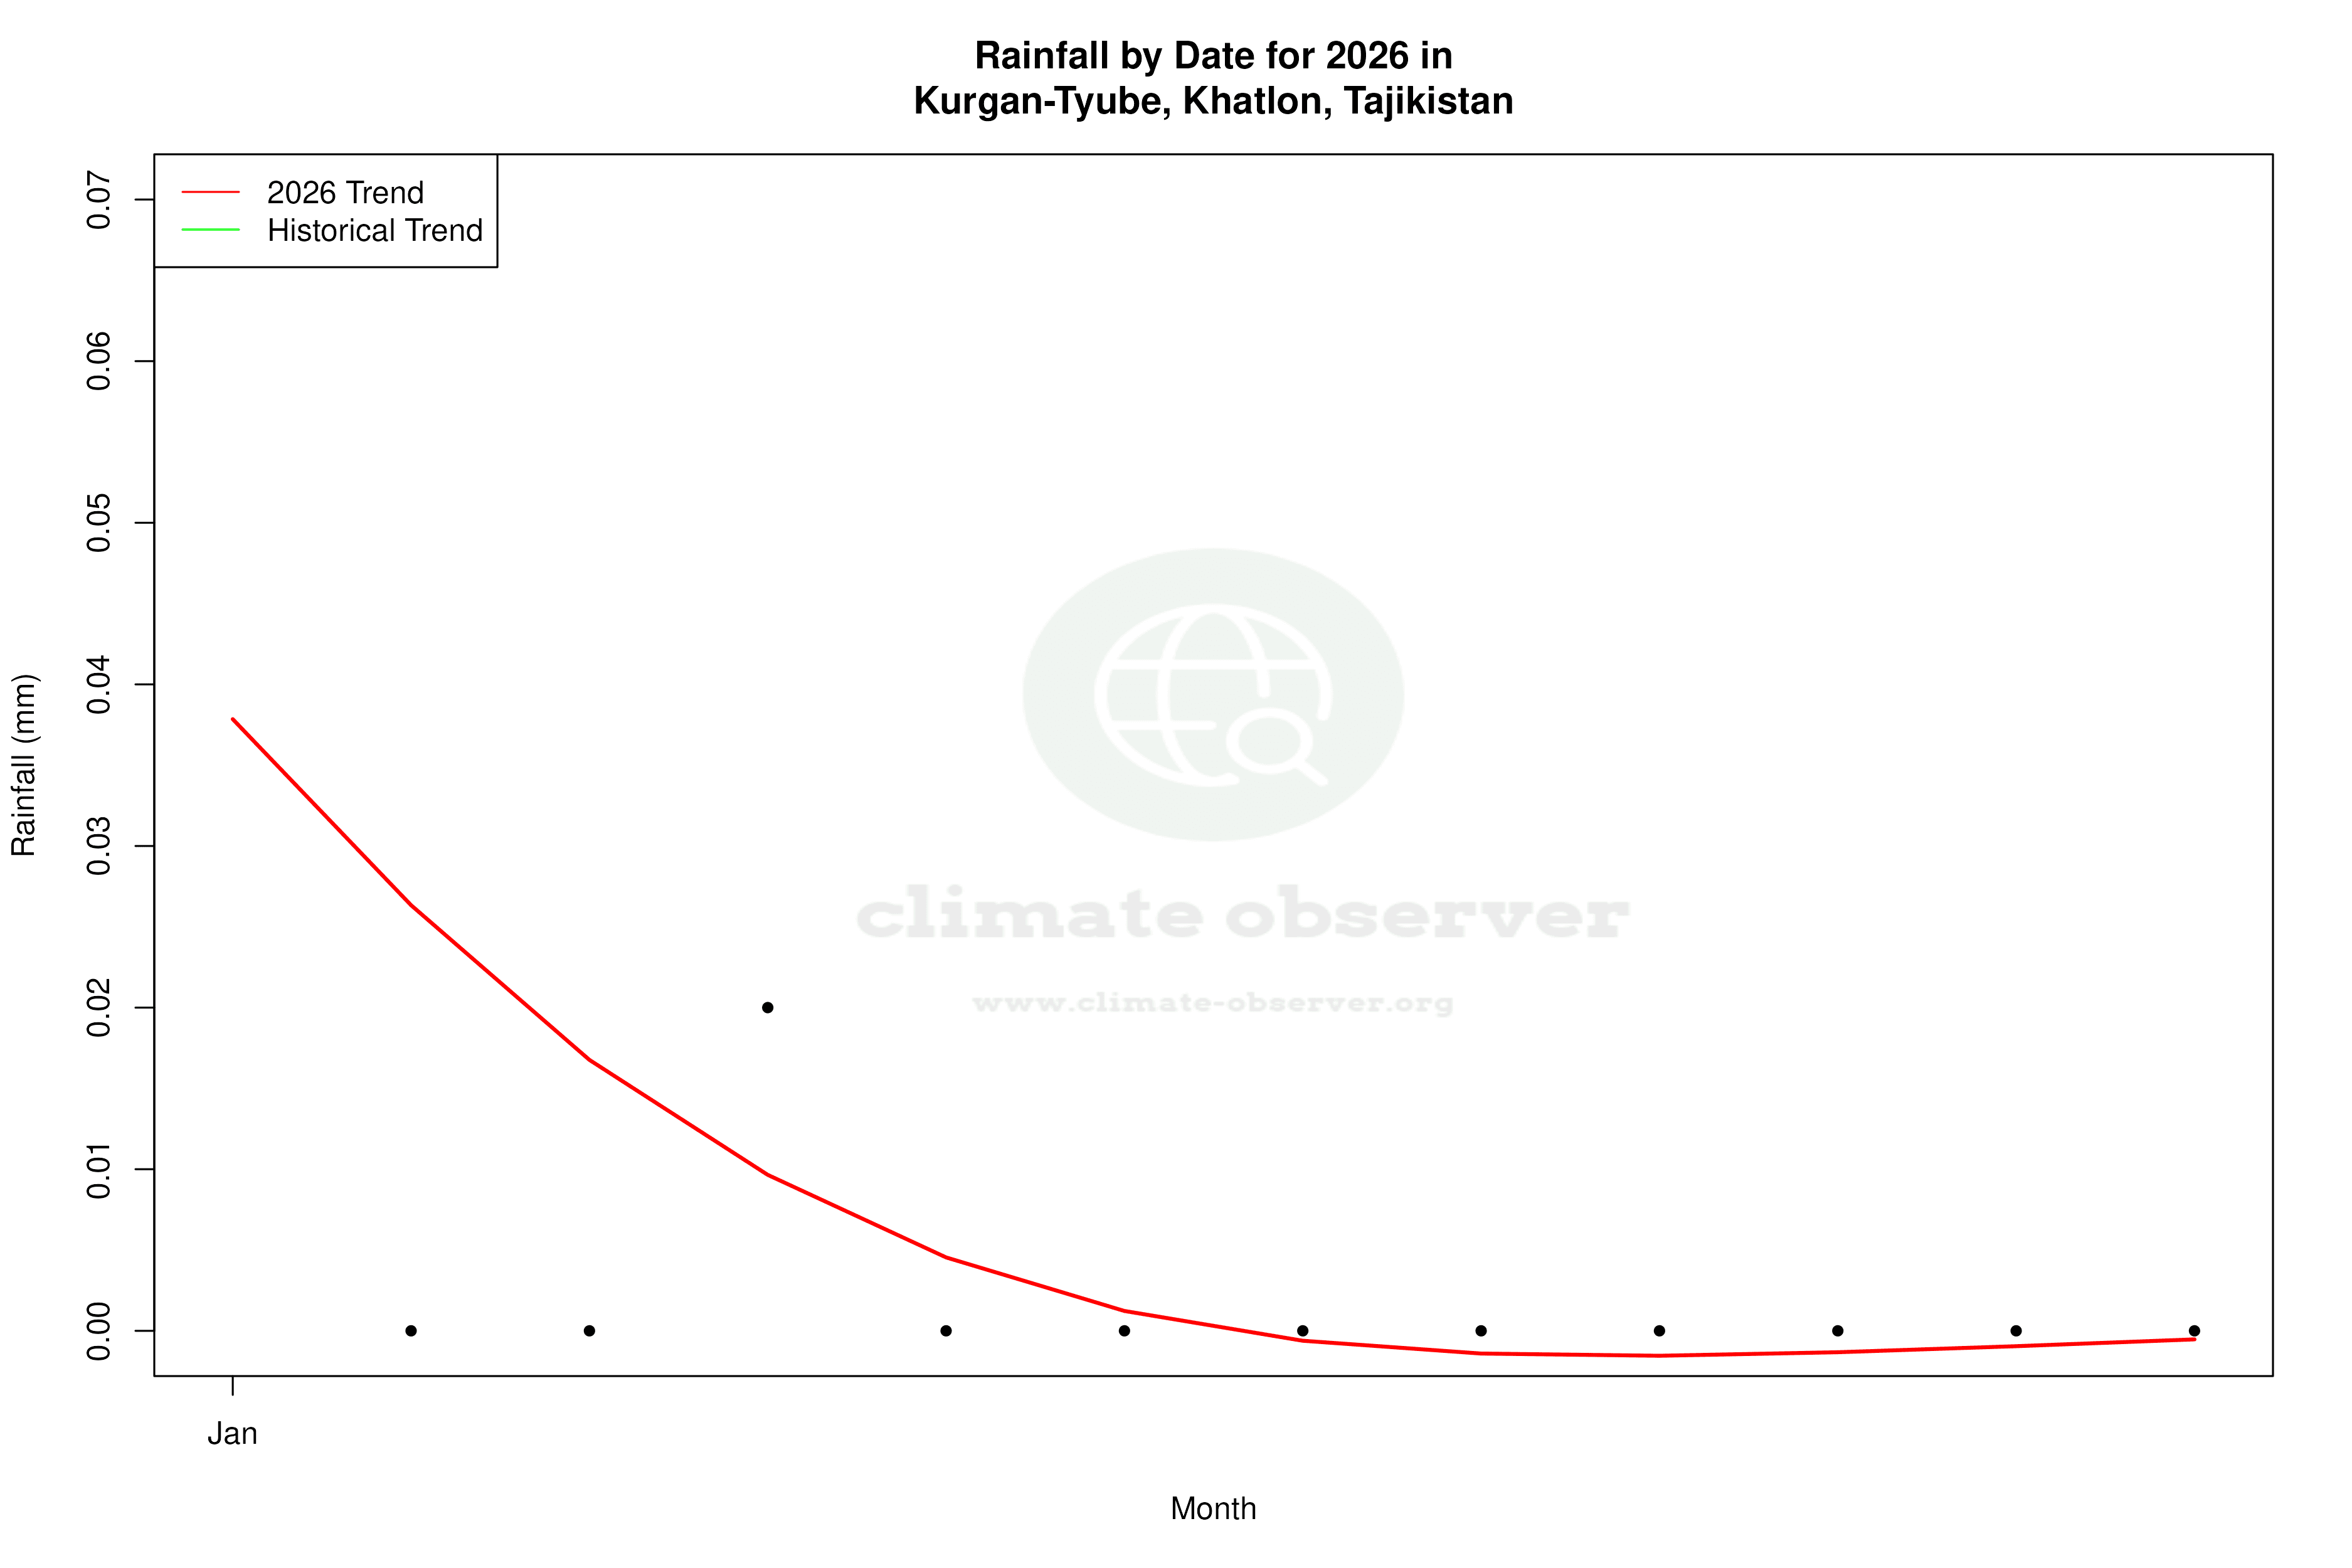
Precipitation Patterns and Concentration
The Precipitation Concentration Index (PCI) for Kurgan-Tyube has shown a slight increase from a baseline of 18.46 to a current value of 18.92. This suggests that precipitation events are becoming marginally more concentrated, occurring in fewer, more intense episodes. While this change is not drastic, it could indicate shifts towards more sporadic rainfall, which might challenge water management and agricultural planning in the region. Understanding these patterns is crucial for adapting to potential impacts on local ecosystems and water supply.
Temperature Extremes
Extreme temperatures in Kurgan-Tyube reflect its harsh climatic conditions. The station has recorded an absolute maximum temperature of 46.0°C (114.8°F) and a minimum of -20.5°C (-4.9°F). These extremes highlight the variability and potential challenges faced by the region, particularly in terms of heatwaves and cold snaps. Such conditions necessitate robust infrastructure and adaptive strategies to mitigate their impacts on human health and economic activities.
Regional Climate Context
Tajikistan's mountainous terrain significantly influences its climate, contributing to the variability seen in Kurgan-Tyube. The region's climate goals focus on resilience and adaptation, recognising the need to manage water resources effectively and mitigate the impacts of climate change. Recent weather events, such as unseasonal rainfall and temperature fluctuations, underscore the importance of these goals. By understanding these trends, Kurgan-Tyube can better prepare for future climatic shifts, ensuring sustainable development and environmental protection.
Station Statistics
10-Year Trend
High: +0.23 °F/decade
Low: +4.00 °F/decade
Rain: +0.002 in/decade
25-Year Trend
High: +0.29 °F/decade
Low: +0.43 °F/decade
Rain: +0.004 in/decade
50-Year Trend
High: +0.65 °F/decade
Low: +0.61 °F/decade
Rain: -0.000 in/decade
All-Time Trend
High: +0.27 °F/decade
Low: +0.64 °F/decade
Rain: -0.000 in/decade
Percentage Above-Average Days
Last 12 Months: 54.5%
This Year: 57.8%
Precipitation Concentration Index (PCI) ℹ️
Last 12 Months: 15.4
Historical Average: 18.1
Percentile Rank of Last 12 Months ℹ️
High: 74th percentile
Low: 99th percentile
Rain: 68th percentile
Change in Variance ℹ️
High: -7.5%
Low: +1.4%
Intraday: -20.7%
Data Coverage
96.1%
First Year of Data
1929
Station Location
Historical Weather Records
| Max High | Avg High | Min High | Max Avg | Avg Avg | Min Avg | Max Low | Avg Low | Min Low | Max Precipitation | Avg Precipitation | Max Snow | Avg Snow | |
|---|---|---|---|---|---|---|---|---|---|---|---|---|---|
| Record | 114.80 °F | — | 9.50 °F | 100.58 °F | — | -1.84 °F | 85.82 °F | — | -4.90 °F | 1.78 in | — | — | — |
| January | 72.14 °F | 46.73 °F | 9.50 °F | 58.28 °F | 37.48 °F | -1.84 °F | 54.50 °F | 29.93 °F | -4.36 °F | 1.19 in | 0.05 in | — | — |
| February | 83.84 °F | 53.50 °F | 14.72 °F | 64.58 °F | 42.73 °F | 5.00 °F | 54.14 °F | 34.19 °F | -4.36 °F | 1.15 in | 0.06 in | — | — |
| March | 95.54 °F | 64.01 °F | 25.88 °F | 78.44 °F | 52.51 °F | 21.56 °F | 63.68 °F | 42.98 °F | 7.70 °F | 1.52 in | 0.07 in | — | — |
| April | 98.60 °F | 76.35 °F | 40.10 °F | 85.46 °F | 63.88 °F | 32.90 °F | 73.76 °F | 52.49 °F | 28.76 °F | 1.51 in | 0.05 in | — | — |
| May | 106.34 °F | 87.05 °F | 47.84 °F | 93.20 °F | 73.68 °F | 44.78 °F | 79.16 °F | 60.04 °F | 39.20 °F | 1.22 in | 0.03 in | — | — |
| June | 111.20 °F | 96.79 °F | 69.08 °F | 96.98 °F | 82.15 °F | 60.80 °F | 83.84 °F | 65.76 °F | 48.38 °F | 1.04 in | 0.00 in | — | — |
| July | 114.80 °F | 99.76 °F | 82.58 °F | 100.58 °F | 84.70 °F | 72.68 °F | 85.82 °F | 68.01 °F | 51.80 °F | 0.24 in | 0.00 in | — | — |
| August | 109.04 °F | 96.47 °F | 77.00 °F | 95.00 °F | 80.60 °F | 67.10 °F | 85.10 °F | 63.98 °F | 48.92 °F | 0.15 in | 0.00 in | — | — |
| September | 104.36 °F | 88.90 °F | 63.14 °F | 91.94 °F | 71.55 °F | 51.62 °F | 74.30 °F | 55.08 °F | 34.34 °F | 0.34 in | 0.00 in | — | — |
| October | 100.58 °F | 77.55 °F | 38.30 °F | 84.02 °F | 60.54 °F | 32.90 °F | 68.90 °F | 46.69 °F | 24.44 °F | 1.78 in | 0.01 in | — | — |
| November | 89.24 °F | 63.52 °F | 24.44 °F | 73.26 °F | 49.29 °F | 17.96 °F | 62.92 °F | 38.71 °F | 4.98 °F | 0.97 in | 0.03 in | — | — |
| December | 75.74 °F | 51.07 °F | 15.98 °F | 60.44 °F | 40.72 °F | 4.28 °F | 52.70 °F | 32.65 °F | -4.90 °F | 1.26 in | 0.04 in | — | — |
Data Visualisations
Remove WatermarksCurrent Year Climate Trends vs Historical


Max Temperature this Year | 1 of 6
Climate 12-Month Moving Averages


Max Temperature 12-Month MA | 1 of 6
Daily Data Points and Averages Throughout the Year
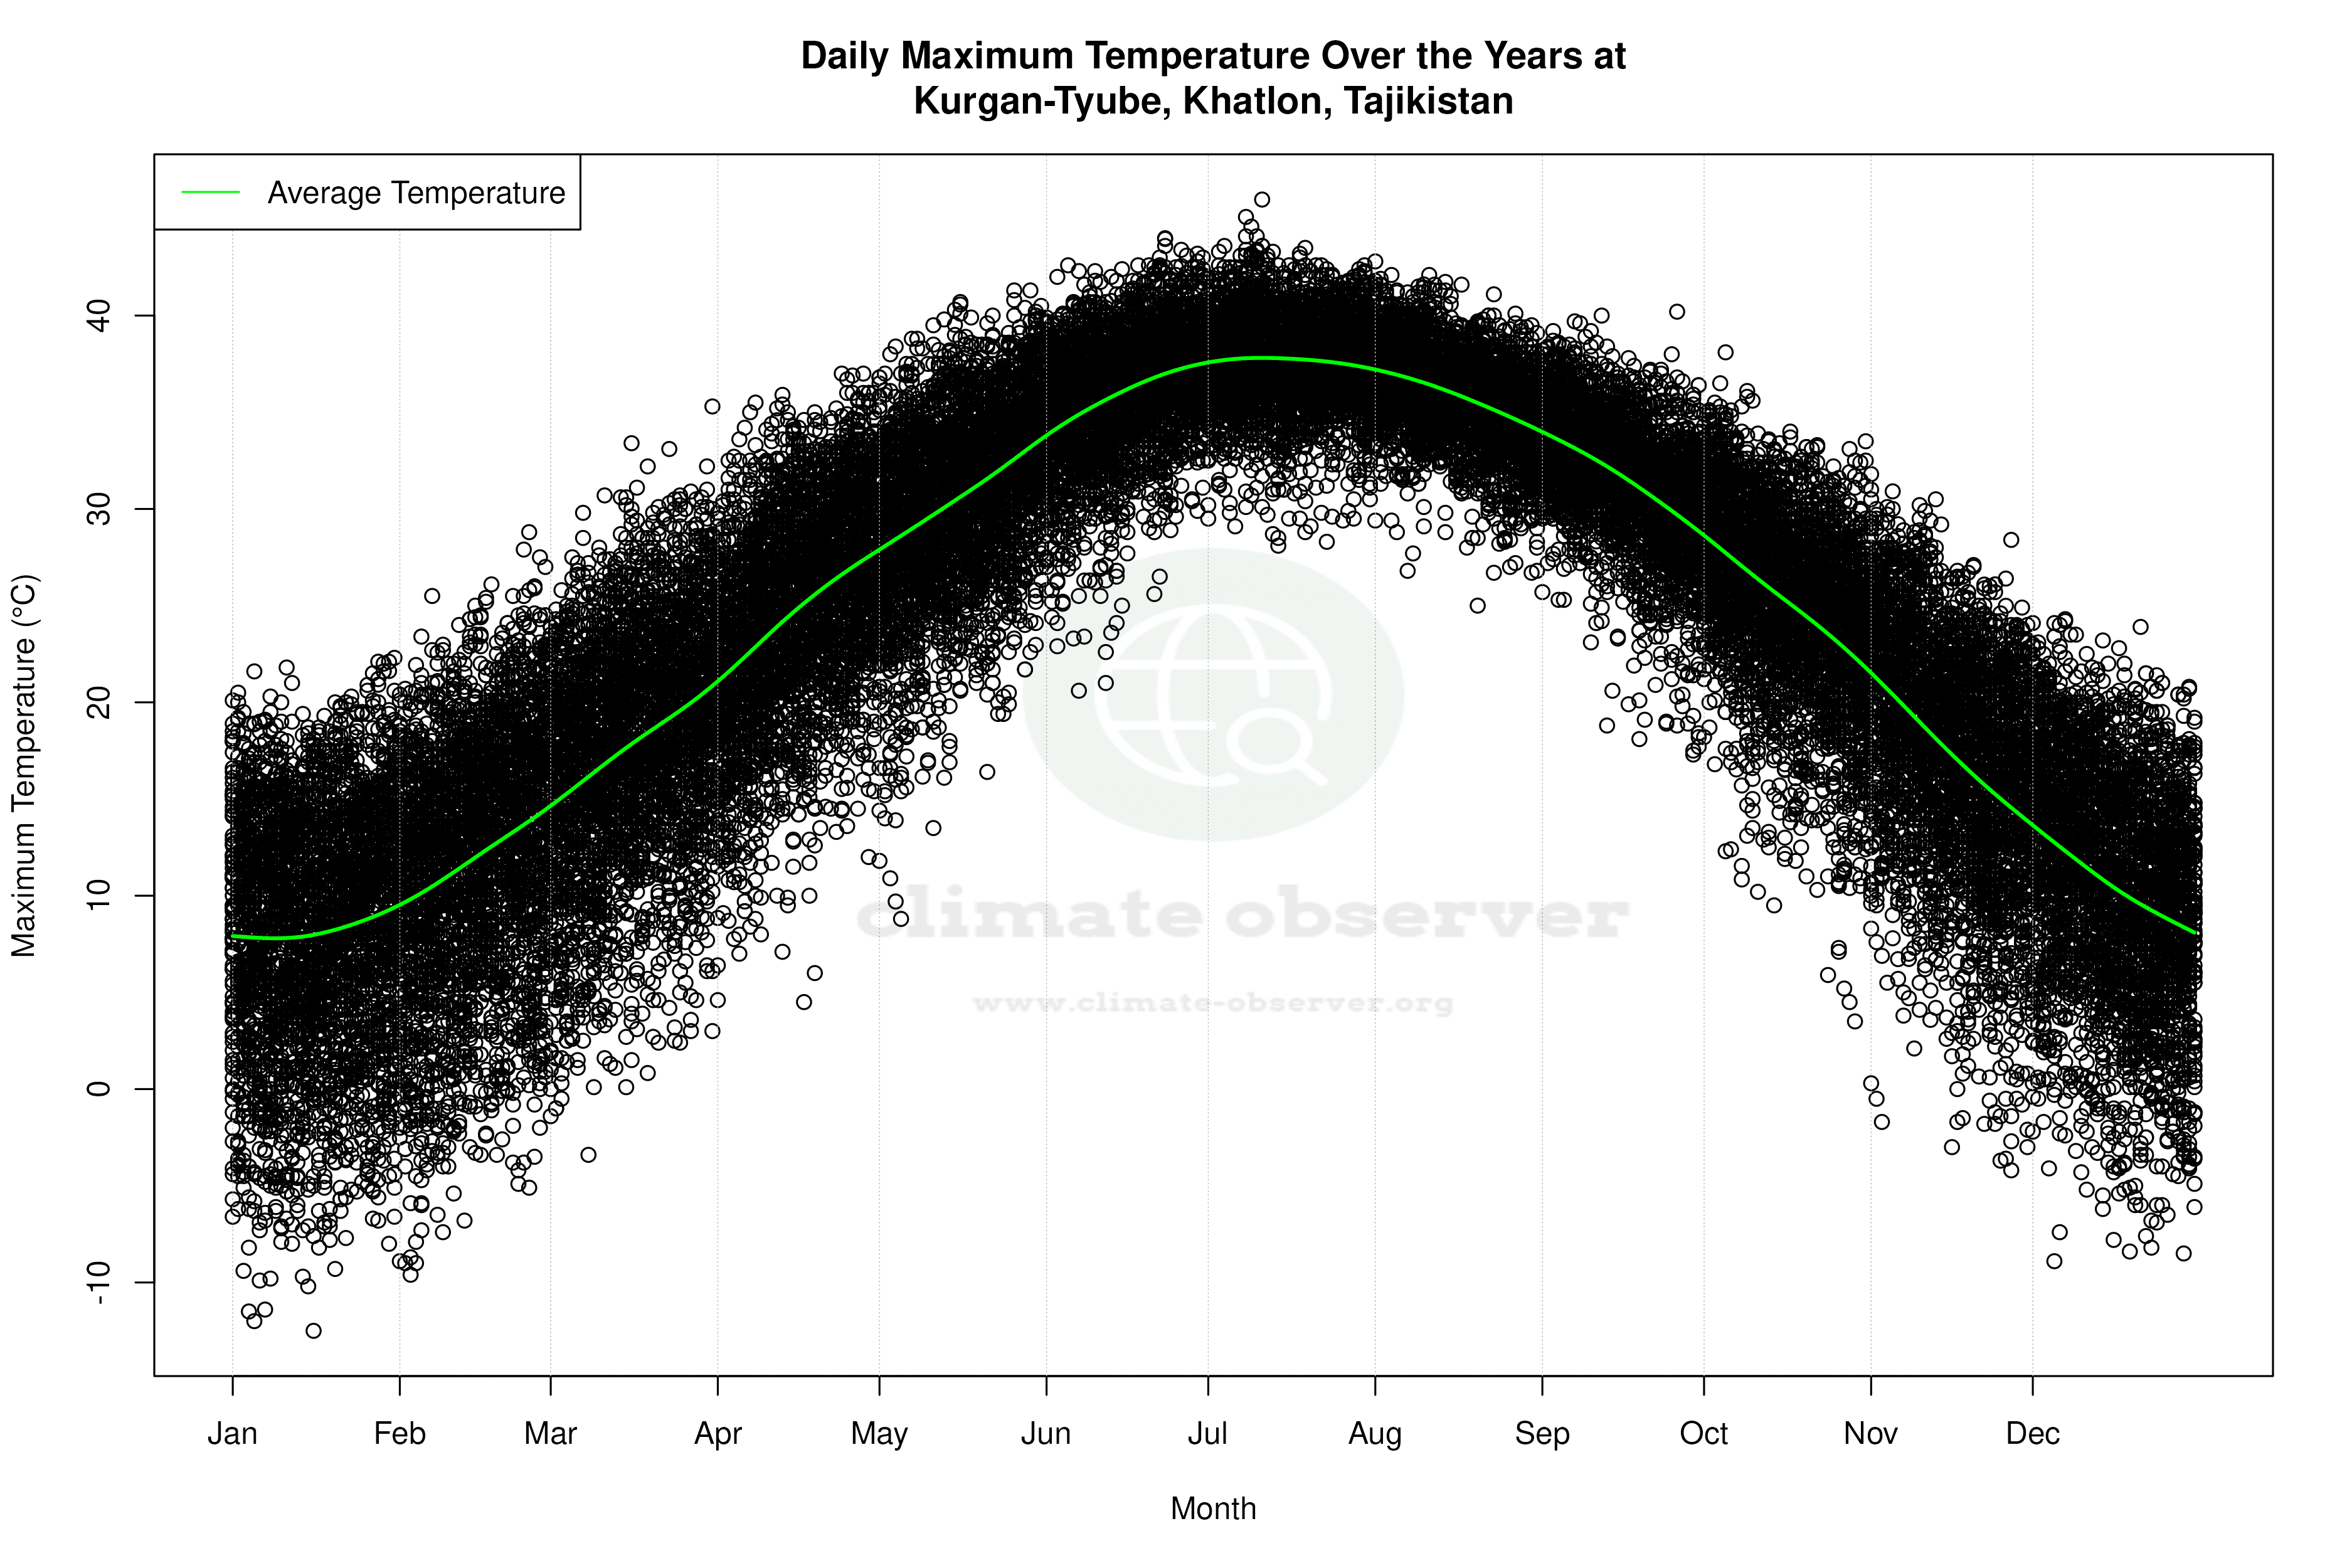
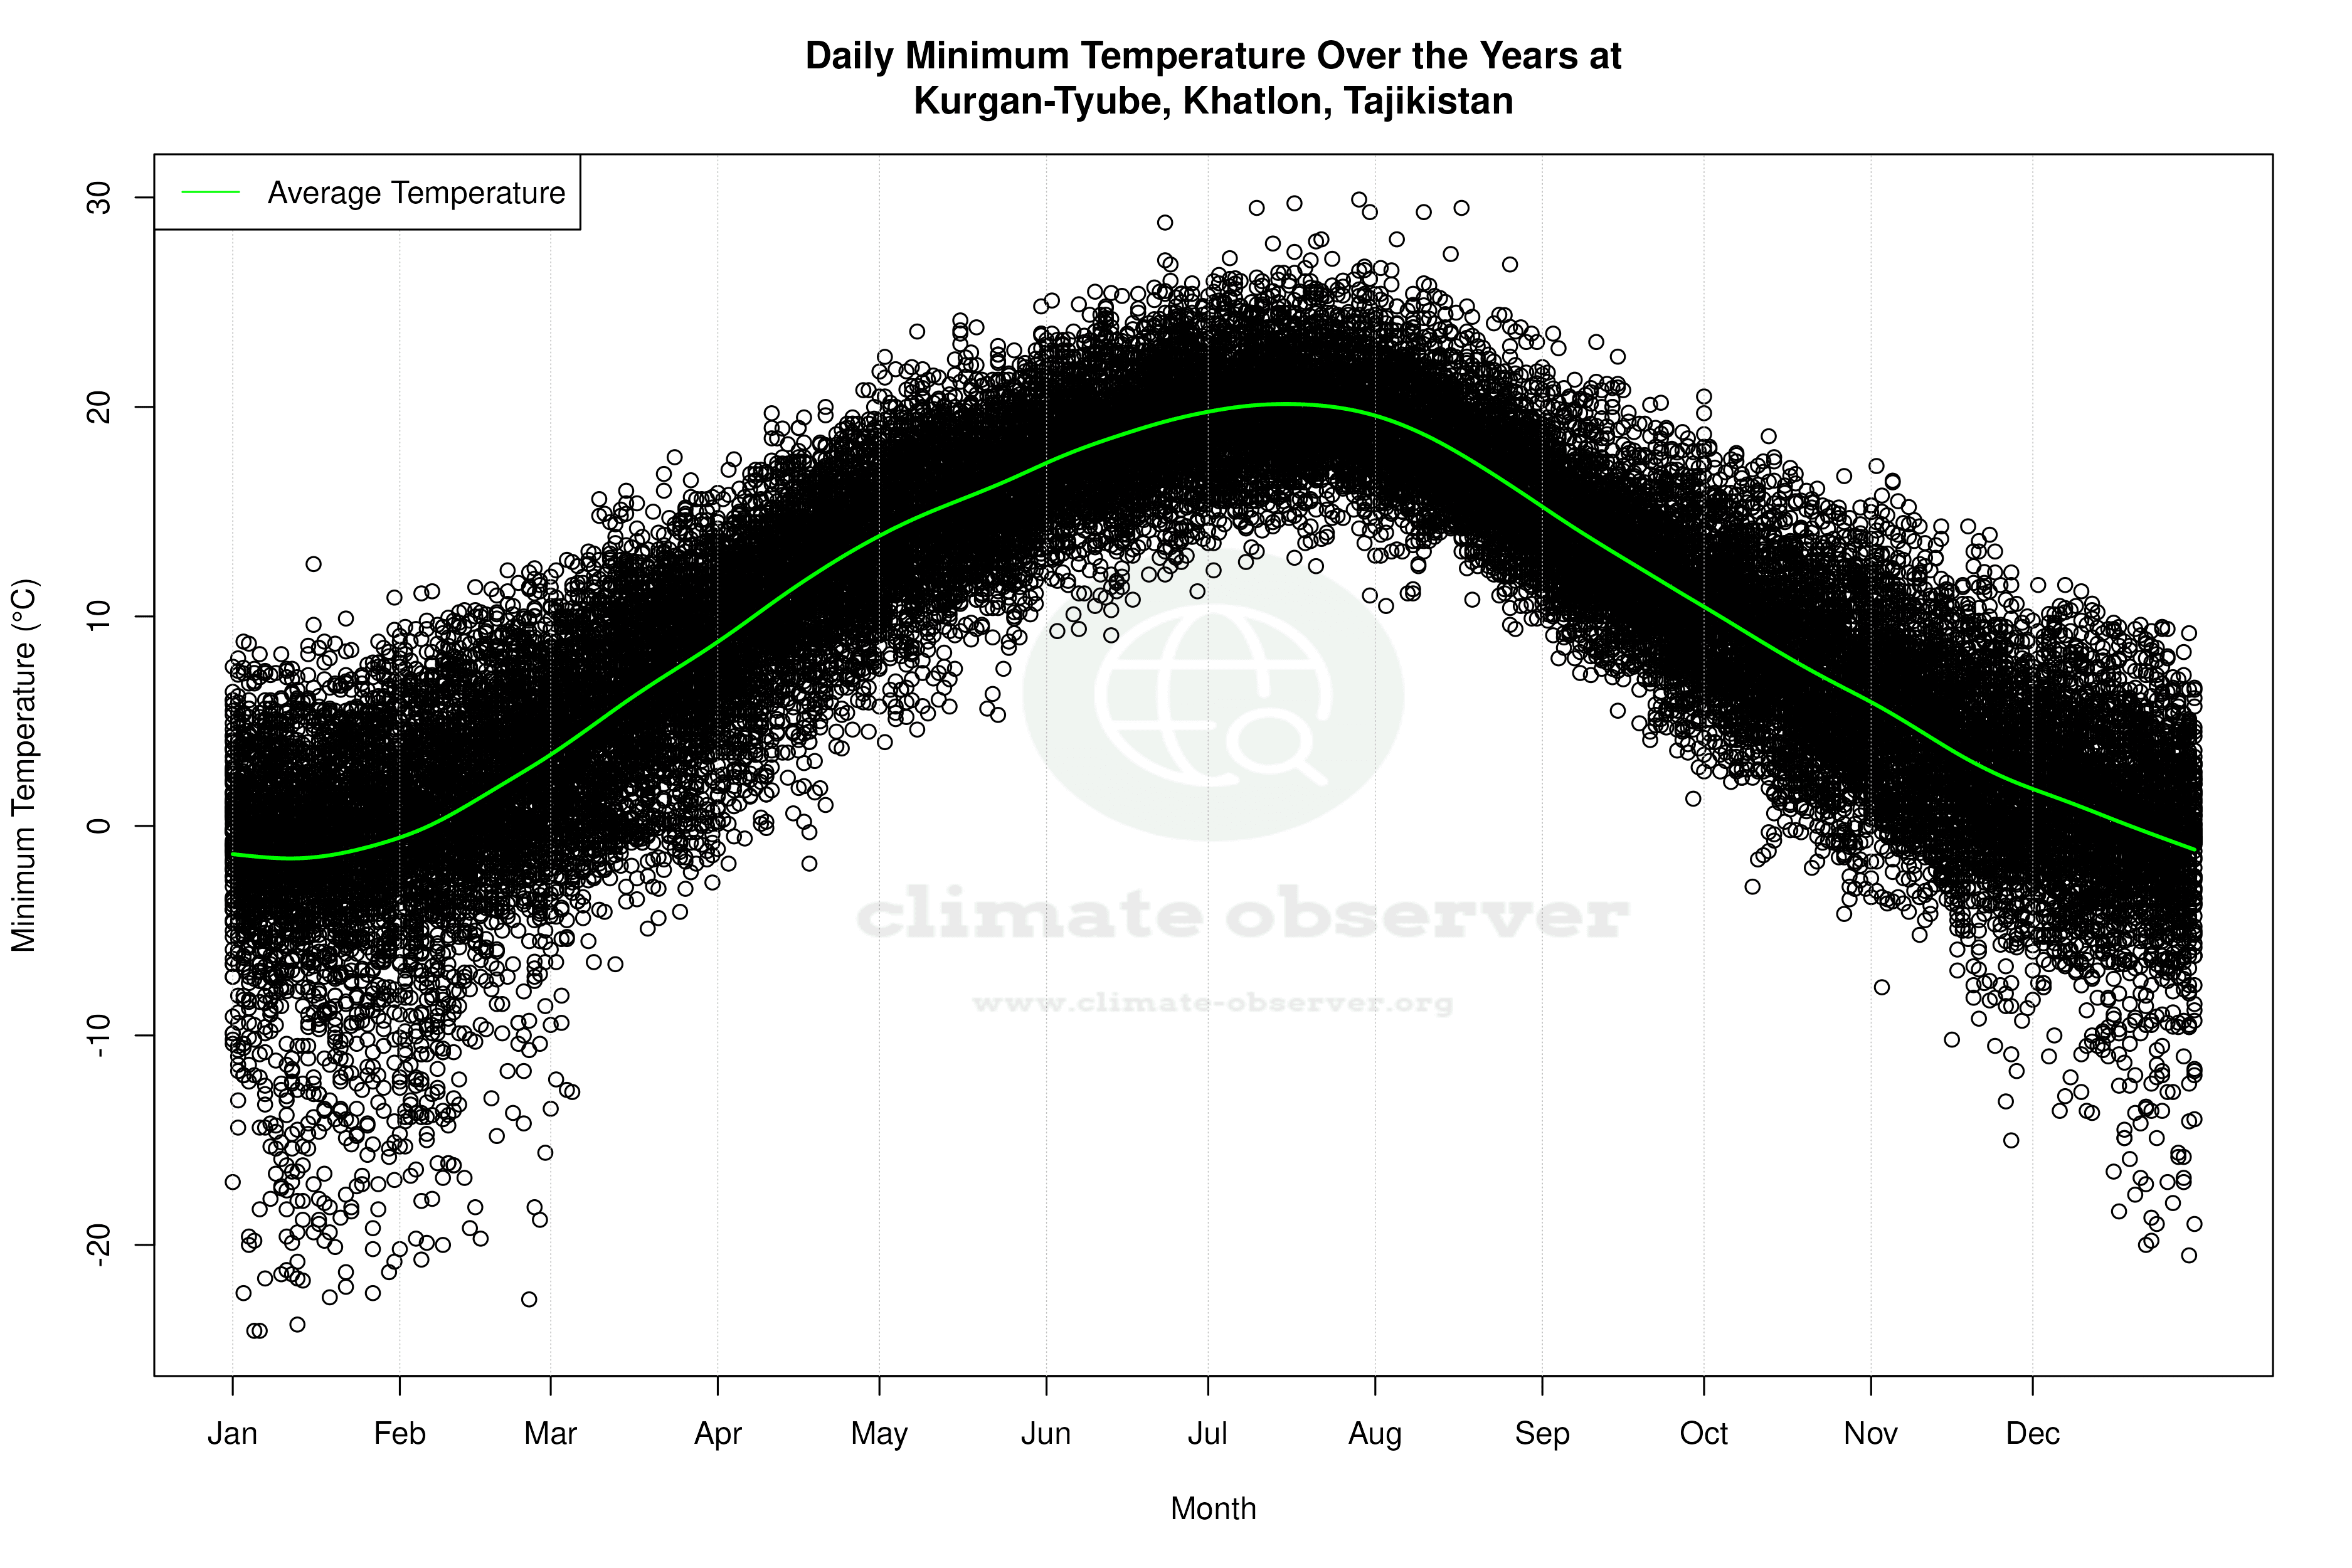
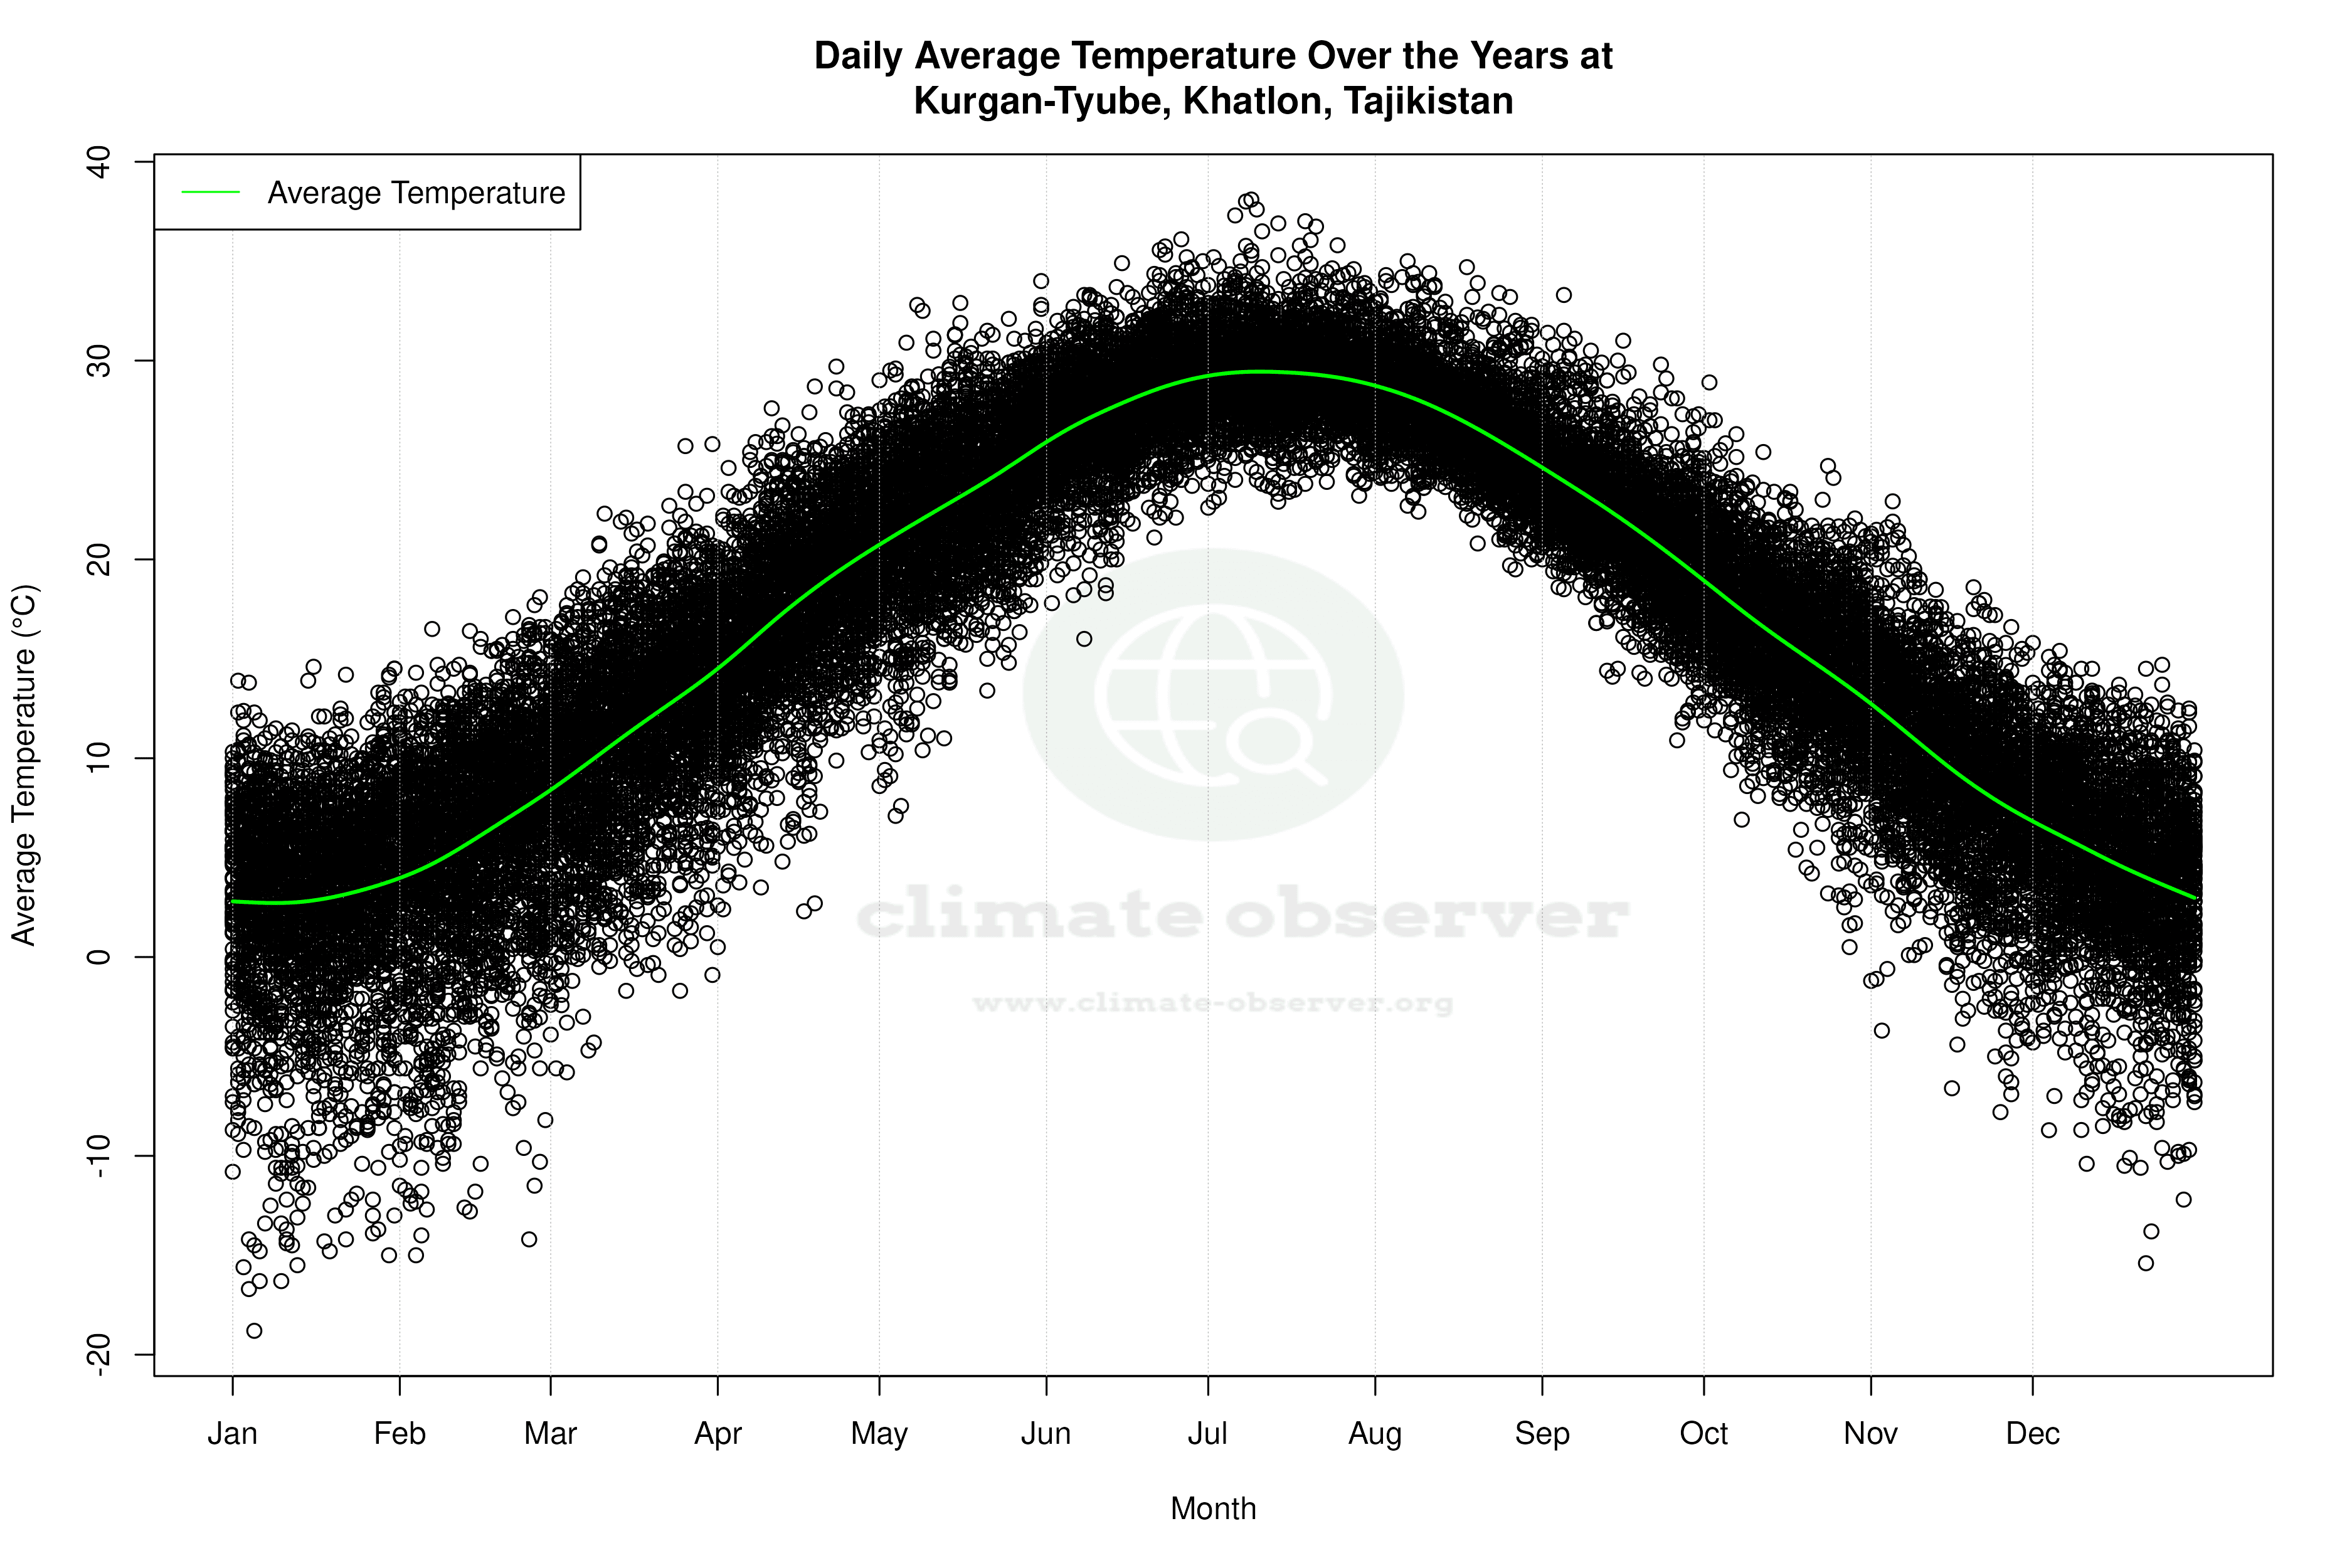


Average Max Temperature Throughout Year | 1 of 5
