Climate for Station: Khorog, Gorno-Badakhshan, Tajikistan
Loading live weather...
Climate Analysis & Overview
Khorog's climate is marked by a distinct warming trend in recent years, particularly in nighttime temperatures, revealing a significant rise of 3.59°C (6.46°F) over the past decade. Meanwhile, the concentration of precipitation events has increased, indicating more intense rainfall periods.
Geographical Context and Climate Classification
Khorog, located at coordinates 37.5° N, 71.5° E, is nestled in the mountainous region of Badakhshan, Afghanistan. The area's climate is classified as a cold semi-arid climate (BSk) according to the Köppen climate classification. The surrounding high-altitude terrain significantly influences local weather patterns, leading to substantial temperature variations between day and night. The Pamir Mountains play a crucial role in shaping the climate, often acting as a barrier to moisture-laden winds, which contributes to the area's relatively low annual precipitation.
Temperature Trends: A Decade of Change
Over the past decade, Khorog has experienced a pronounced increase in temperature, particularly in the lows, with nighttime temperatures rising by 3.59°C (6.46°F). This sharp increase contrasts with a more modest rise in daytime highs of 0.43°C (0.77°F). These trends suggest a shift towards warmer nights, which could have implications for local agriculture and energy consumption. In terms of all-time trends, the highs have seen a slight warming of 0.07°C (0.13°F), while the lows have experienced a marginal cooling of 0.11°C (0.20°F), indicating a complex interplay of factors affecting temperature over a longer period.
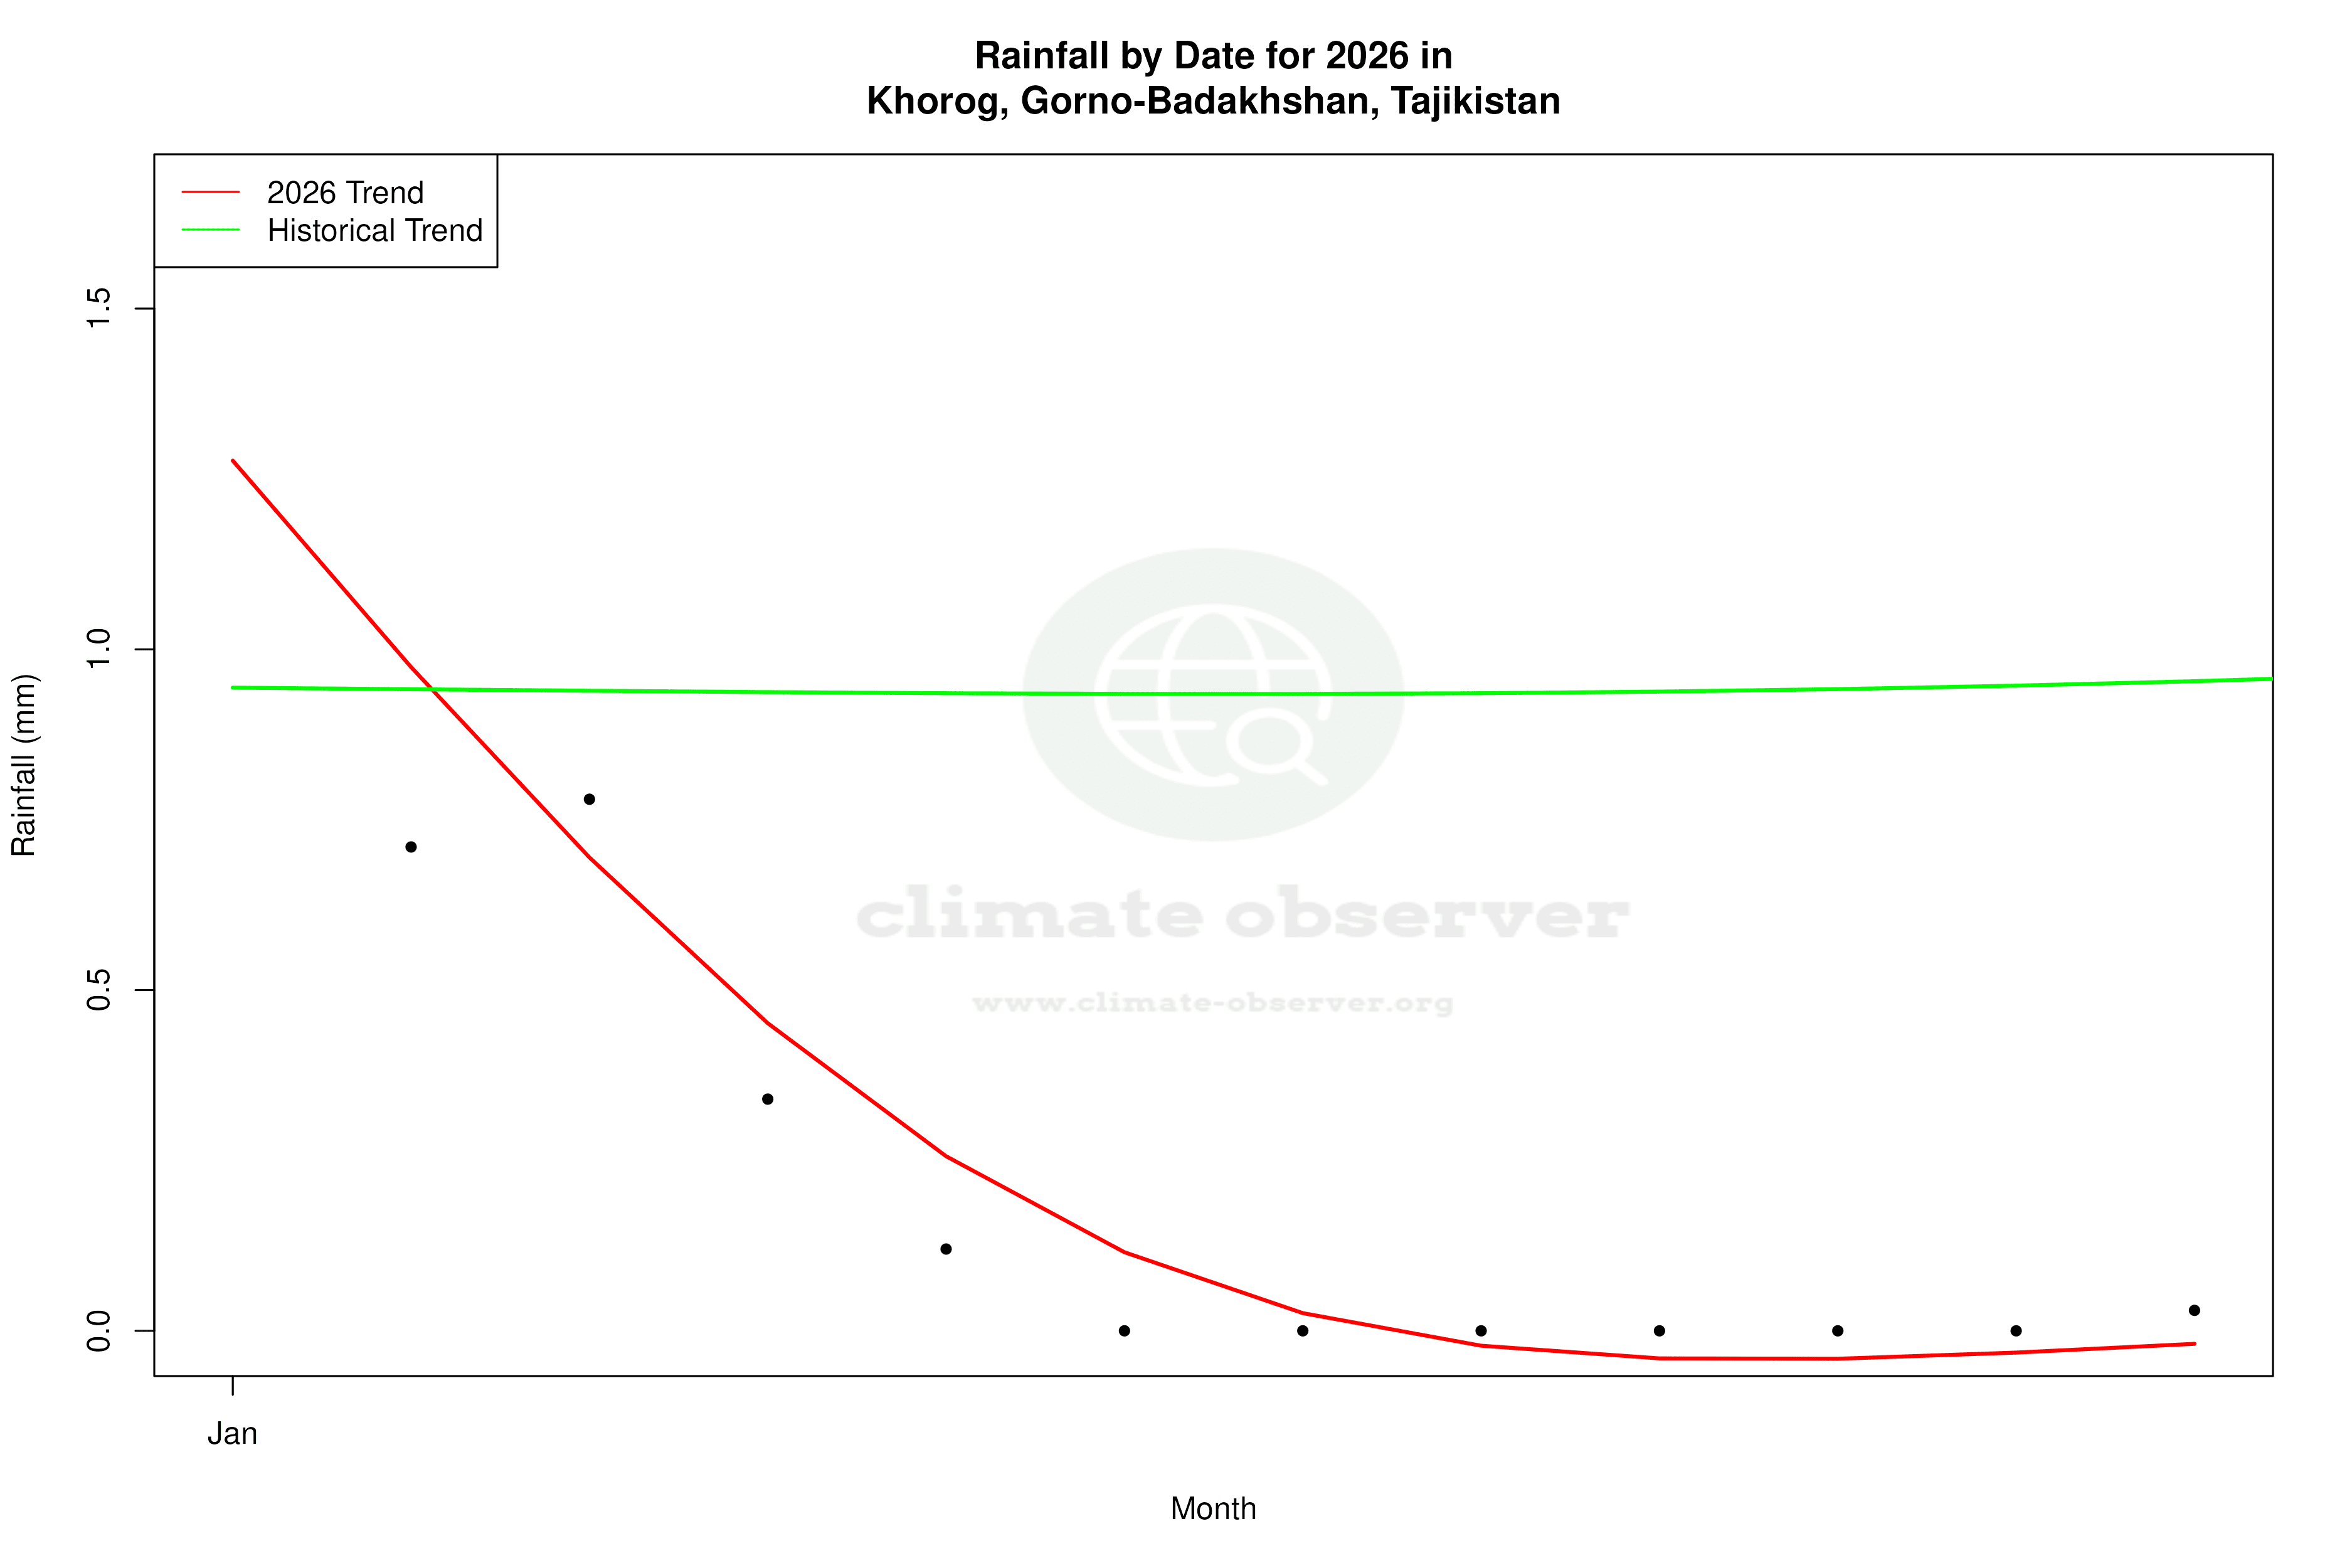
Precipitation Patterns: Intensifying Events
The Precipitation Concentration Index (PCI) for Khorog has shifted from a baseline of 18.99 to a current value of 20.59. This increase signifies a more concentrated pattern of precipitation, where rainfall is occurring in fewer, more intense events. Such a change can lead to challenges in water management and increase the risk of flooding. A PCI above 20 is considered highly concentrated, suggesting that Khorog is experiencing significant changes in its precipitation dynamics.
Record Extremes: Temperature Benchmarks
Khorog's climate extremes are marked by a record high of 39.0°C (102.2°F) and a record low of -30.76°C (-23.37°F). These extremes highlight the region's capacity for significant thermal oscillations, influenced by its high-altitude environment. Such temperature variability is typical for mountainous regions and underscores the challenges faced by residents in adapting to these conditions.
Regional Climate Goals and Implications
Tajikistan, which shares climatic characteristics with Khorog, has been actively pursuing regional climate goals aimed at reducing vulnerability to climate change. The observed trends in Khorog, particularly the warming of nighttime temperatures and the increasing concentration of precipitation events, are critical considerations for policymakers. These changes could impact local agriculture, water resources, and infrastructure resilience, necessitating adaptive strategies to mitigate potential adverse effects.
Station Statistics
10-Year Trend
High: +0.67 °F/decade
Low: +6.39 °F/decade
Rain: +0.085 in/decade
25-Year Trend
High: +1.13 °F/decade
Low: +0.51 °F/decade
Rain: +0.019 in/decade
50-Year Trend
High: +0.16 °F/decade
Low: -0.52 °F/decade
Rain: +0.002 in/decade
All-Time Trend
High: +0.11 °F/decade
Low: -0.20 °F/decade
Rain: +0.000 in/decade
Percentage Above-Average Days
Last 12 Months: 43.6%
This Year: 27.6%
Precipitation Concentration Index (PCI) ℹ️
Last 12 Months: 16.2
Historical Average: 18.1
Percentile Rank of Last 12 Months ℹ️
High: 53rd percentile
Low: 80th percentile
Rain: 97th percentile
Change in Variance ℹ️
High: +0.1%
Low: -3.3%
Intraday: +9.6%
Data Coverage
81.9%
First Year of Data
1898
Station Location
Historical Weather Records
| Max High | Avg High | Min High | Max Avg | Avg Avg | Min Avg | Max Low | Avg Low | Min Low | Max Precipitation | Avg Precipitation | Max Snow | Avg Snow | |
|---|---|---|---|---|---|---|---|---|---|---|---|---|---|
| Record | 102.20 °F | — | -0.42 °F | 86.72 °F | — | -6.97 °F | 76.10 °F | — | -23.37 °F | 4.46 in | — | — | — |
| January | 50.36 °F | 29.10 °F | 2.44 °F | 40.82 °F | 18.71 °F | -5.49 °F | 34.70 °F | 11.10 °F | -23.37 °F | 1.20 in | 0.04 in | — | — |
| February | 55.04 °F | 33.46 °F | 6.98 °F | 43.88 °F | 23.11 °F | -4.56 °F | 38.30 °F | 15.67 °F | -18.85 °F | 2.85 in | 0.05 in | — | — |
| March | 70.88 °F | 44.29 °F | -0.42 °F | 57.20 °F | 34.69 °F | -6.97 °F | 48.56 °F | 28.34 °F | -18.26 °F | 4.46 in | 0.06 in | — | — |
| April | 86.00 °F | 59.64 °F | 22.93 °F | 67.28 °F | 48.68 °F | 15.64 °F | 57.74 °F | 40.32 °F | 6.48 °F | 4.42 in | 0.06 in | — | — |
| May | 95.00 °F | 70.54 °F | 33.57 °F | 77.00 °F | 57.93 °F | 20.77 °F | 64.04 °F | 47.36 °F | 21.52 °F | 2.22 in | 0.03 in | — | — |
| June | 100.76 °F | 79.45 °F | 47.25 °F | 84.02 °F | 65.68 °F | 37.80 °F | 71.24 °F | 53.26 °F | 29.88 °F | 0.79 in | 0.01 in | — | — |
| July | 102.20 °F | 86.00 °F | 55.76 °F | 85.82 °F | 71.87 °F | 42.31 °F | 74.48 °F | 58.68 °F | 28.51 °F | 0.65 in | 0.00 in | — | — |
| August | 100.76 °F | 86.29 °F | 50.49 °F | 86.72 °F | 71.75 °F | 41.86 °F | 76.10 °F | 58.05 °F | 32.99 °F | 0.43 in | 0.00 in | — | — |
| September | 96.80 °F | 79.35 °F | 40.84 °F | 81.32 °F | 64.04 °F | 31.53 °F | 69.80 °F | 49.78 °F | 23.22 °F | 0.47 in | 0.00 in | — | — |
| October | 89.60 °F | 64.91 °F | 33.28 °F | 68.54 °F | 50.49 °F | 20.16 °F | 57.92 °F | 39.29 °F | 13.08 °F | 1.43 in | 0.02 in | — | — |
| November | 69.80 °F | 48.89 °F | 17.17 °F | 56.84 °F | 37.60 °F | 11.71 °F | 46.76 °F | 29.81 °F | -3.62 °F | 1.67 in | 0.03 in | — | — |
| December | 57.20 °F | 35.66 °F | 10.87 °F | 44.42 °F | 25.91 °F | -3.62 °F | 38.66 °F | 19.45 °F | -12.46 °F | 1.44 in | 0.03 in | — | — |
Data Visualisations
Remove WatermarksCurrent Year Climate Trends vs Historical


Max Temperature this Year | 1 of 6
Climate 12-Month Moving Averages


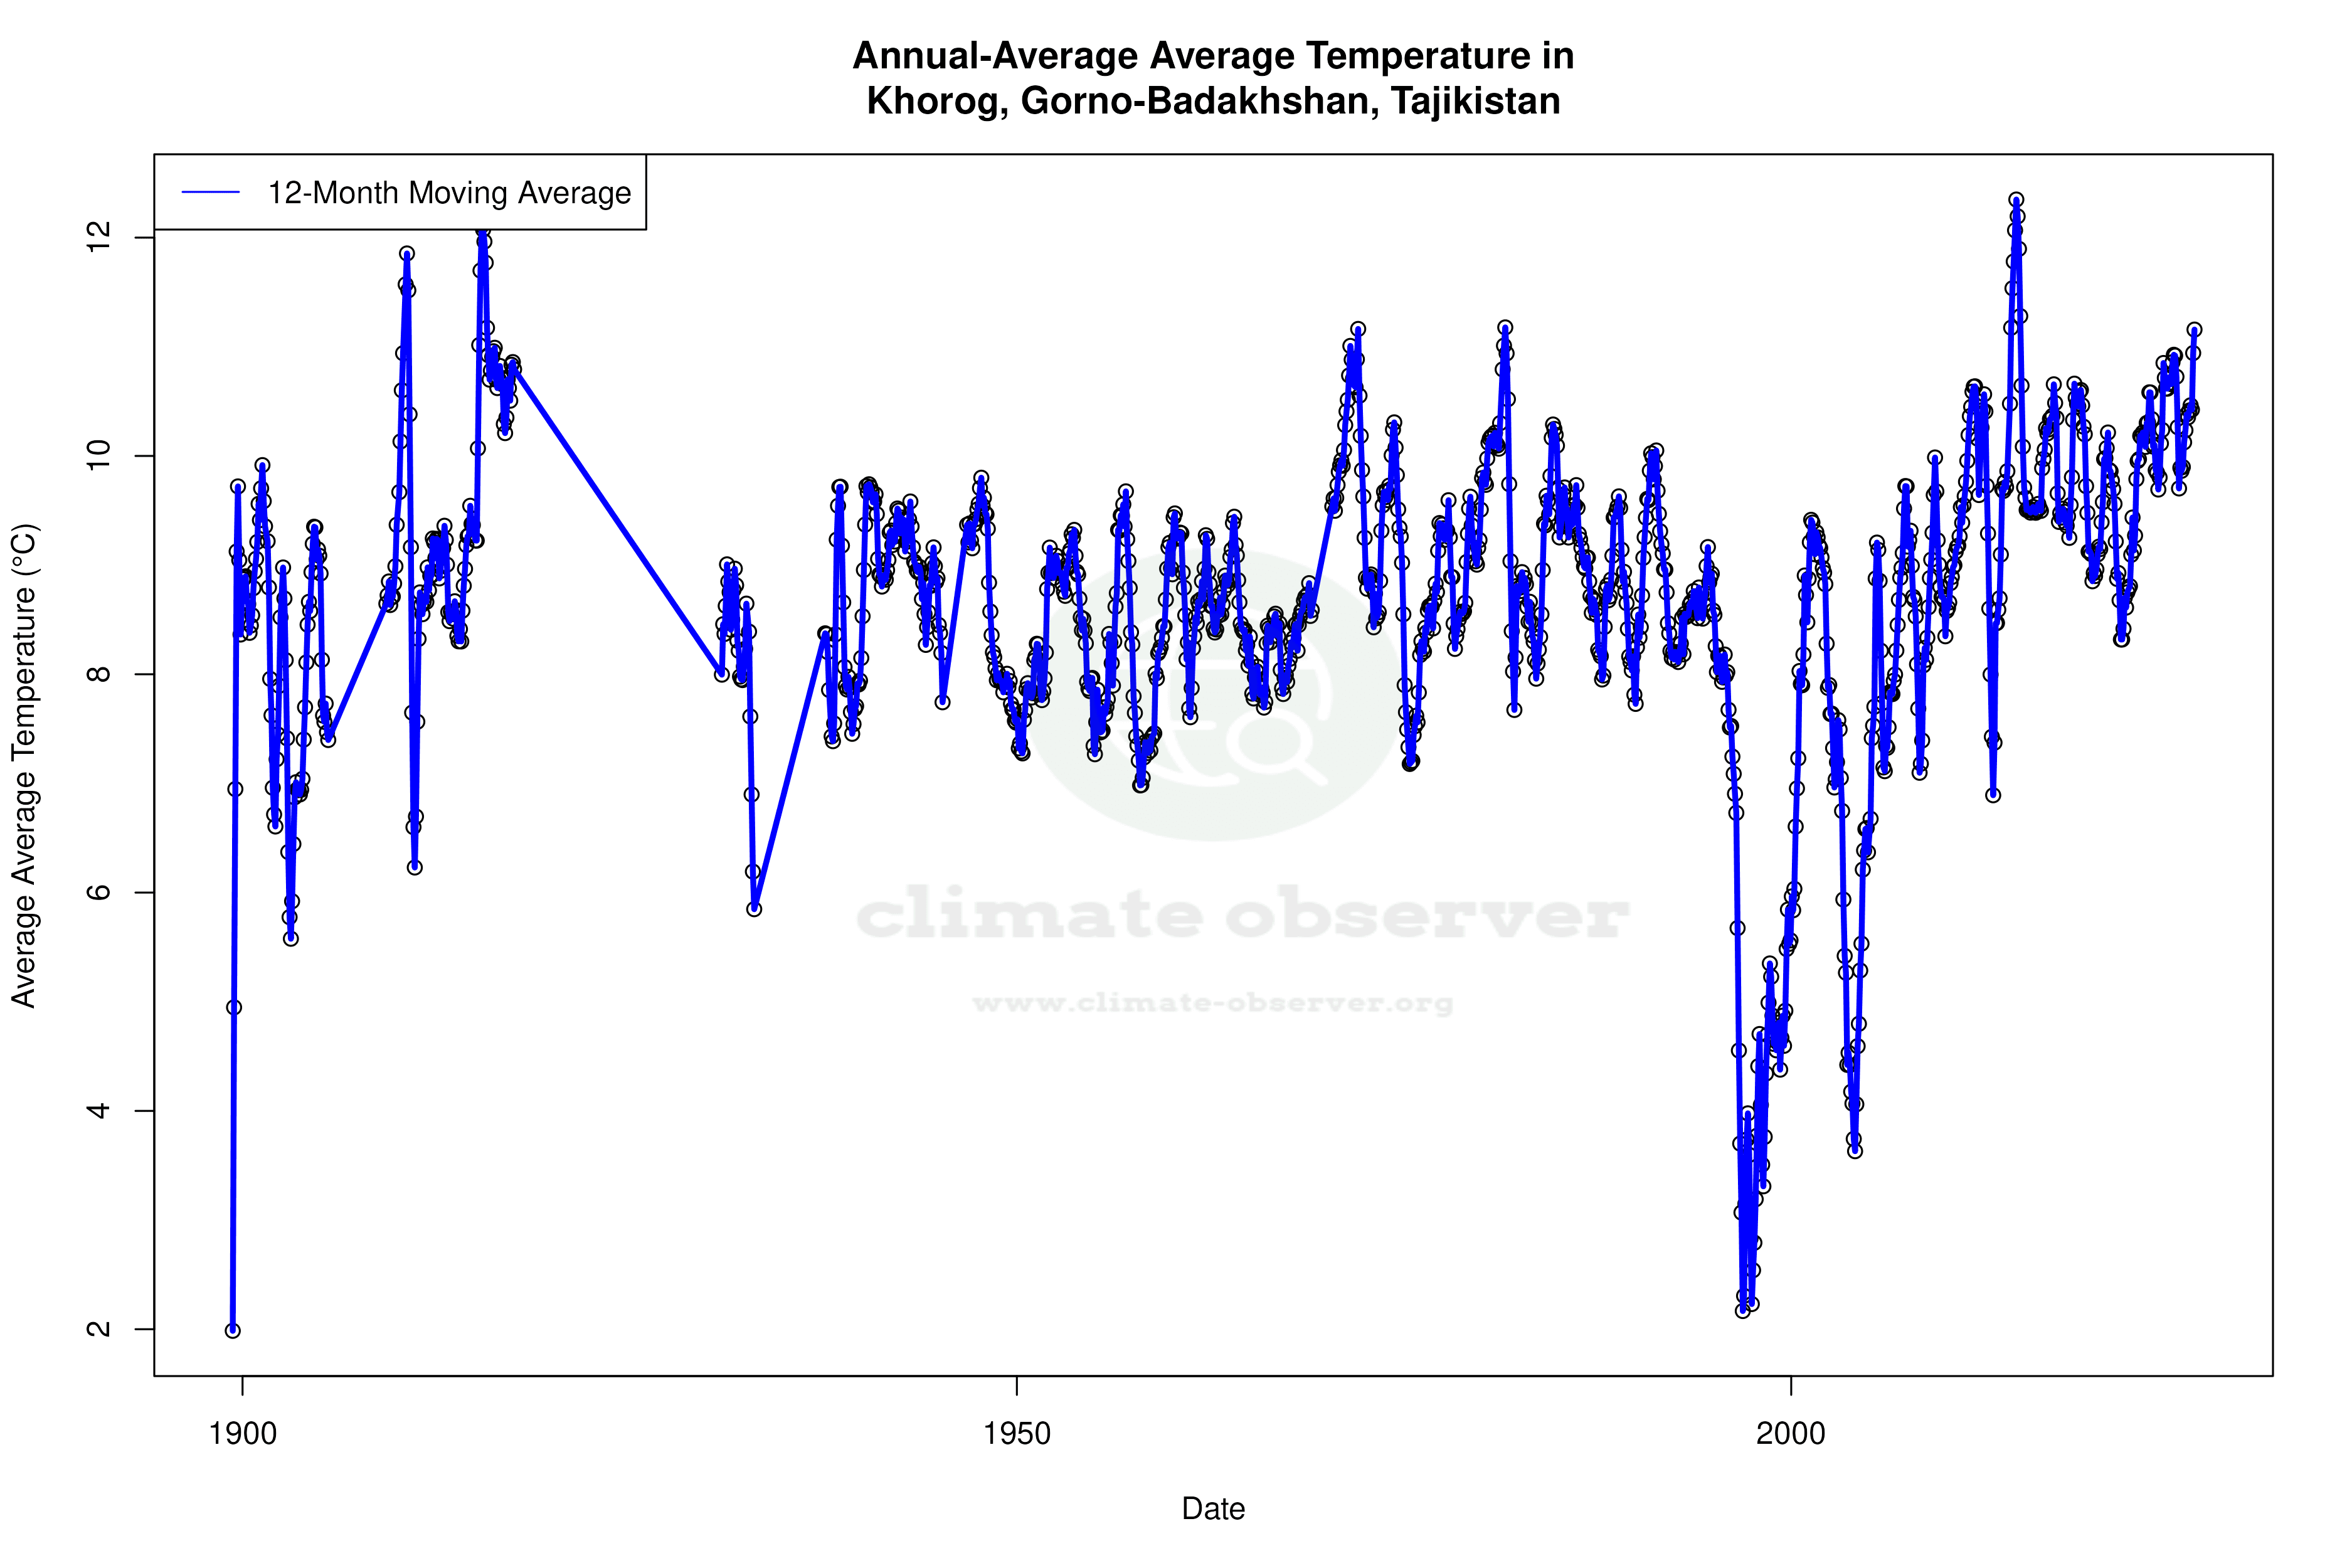


Max Temperature 12-Month MA | 1 of 6
Daily Data Points and Averages Throughout the Year

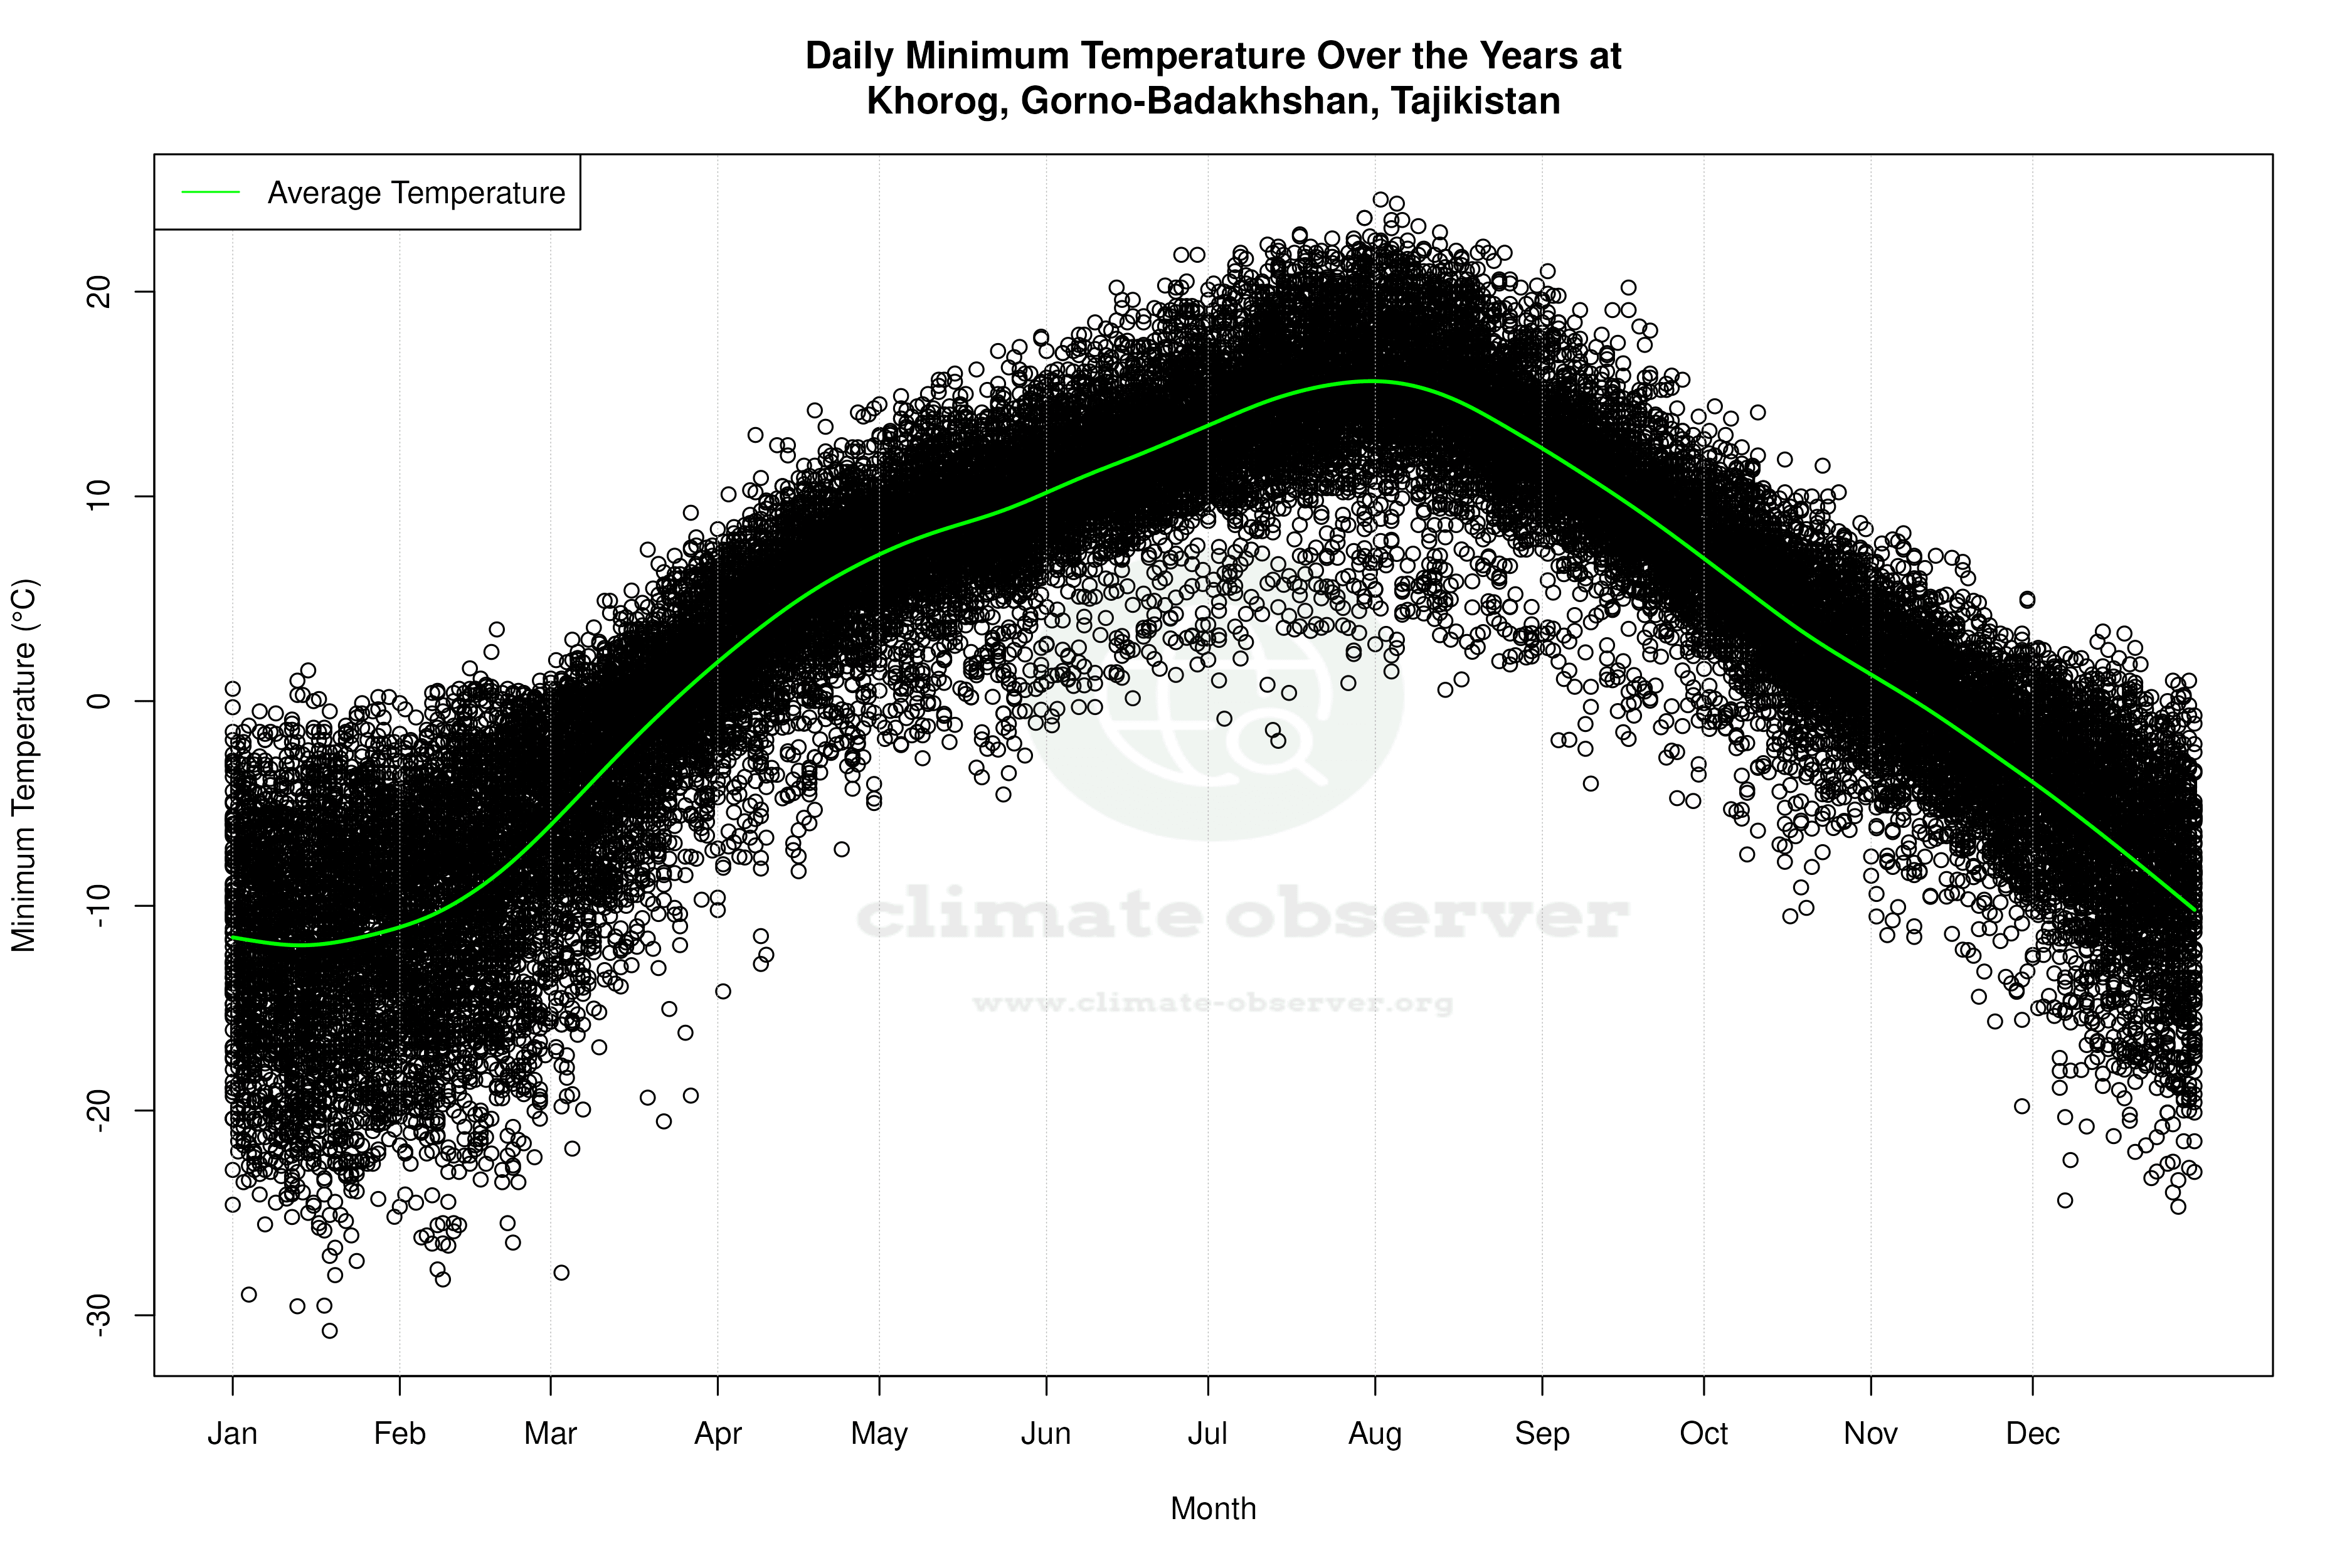


Average Max Temperature Throughout Year | 1 of 5
