Climate for Station: Sokode, Centrale, Togo
Loading live weather...
Climate Analysis & Overview
Sokodé, situated in Togo's Région Centrale, is experiencing a warming trend with more evenly distributed rainfall. The region's climate is transforming, with both highs and lows showing distinct warming patterns over the past decade.
Geographical and Climatic Context
Sokodé, located at 8.98°N, 1.13°E, falls under the tropical savanna climate classification (Aw) according to the Köppen system. This climate is characterised by a distinct wet and dry season, influenced by the Intertropical Convergence Zone (ITCZ) and the region's topography. The nearby Tchaoudjo hills can moderate temperatures slightly, but the overall climate remains warm and humid, typical of central Togo.
Temperature Trends: A Warming Landscape
The all-time temperature trends for Sokodé reveal a warming pattern. Highs have increased by 0.19°C (0.34°F), while lows have risen by 0.25°C (0.45°F). This warming is more pronounced in the lows, indicating warmer nights. Over the past decade, highs have increased by 0.23°C (0.42°F) and lows by 0.14°C (0.25°F). This recent data suggests a consistent warming trend, aligning with global climate patterns. The record temperatures further highlight this, with an absolute maximum of 41.0°C (105.8°F) and a minimum of 10.0°C (50.0°F), illustrating the extremes that can occur in this region.
Precipitation Patterns: A Shift Towards Even Distribution
The Precipitation Concentration Index (PCI) for Sokodé has decreased from a baseline of 16.1 to the current value of 14.1. This indicates that rainfall is becoming more evenly distributed throughout the year, which could be beneficial for agriculture and water resource management. A lower PCI suggests fewer intense rainfall events, reducing the risk of flooding and soil erosion, which are significant concerns in Togo.
Regional Climate Goals and Implications
Togo has been actively working towards climate resilience, aiming to mitigate the impacts of climate change on agriculture and water resources. Sokodé's trends of warming temperatures and more evenly distributed precipitation align with these goals, potentially aiding in the adaptation strategies. The regional focus on sustainable agriculture and improved water management could benefit from these climatic shifts, provided that the changes are monitored and managed effectively.
Impacts and Future Considerations
The warming trends and altered precipitation patterns in Sokodé have significant implications for local agriculture, water resources, and overall climate resilience. As Togo continues to develop its climate strategies, understanding these localised changes is crucial. The data from Sokodé serves as a vital piece in the broader puzzle of regional climate adaptation and mitigation efforts.
Station Statistics
10-Year Trend
High: +1.18 °F/decade
Low: +0.48 °F/decade
Rain: -0.019 in/decade
25-Year Trend
High: +0.89 °F/decade
Low: +0.66 °F/decade
Rain: +0.001 in/decade
50-Year Trend
High: +0.57 °F/decade
Low: +0.50 °F/decade
Rain: +0.002 in/decade
All-Time Trend
High: +0.34 °F/decade
Low: +0.44 °F/decade
Rain: -0.003 in/decade
Percentage Above-Average Days
Last 12 Months: 61.9%
This Year: 79.2%
Precipitation Concentration Index (PCI) ℹ️
Last 12 Months: 15.4
Historical Average: 15.2
Percentile Rank of Last 12 Months ℹ️
High: 82nd percentile
Low: 88th percentile
Rain: 42nd percentile
Change in Variance ℹ️
High: +0.7%
Low: -22.9%
Intraday: -10.9%
Data Coverage
87.1%
First Year of Data
1945
Station Location
Historical Weather Records
| Max High | Avg High | Min High | Max Avg | Avg Avg | Min Avg | Max Low | Avg Low | Min Low | Max Precipitation | Avg Precipitation | Max Snow | Avg Snow | |
|---|---|---|---|---|---|---|---|---|---|---|---|---|---|
| Record | 105.80 °F | — | 71.42 °F | 95.72 °F | — | 64.76 °F | 81.50 °F | — | 50.00 °F | 8.27 in | — | — | — |
| January | 104.90 °F | 93.72 °F | 78.80 °F | 93.56 °F | 80.09 °F | 66.09 °F | 78.80 °F | 65.05 °F | 50.00 °F | 3.09 in | 0.01 in | — | — |
| February | 105.80 °F | 96.50 °F | 81.66 °F | 93.92 °F | 83.56 °F | 71.60 °F | 81.50 °F | 69.13 °F | 51.80 °F | 3.41 in | 0.02 in | — | — |
| March | 105.06 °F | 96.45 °F | 78.98 °F | 95.18 °F | 84.61 °F | 73.40 °F | 81.21 °F | 72.49 °F | 60.44 °F | 4.41 in | 0.07 in | — | — |
| April | 104.90 °F | 93.73 °F | 75.38 °F | 95.72 °F | 83.00 °F | 72.14 °F | 79.70 °F | 72.94 °F | 64.40 °F | 4.09 in | 0.14 in | — | — |
| May | 102.70 °F | 90.73 °F | 75.20 °F | 88.34 °F | 81.10 °F | 72.14 °F | 78.80 °F | 72.06 °F | 64.40 °F | 4.04 in | 0.18 in | — | — |
| June | 98.60 °F | 87.17 °F | 74.48 °F | 91.04 °F | 78.59 °F | 70.70 °F | 77.00 °F | 70.64 °F | 60.80 °F | 4.20 in | 0.24 in | — | — |
| July | 94.10 °F | 84.13 °F | 73.22 °F | 84.74 °F | 76.51 °F | 69.62 °F | 75.20 °F | 70.05 °F | 60.80 °F | 8.27 in | 0.31 in | — | — |
| August | 100.40 °F | 83.35 °F | 72.68 °F | 83.30 °F | 75.92 °F | 70.16 °F | 74.84 °F | 69.82 °F | 62.24 °F | 5.63 in | 0.31 in | — | — |
| September | 95.00 °F | 85.03 °F | 71.42 °F | 82.76 °F | 76.42 °F | 66.56 °F | 75.20 °F | 69.60 °F | 59.90 °F | 4.35 in | 0.33 in | — | — |
| October | 103.28 °F | 88.64 °F | 75.56 °F | 86.00 °F | 78.11 °F | 69.44 °F | 75.20 °F | 69.25 °F | 60.80 °F | 3.98 in | 0.16 in | — | — |
| November | 103.82 °F | 92.48 °F | 80.42 °F | 90.32 °F | 79.16 °F | 68.36 °F | 75.74 °F | 66.28 °F | 51.80 °F | 1.78 in | 0.02 in | — | — |
| December | 102.20 °F | 92.68 °F | 81.14 °F | 87.80 °F | 78.53 °F | 64.76 °F | 77.00 °F | 64.09 °F | 50.00 °F | 4.01 in | 0.01 in | — | — |
Data Visualisations
Remove WatermarksCurrent Year Climate Trends vs Historical


Max Temperature this Year | 1 of 6
Climate 12-Month Moving Averages


Max Temperature 12-Month MA | 1 of 6
Daily Data Points and Averages Throughout the Year

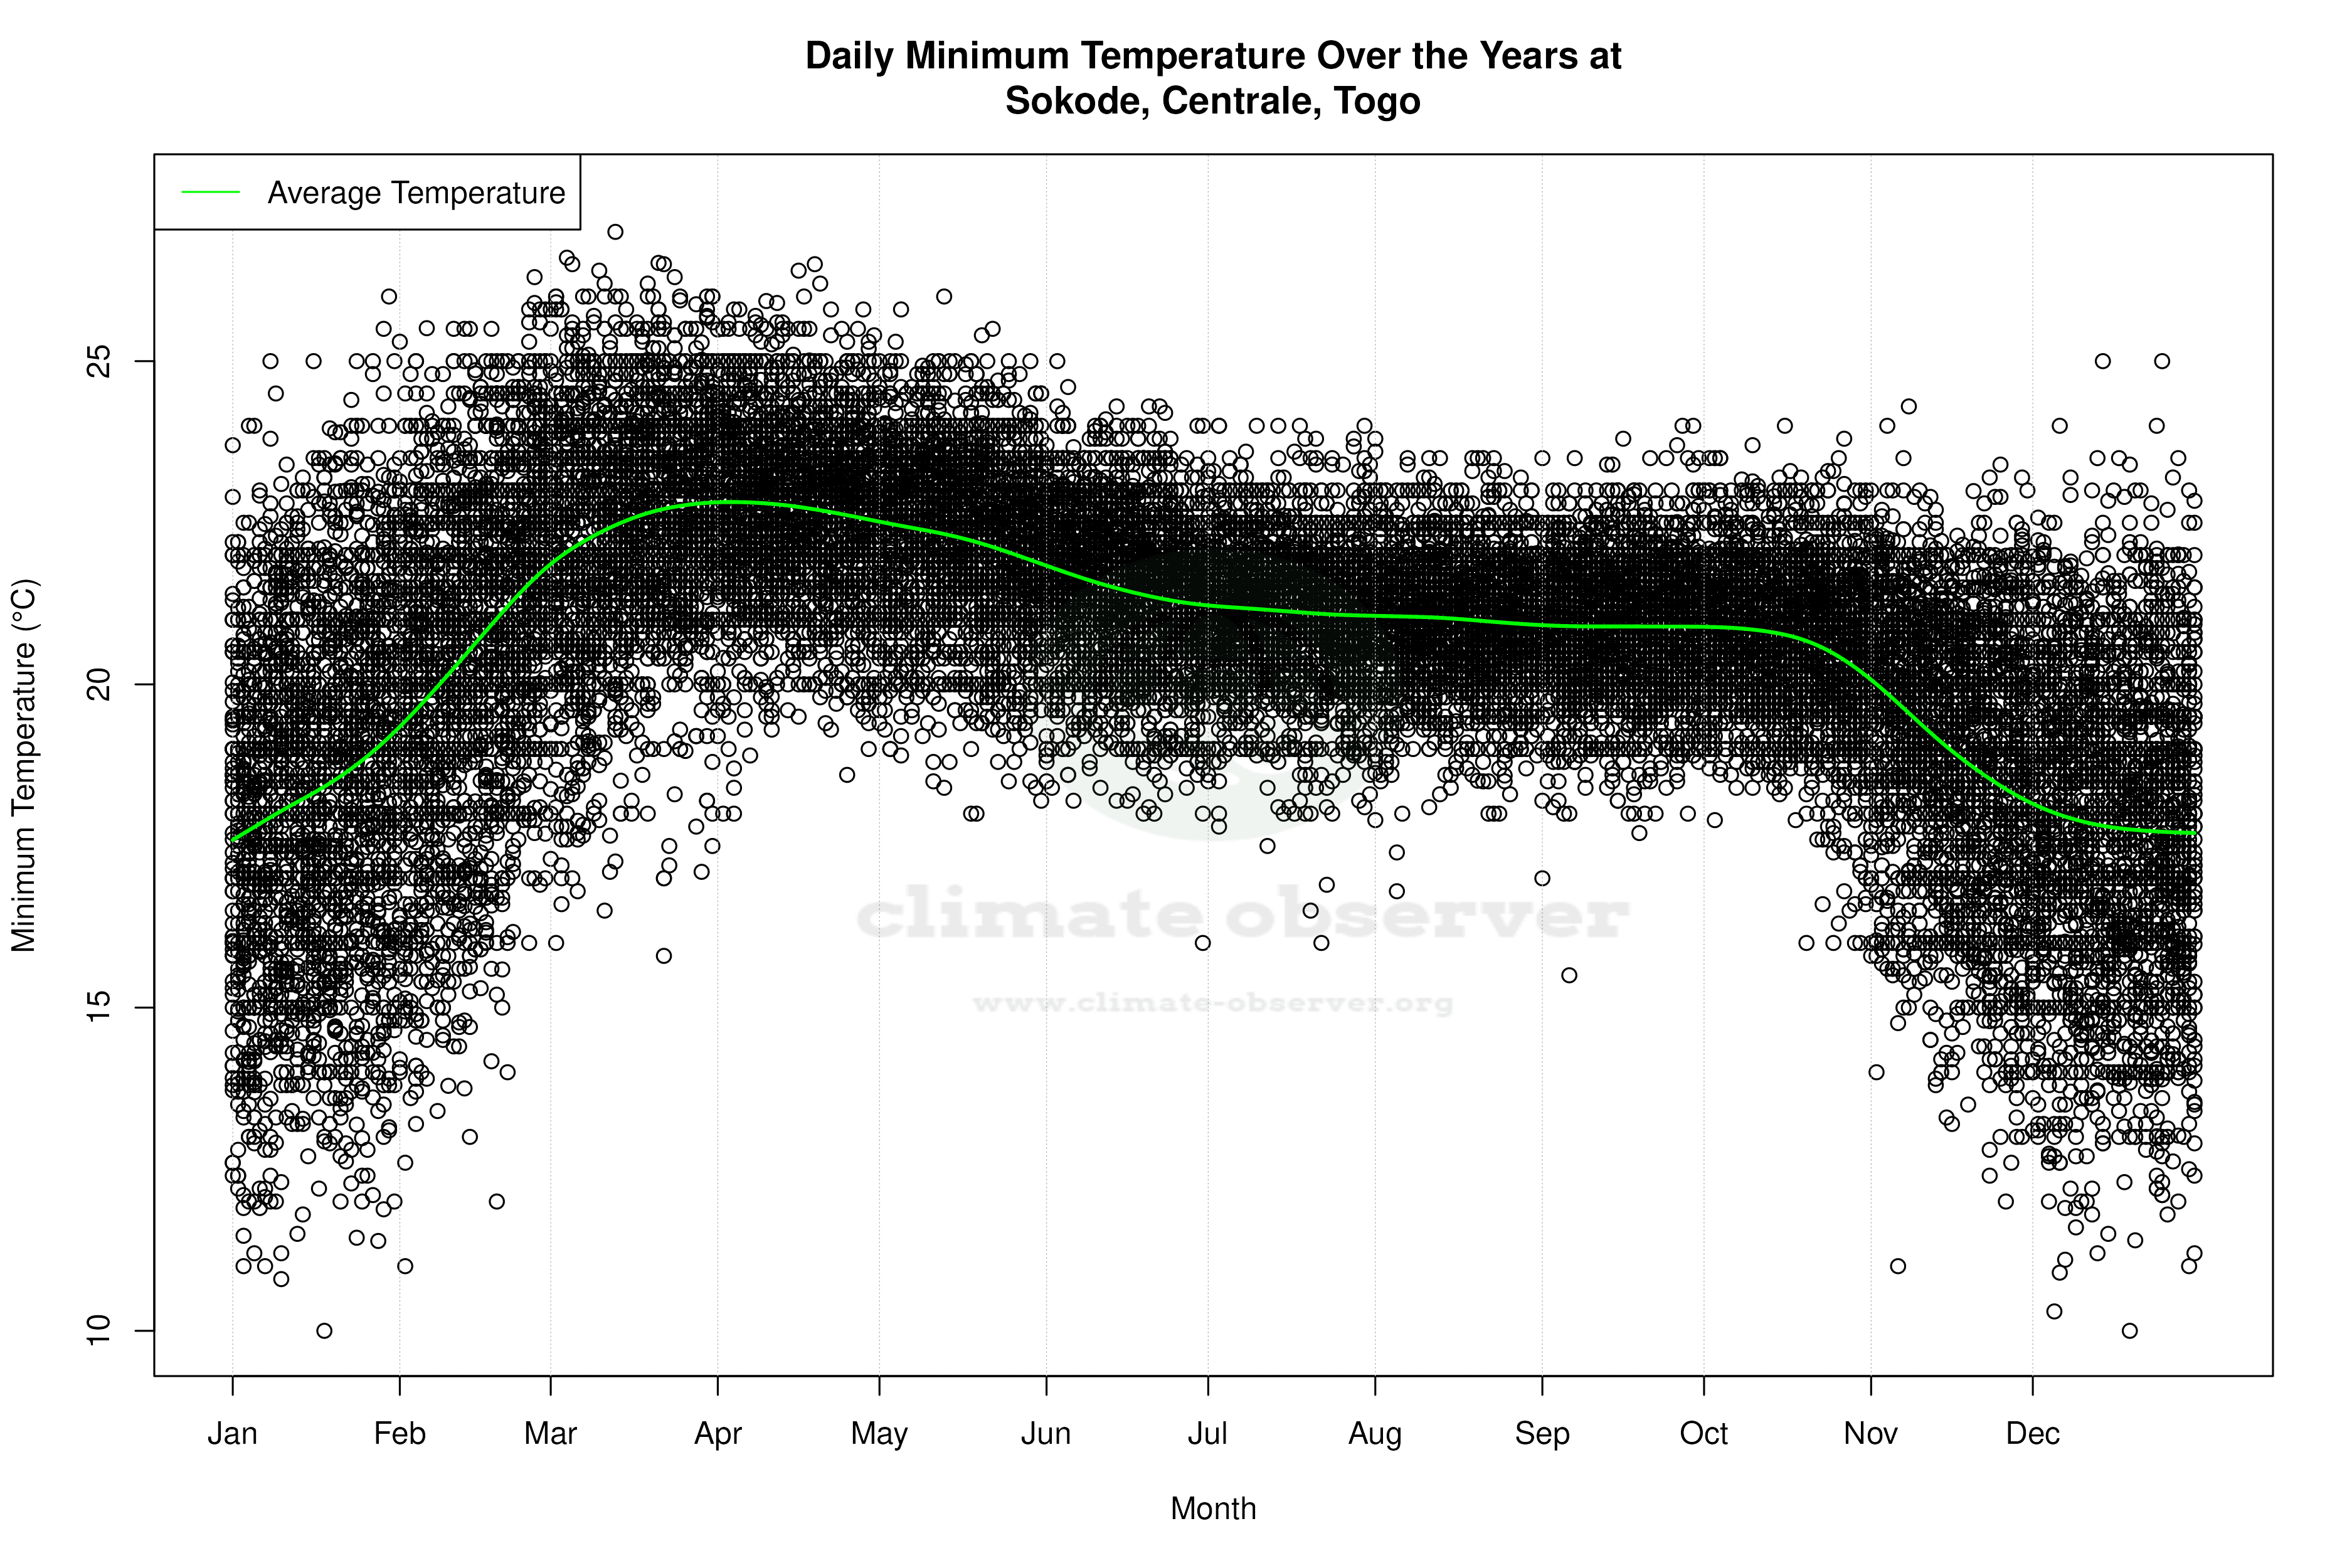


Average Max Temperature Throughout Year | 1 of 5
