Climate for Station: Afyon, Afyonkarahisar, Turkey
Loading live weather...
Climate Analysis & Overview
Afyonkarahisar, nestled in Turkey's Ege Bölgesi, is experiencing a warming trend with a notable increase in both high and low temperatures over the past decade. The region's precipitation is becoming more evenly distributed, suggesting a shift in rainfall patterns. These changes align with Turkey's broader climate goals to manage regional climate variability.
Warming Trends in Afyonkarahisar
Afyonkarahisar, located in the Ege Bölgesi of Turkey, is classified under the Köppen climate classification as a Csb climate, characterised by warm, dry summers and mild, wet winters. Over the past decade, the region has experienced a significant warming trend, with high temperatures increasing by 1.29°C (2.32°F) and low temperatures by 1.18°C (2.12°F). This is more pronounced than the all-time warming trend, where highs have risen by 0.37°C (0.67°F) and lows by 0.34°C (0.61°F). This suggests a recent acceleration in warming, possibly influenced by local geographic features such as the surrounding mountains, which can trap heat and affect local weather patterns.
Extreme Temperature Records
The temperature extremes in Afyonkarahisar highlight the variability of its climate. The highest recorded temperature stands at 39.3°C (102.7°F), while the lowest plummets to -28.8°C (-19.8°F). These records underscore the region's capacity for both intense heat and severe cold, reflecting its continental climate influences. Such extremes are crucial for understanding the potential impacts of climate change on local agriculture and water resources.
Precipitation Patterns and Distribution
The Precipitation Concentration Index (PCI) provides insights into how rainfall is distributed throughout the year. Afyonkarahisar's PCI has decreased from a baseline of 13.38 to a current value of 11.86, indicating a more even distribution of precipitation events. This marginal change suggests that while rainfall is becoming more evenly spread, it remains concentrated enough to potentially influence agricultural planning and water resource management. A PCI under 10 would indicate very even distribution, but Afyonkarahisar's current PCI suggests moderate concentration.
Regional Climate Context
The warming trends observed in Afyonkarahisar are consistent with broader climate patterns across Turkey, where efforts are being made to adapt to and mitigate climate change impacts. The Turkish government has been focusing on sustainable water management and reducing greenhouse gas emissions, aligning with these observed climatic shifts. Recent weather events, such as unseasonably warm winters or unexpected summer rainfalls, highlight the ongoing challenges and adaptations required for the region's climate resilience.
Implications of Climate Trends
The observed warming trends and changes in precipitation distribution have significant implications for Afyonkarahisar's agriculture, water resources, and overall climate resilience. As temperatures continue to rise, the region may face challenges related to heat stress on crops and water scarcity. The more evenly distributed precipitation could offer some relief, potentially reducing the risk of droughts and supporting more sustainable agricultural practices. However, the balance between these factors will be critical in shaping the region's future climate strategy.
Station Statistics
10-Year Trend
High: +1.03 °C/decade
Low: +1.06 °C/decade
Rain: +0.11 mm/decade
25-Year Trend
High: +0.38 °C/decade
Low: +1.04 °C/decade
Rain: +0.09 mm/decade
50-Year Trend
High: +0.49 °C/decade
Low: +0.44 °C/decade
Rain: +0.01 mm/decade
All-Time Trend
High: +0.38 °C/decade
Low: +0.38 °C/decade
Rain: +0.01 mm/decade
Percentage Above-Average Days
Last 12 Months: 57.8%
This Year: 71.1%
Precipitation Concentration Index (PCI) ℹ️
Last 12 Months: 11.5
Historical Average: 14.1
Percentile Rank of Last 12 Months ℹ️
High: 77th percentile
Low: 84th percentile
Rain: 35th percentile
Change in Variance ℹ️
High: -4.0%
Low: +0.3%
Intraday: -26.6%
Data Coverage
89.6%
First Year of Data
1979
Station Location
Historical Weather Records
| Max High | Avg High | Min High | Max Avg | Avg Avg | Min Avg | Max Low | Avg Low | Min Low | Max Precipitation | Avg Precipitation | Max Snow | Avg Snow | |
|---|---|---|---|---|---|---|---|---|---|---|---|---|---|
| Record | 39.3 °C | — | -13.0 °C | 32.6 °C | — | -20.8 °C | 24.8 °C | — | -28.8 °C | 74.9 mm | — | — | — |
| January | 21.0 °C | 4.7 °C | -13.0 °C | 14.3 °C | 0.2 °C | -20.8 °C | 11.9 °C | -3.9 °C | -28.8 °C | 40.9 mm | 1.6 mm | — | — |
| February | 24.1 °C | 7.0 °C | -9.4 °C | 14.9 °C | 2.0 °C | -16.1 °C | 10.9 °C | -2.8 °C | -24.0 °C | 53.1 mm | 1.4 mm | — | — |
| March | 26.7 °C | 11.4 °C | -5.2 °C | 20.4 °C | 5.6 °C | -10.1 °C | 14.4 °C | -0.1 °C | -17.0 °C | 44.2 mm | 1.5 mm | — | — |
| April | 30.2 °C | 16.7 °C | -0.6 °C | 22.7 °C | 10.4 °C | -3.2 °C | 18.5 °C | 4.1 °C | -10.9 °C | 72.9 mm | 1.6 mm | — | — |
| May | 33.4 °C | 21.4 °C | 3.5 °C | 24.7 °C | 14.8 °C | 1.1 °C | 17.2 °C | 7.9 °C | -3.0 °C | 74.9 mm | 1.8 mm | — | — |
| June | 37.3 °C | 25.9 °C | 13.6 °C | 31.0 °C | 19.0 °C | 7.3 °C | 20.7 °C | 11.3 °C | 1.0 °C | 37.1 mm | 1.2 mm | — | — |
| July | 39.2 °C | 29.7 °C | 17.0 °C | 32.6 °C | 22.3 °C | 12.2 °C | 21.8 °C | 14.1 °C | 5.0 °C | 25.4 mm | 0.5 mm | — | — |
| August | 39.3 °C | 29.8 °C | 17.6 °C | 31.2 °C | 22.1 °C | 13.4 °C | 24.8 °C | 14.1 °C | 5.3 °C | 21.8 mm | 0.4 mm | — | — |
| September | 37.2 °C | 25.5 °C | 9.0 °C | 30.8 °C | 18.0 °C | 7.3 °C | 18.7 °C | 10.1 °C | -2.6 °C | 25.9 mm | 0.4 mm | — | — |
| October | 31.3 °C | 19.5 °C | 4.5 °C | 23.5 °C | 12.4 °C | 0.4 °C | 17.4 °C | 5.8 °C | -6.1 °C | 33.0 mm | 1.1 mm | — | — |
| November | 26.6 °C | 13.0 °C | -2.9 °C | 18.0 °C | 6.7 °C | -9.4 °C | 13.5 °C | 1.2 °C | -13.0 °C | 30.0 mm | 1.1 mm | — | — |
| December | 22.7 °C | 6.8 °C | -9.6 °C | 14.7 °C | 2.3 °C | -14.8 °C | 10.0 °C | -1.6 °C | -21.2 °C | 41.4 mm | 1.6 mm | — | — |
Data Visualisations
Remove WatermarksCurrent Year Climate Trends vs Historical

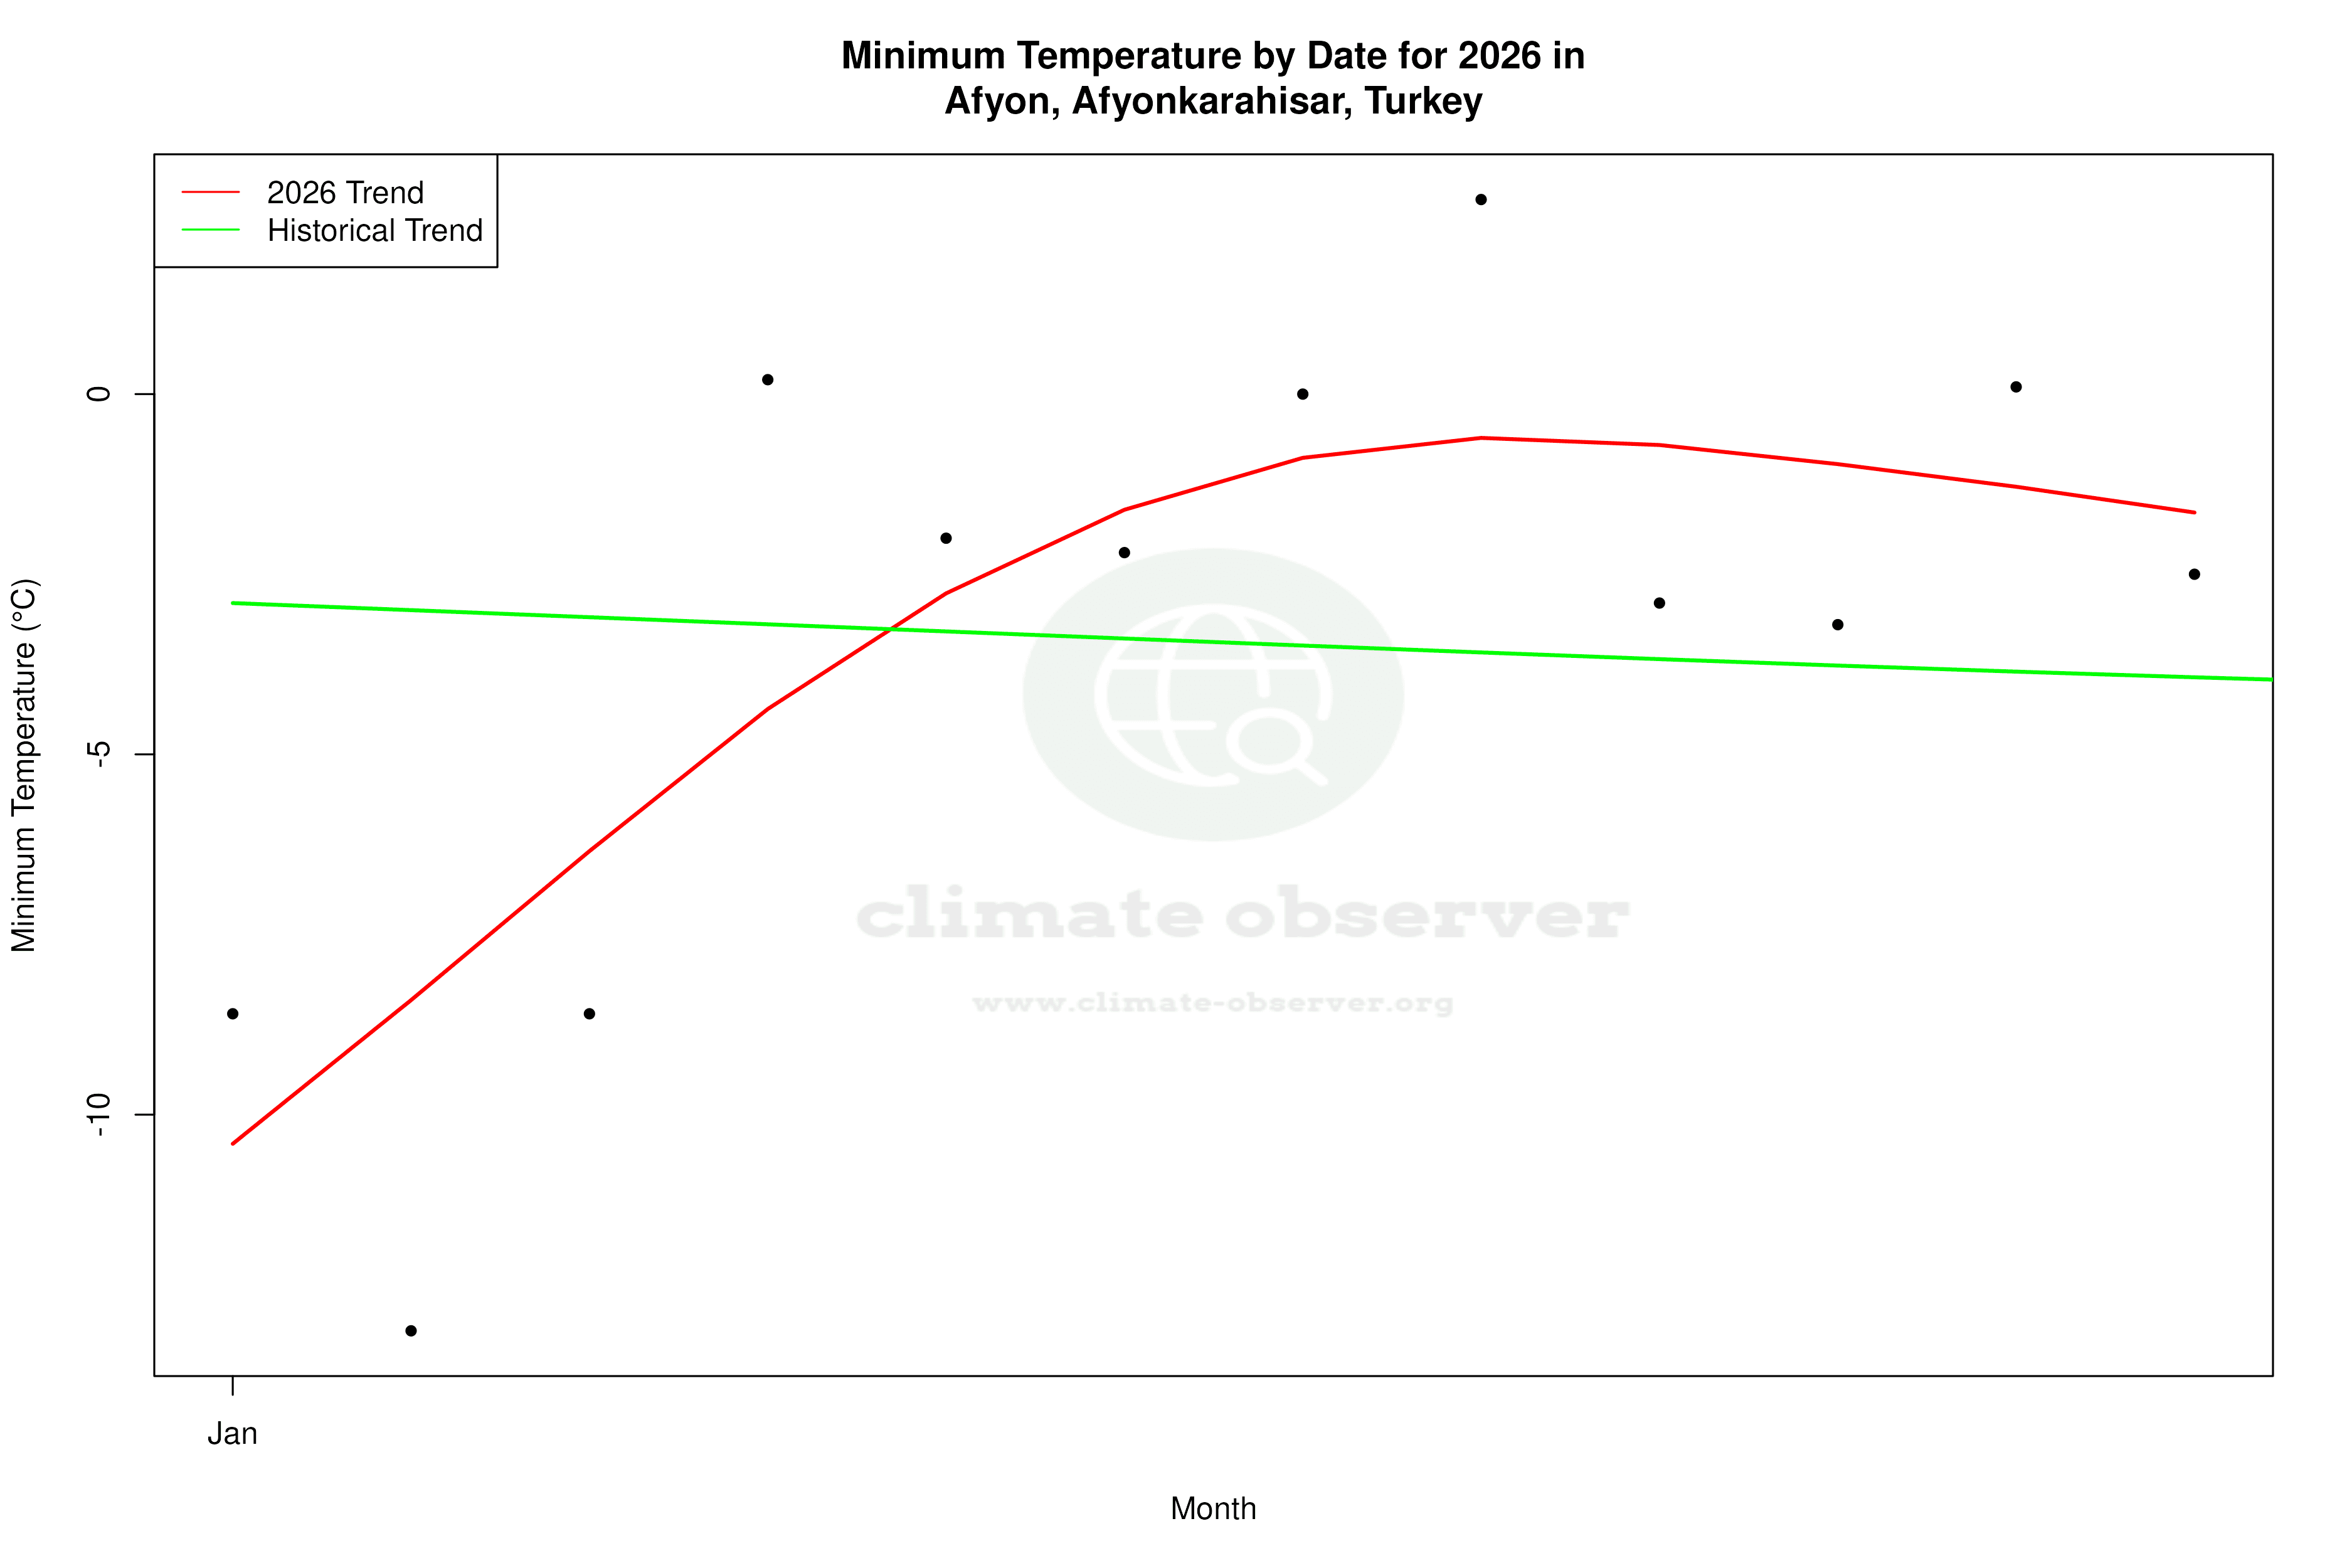


Max Temperature this Year | 1 of 6
Climate 12-Month Moving Averages


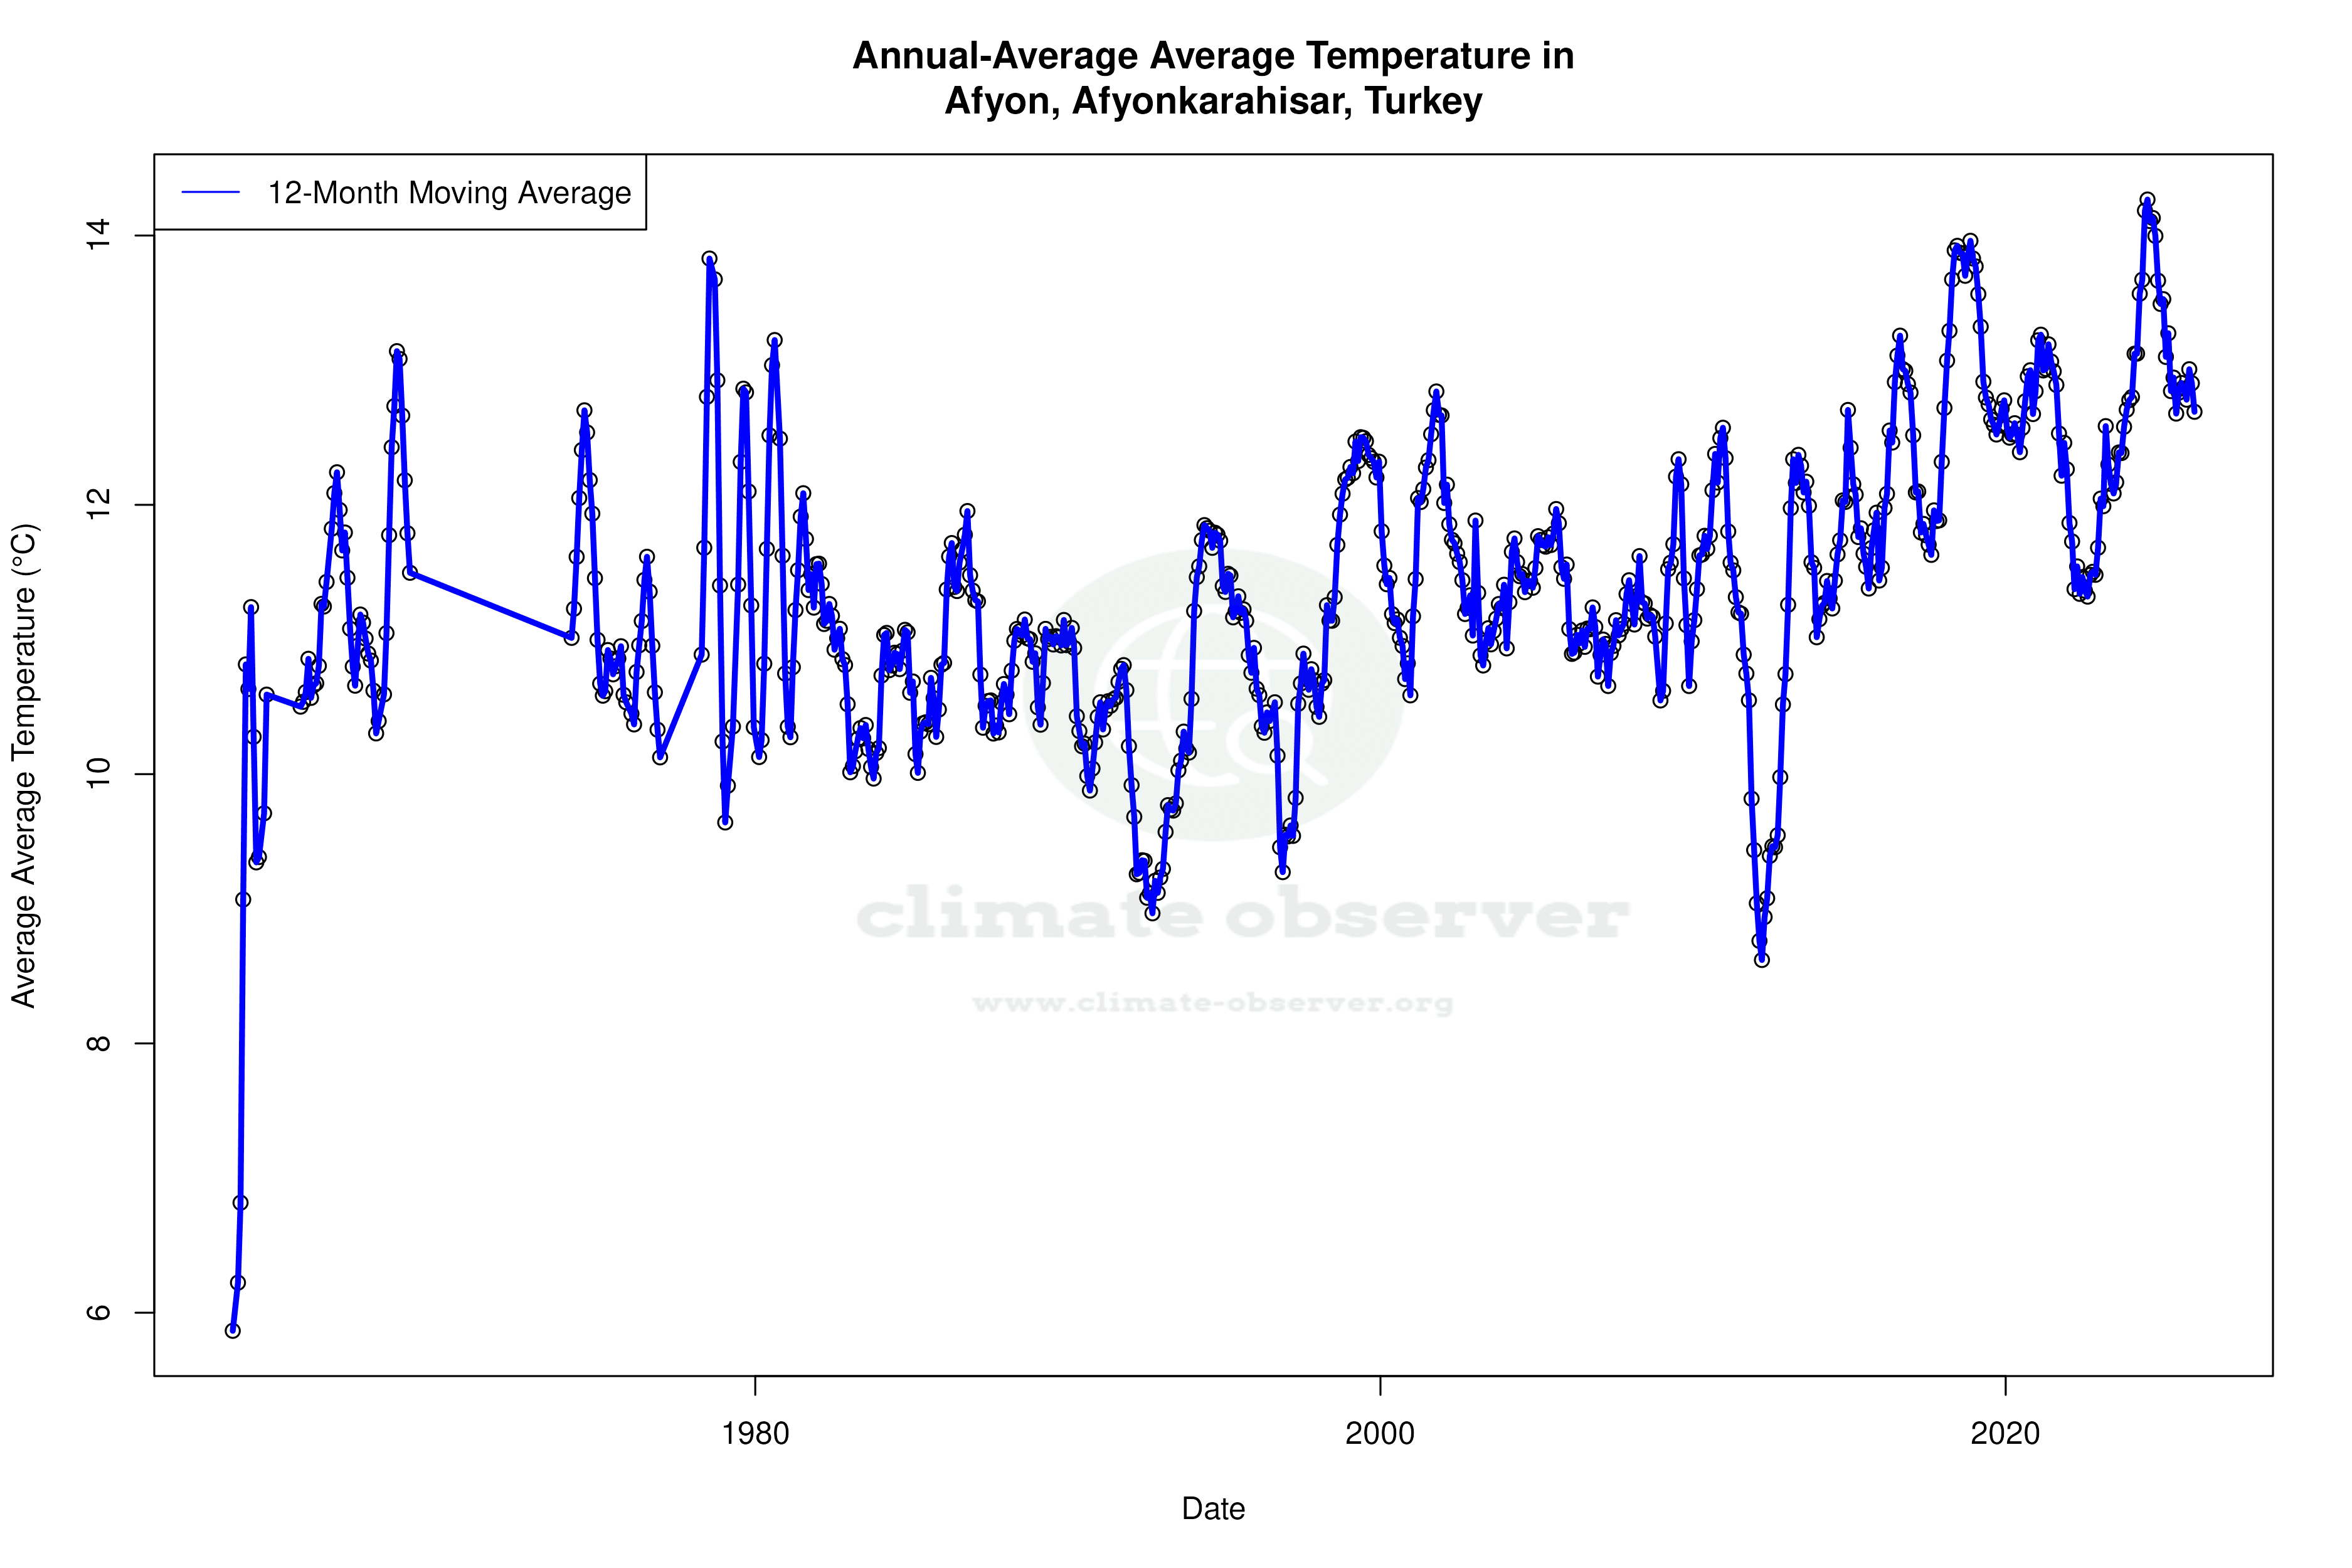


Max Temperature 12-Month MA | 1 of 6
Daily Data Points and Averages Throughout the Year


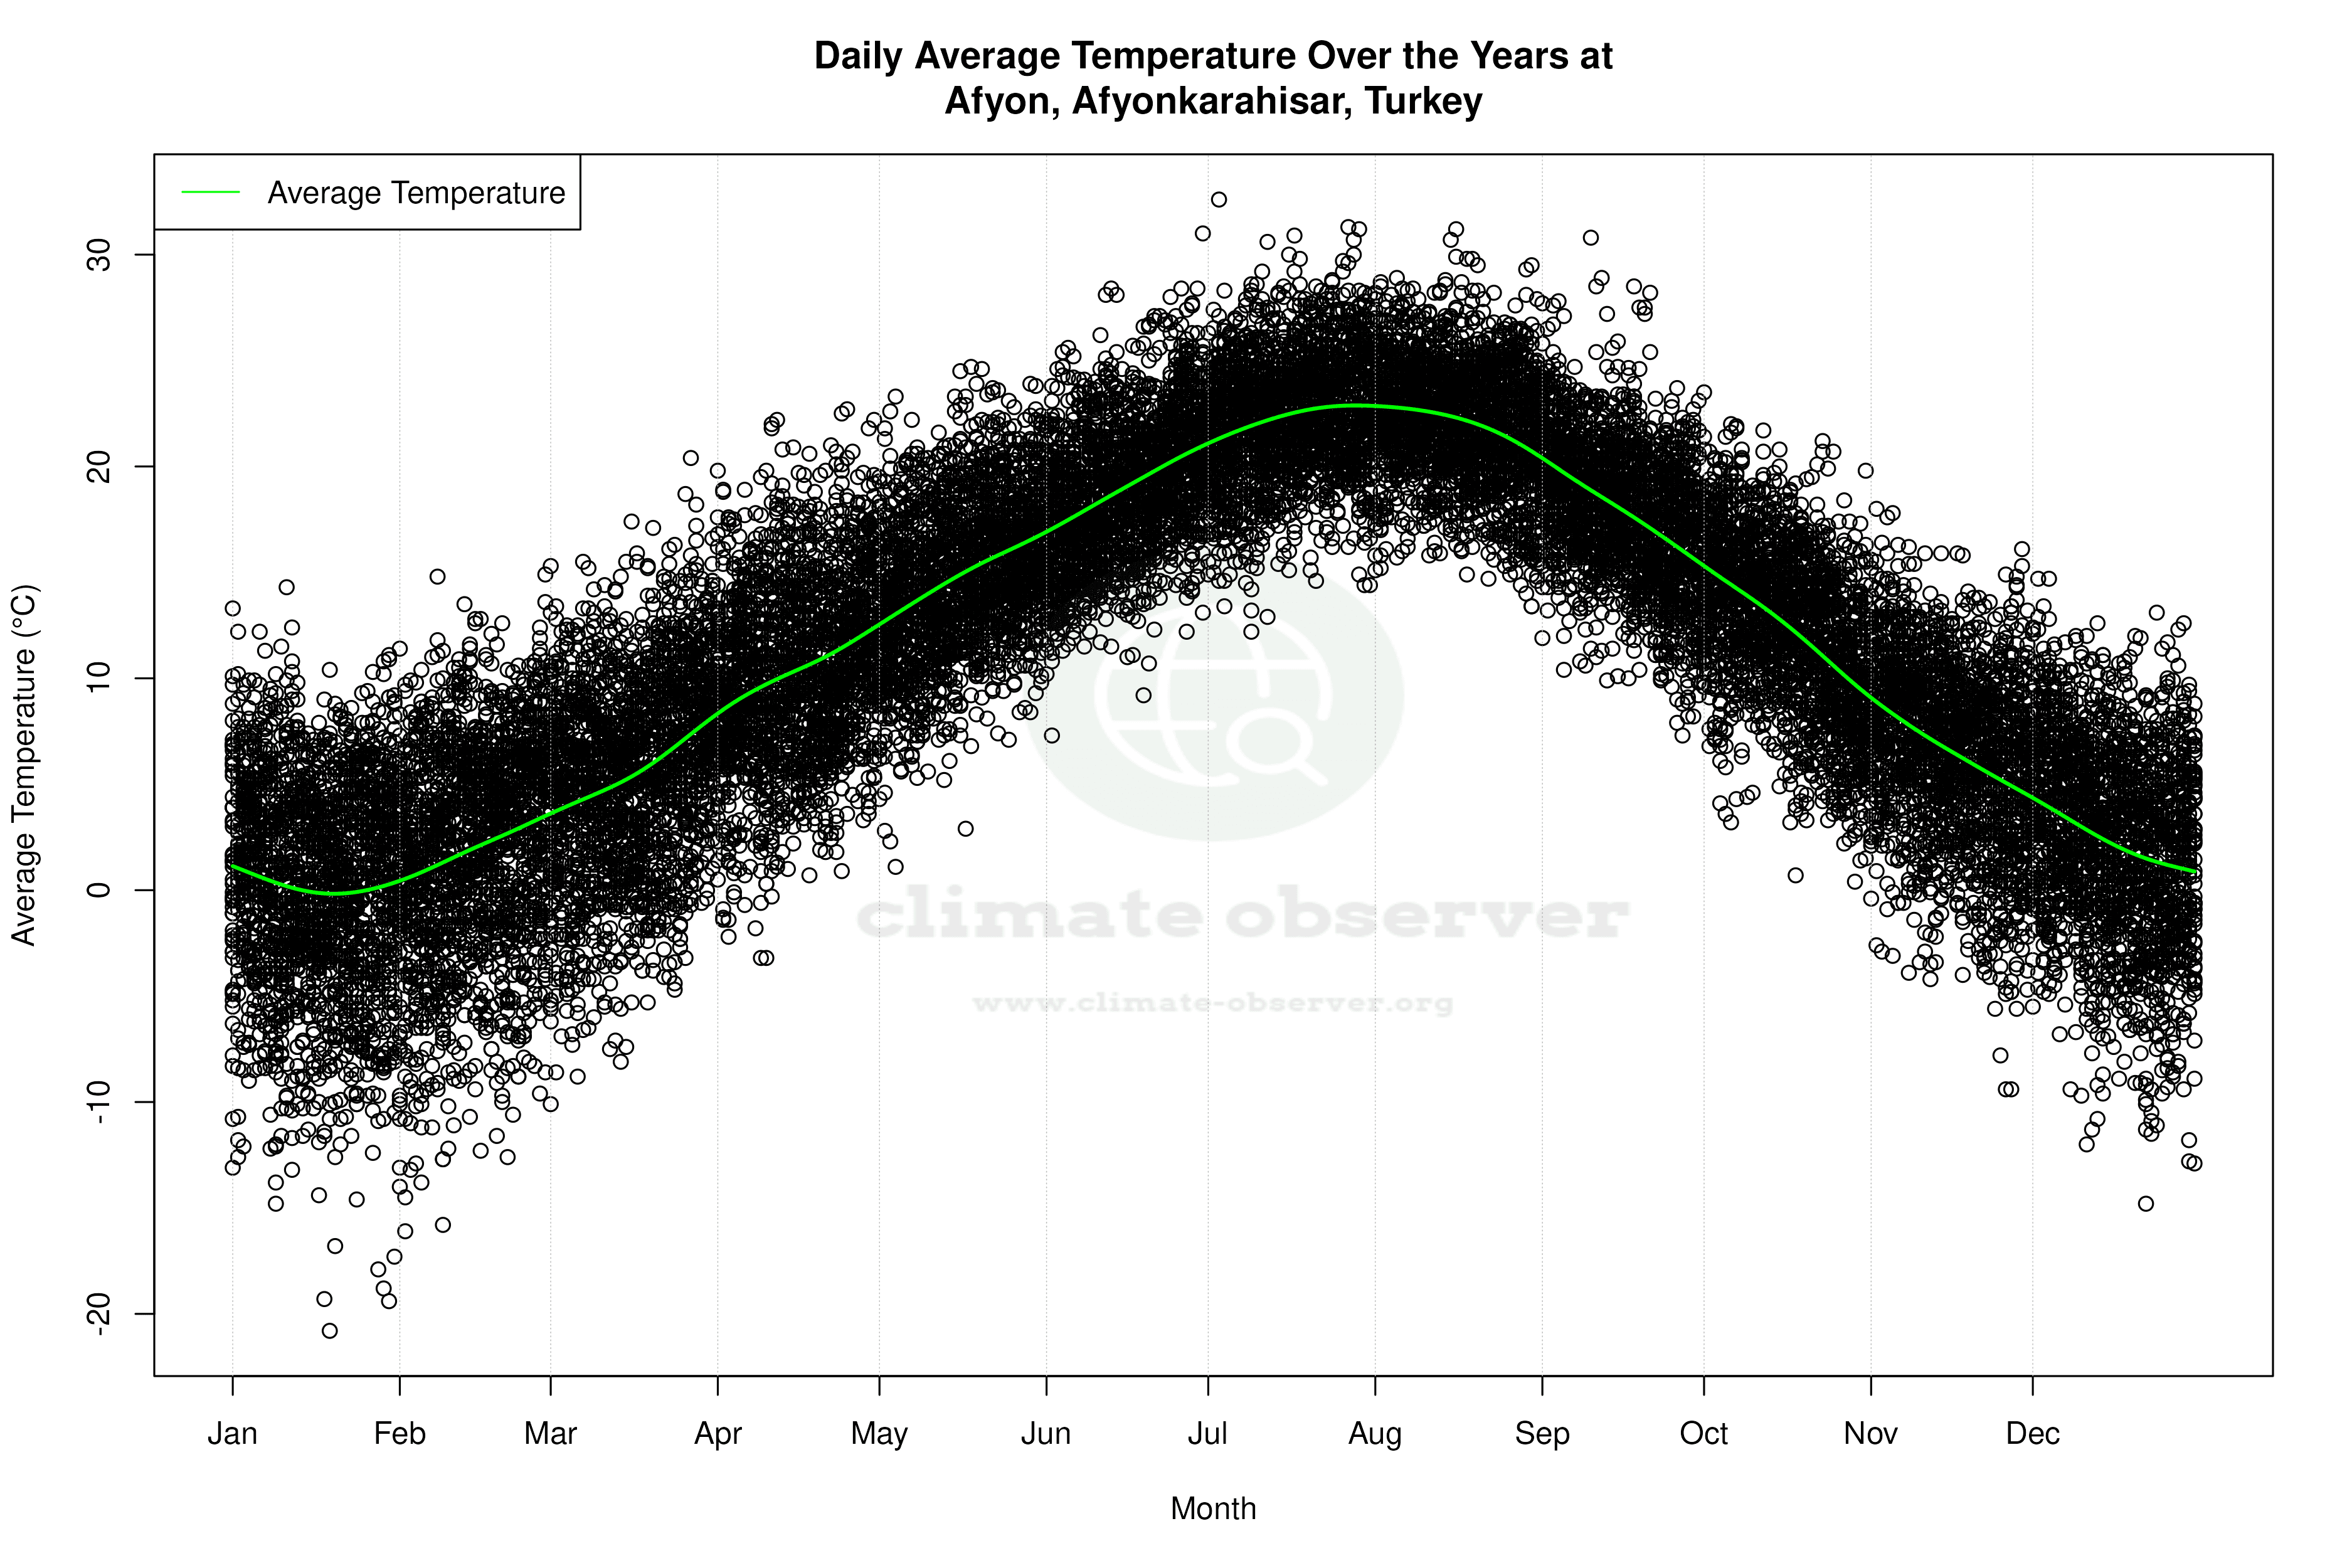


Average Max Temperature Throughout Year | 1 of 5
