Climate for Station: Antalya, Turkey
Loading live weather...
Climate Analysis & Overview
Antalya's climate is experiencing a notable warming trend, particularly in nighttime temperatures, with a significant shift towards more evenly distributed precipitation patterns. These changes are reflective of broader regional climate dynamics and Turkey's ongoing adaptation efforts.
Mediterranean Warmth and Coastal Influence
Antalya, situated on Turkey's southwestern coast, benefits from a Mediterranean climate, characterised by hot, dry summers and mild, wet winters. The city's location along the coast of the Mediterranean Sea moderates temperatures, but recent data indicates a warming trend. Over the past decade, high temperatures have increased by 0.41°C (0.74°F), while lows have risen by a more pronounced 1.68°C (3.02°F). This suggests a significant warming of nighttime temperatures, which can impact local ecosystems and energy consumption patterns.
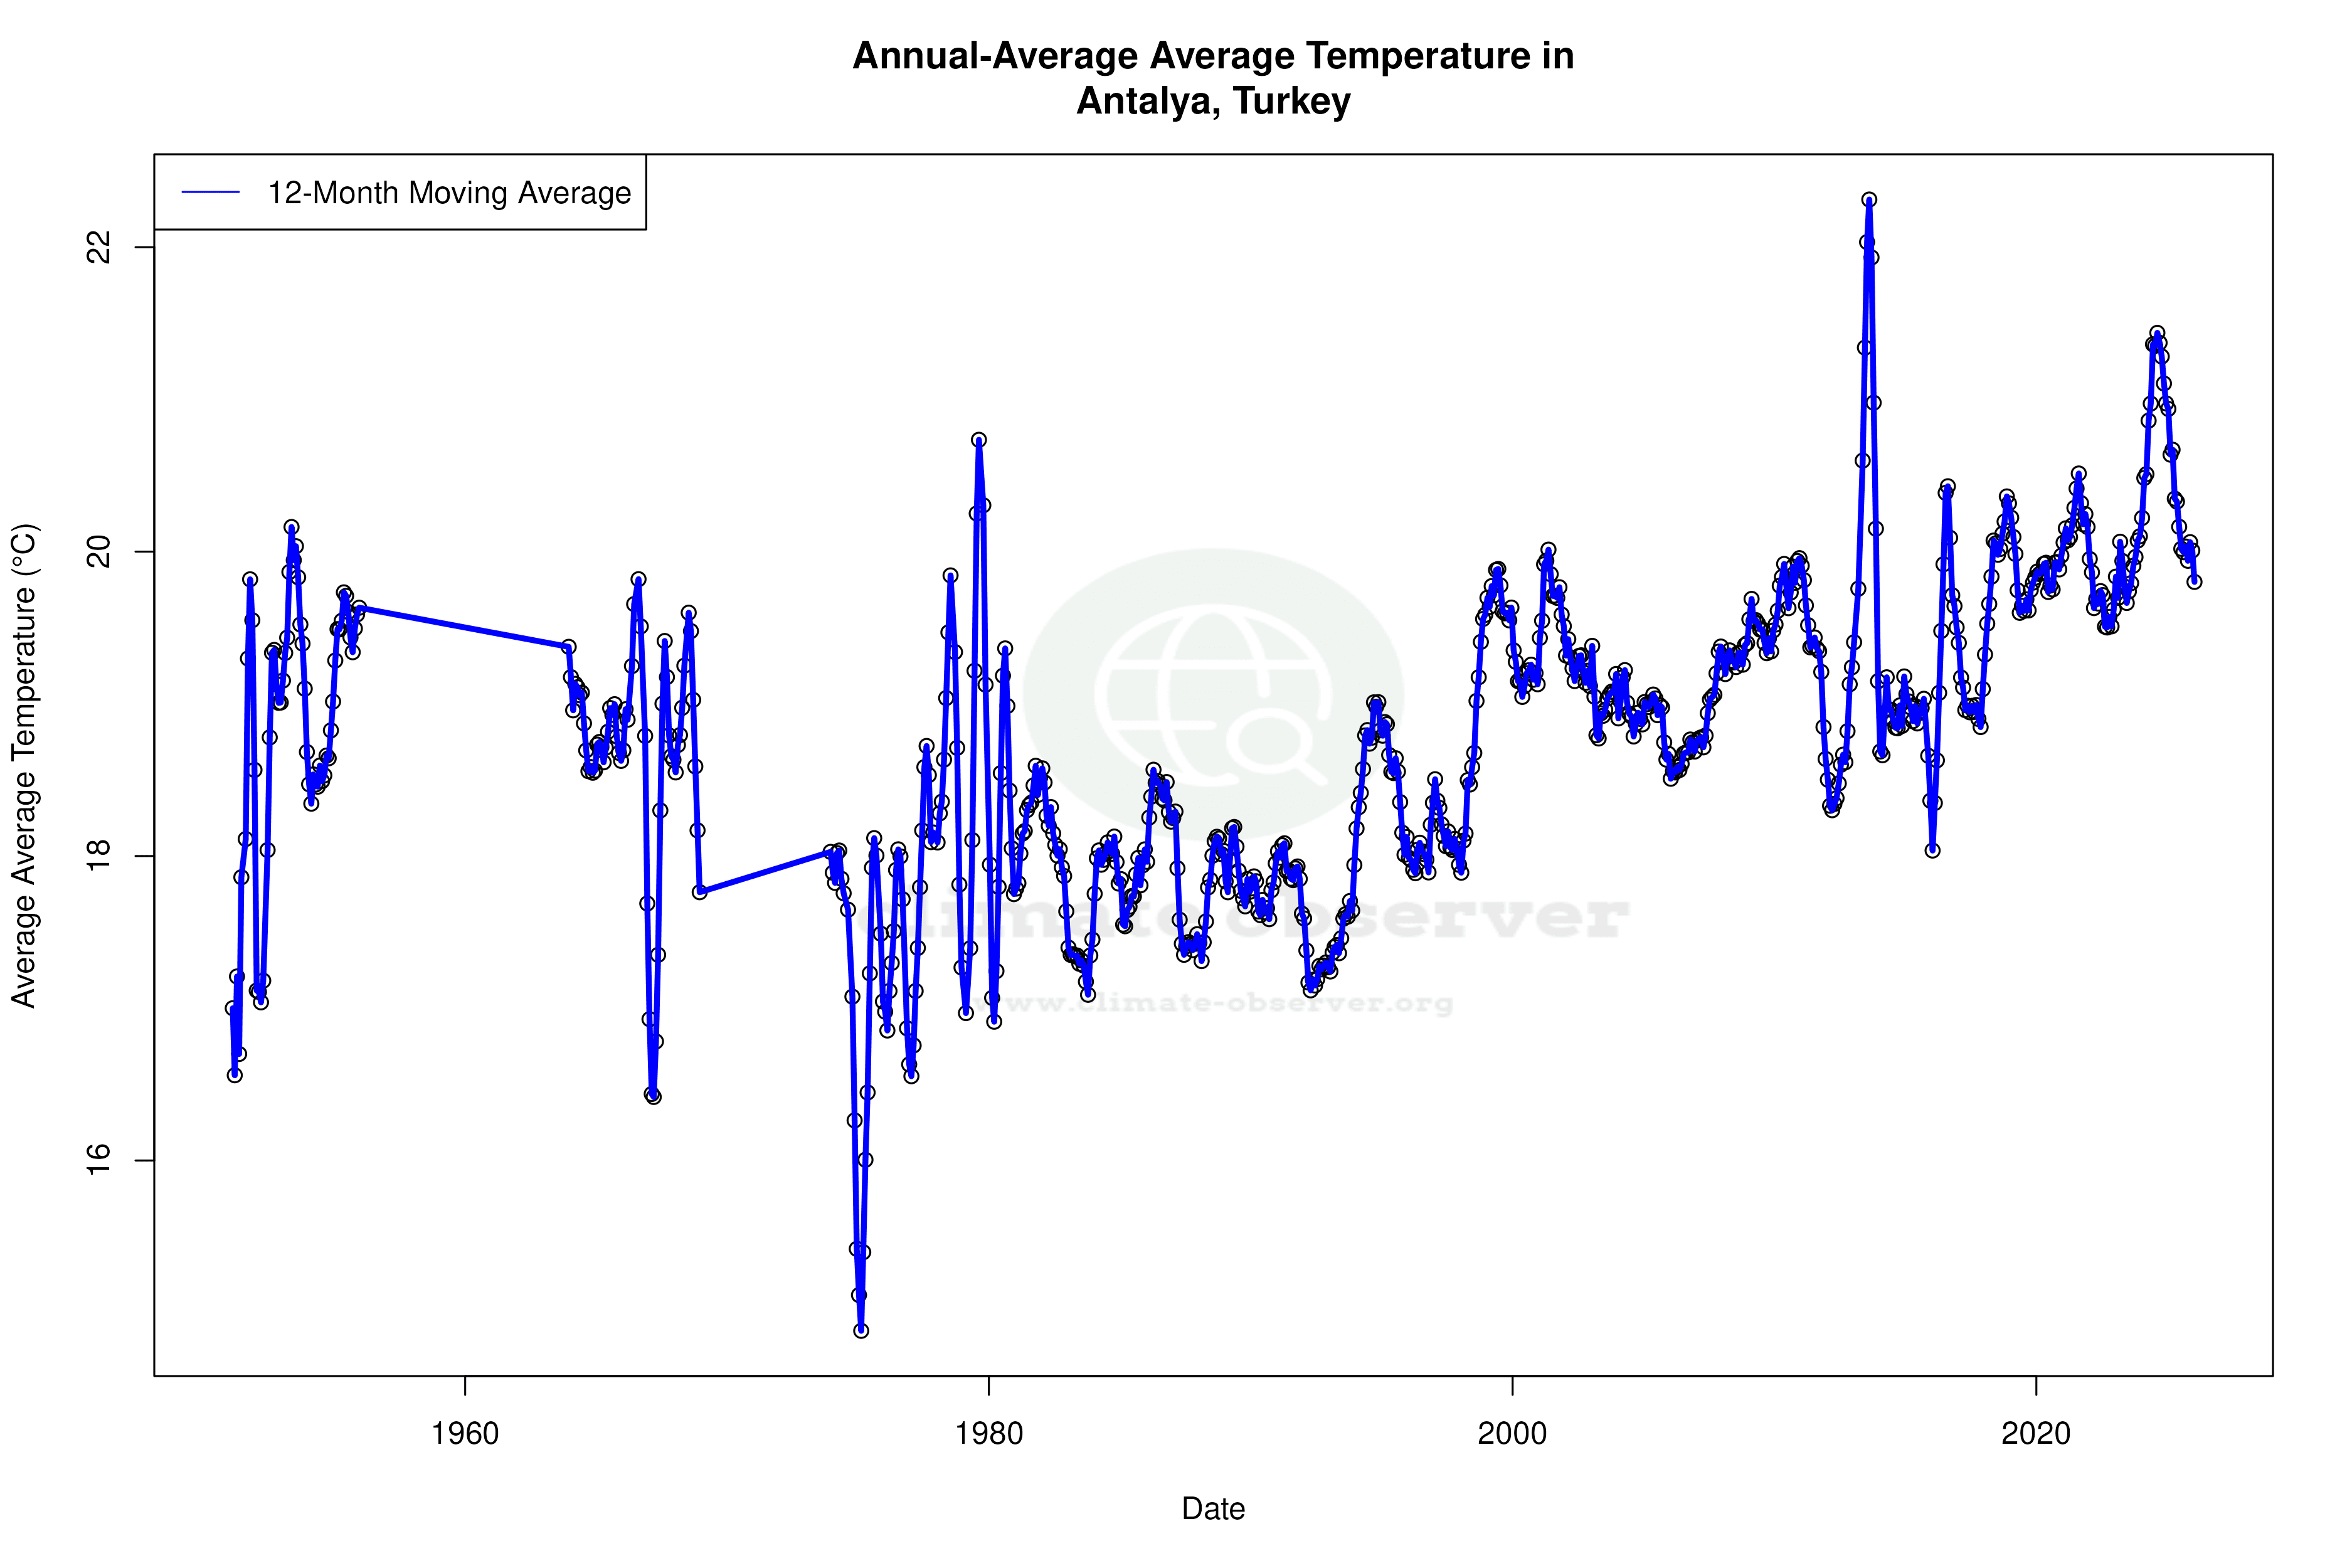
Long-term Warming Trends
Examining the all-time data, the warming trend is evident, albeit at a slower pace. High temperatures have increased by 0.28°C (0.50°F), and lows by 0.49°C (0.88°F). This persistent rise in temperatures aligns with global climate change patterns, where warming is more pronounced in minimum temperatures. These trends highlight the need for adaptive strategies in urban planning and infrastructure to mitigate heat-related impacts.
Precipitation Patterns: A Shift Towards Even Distribution
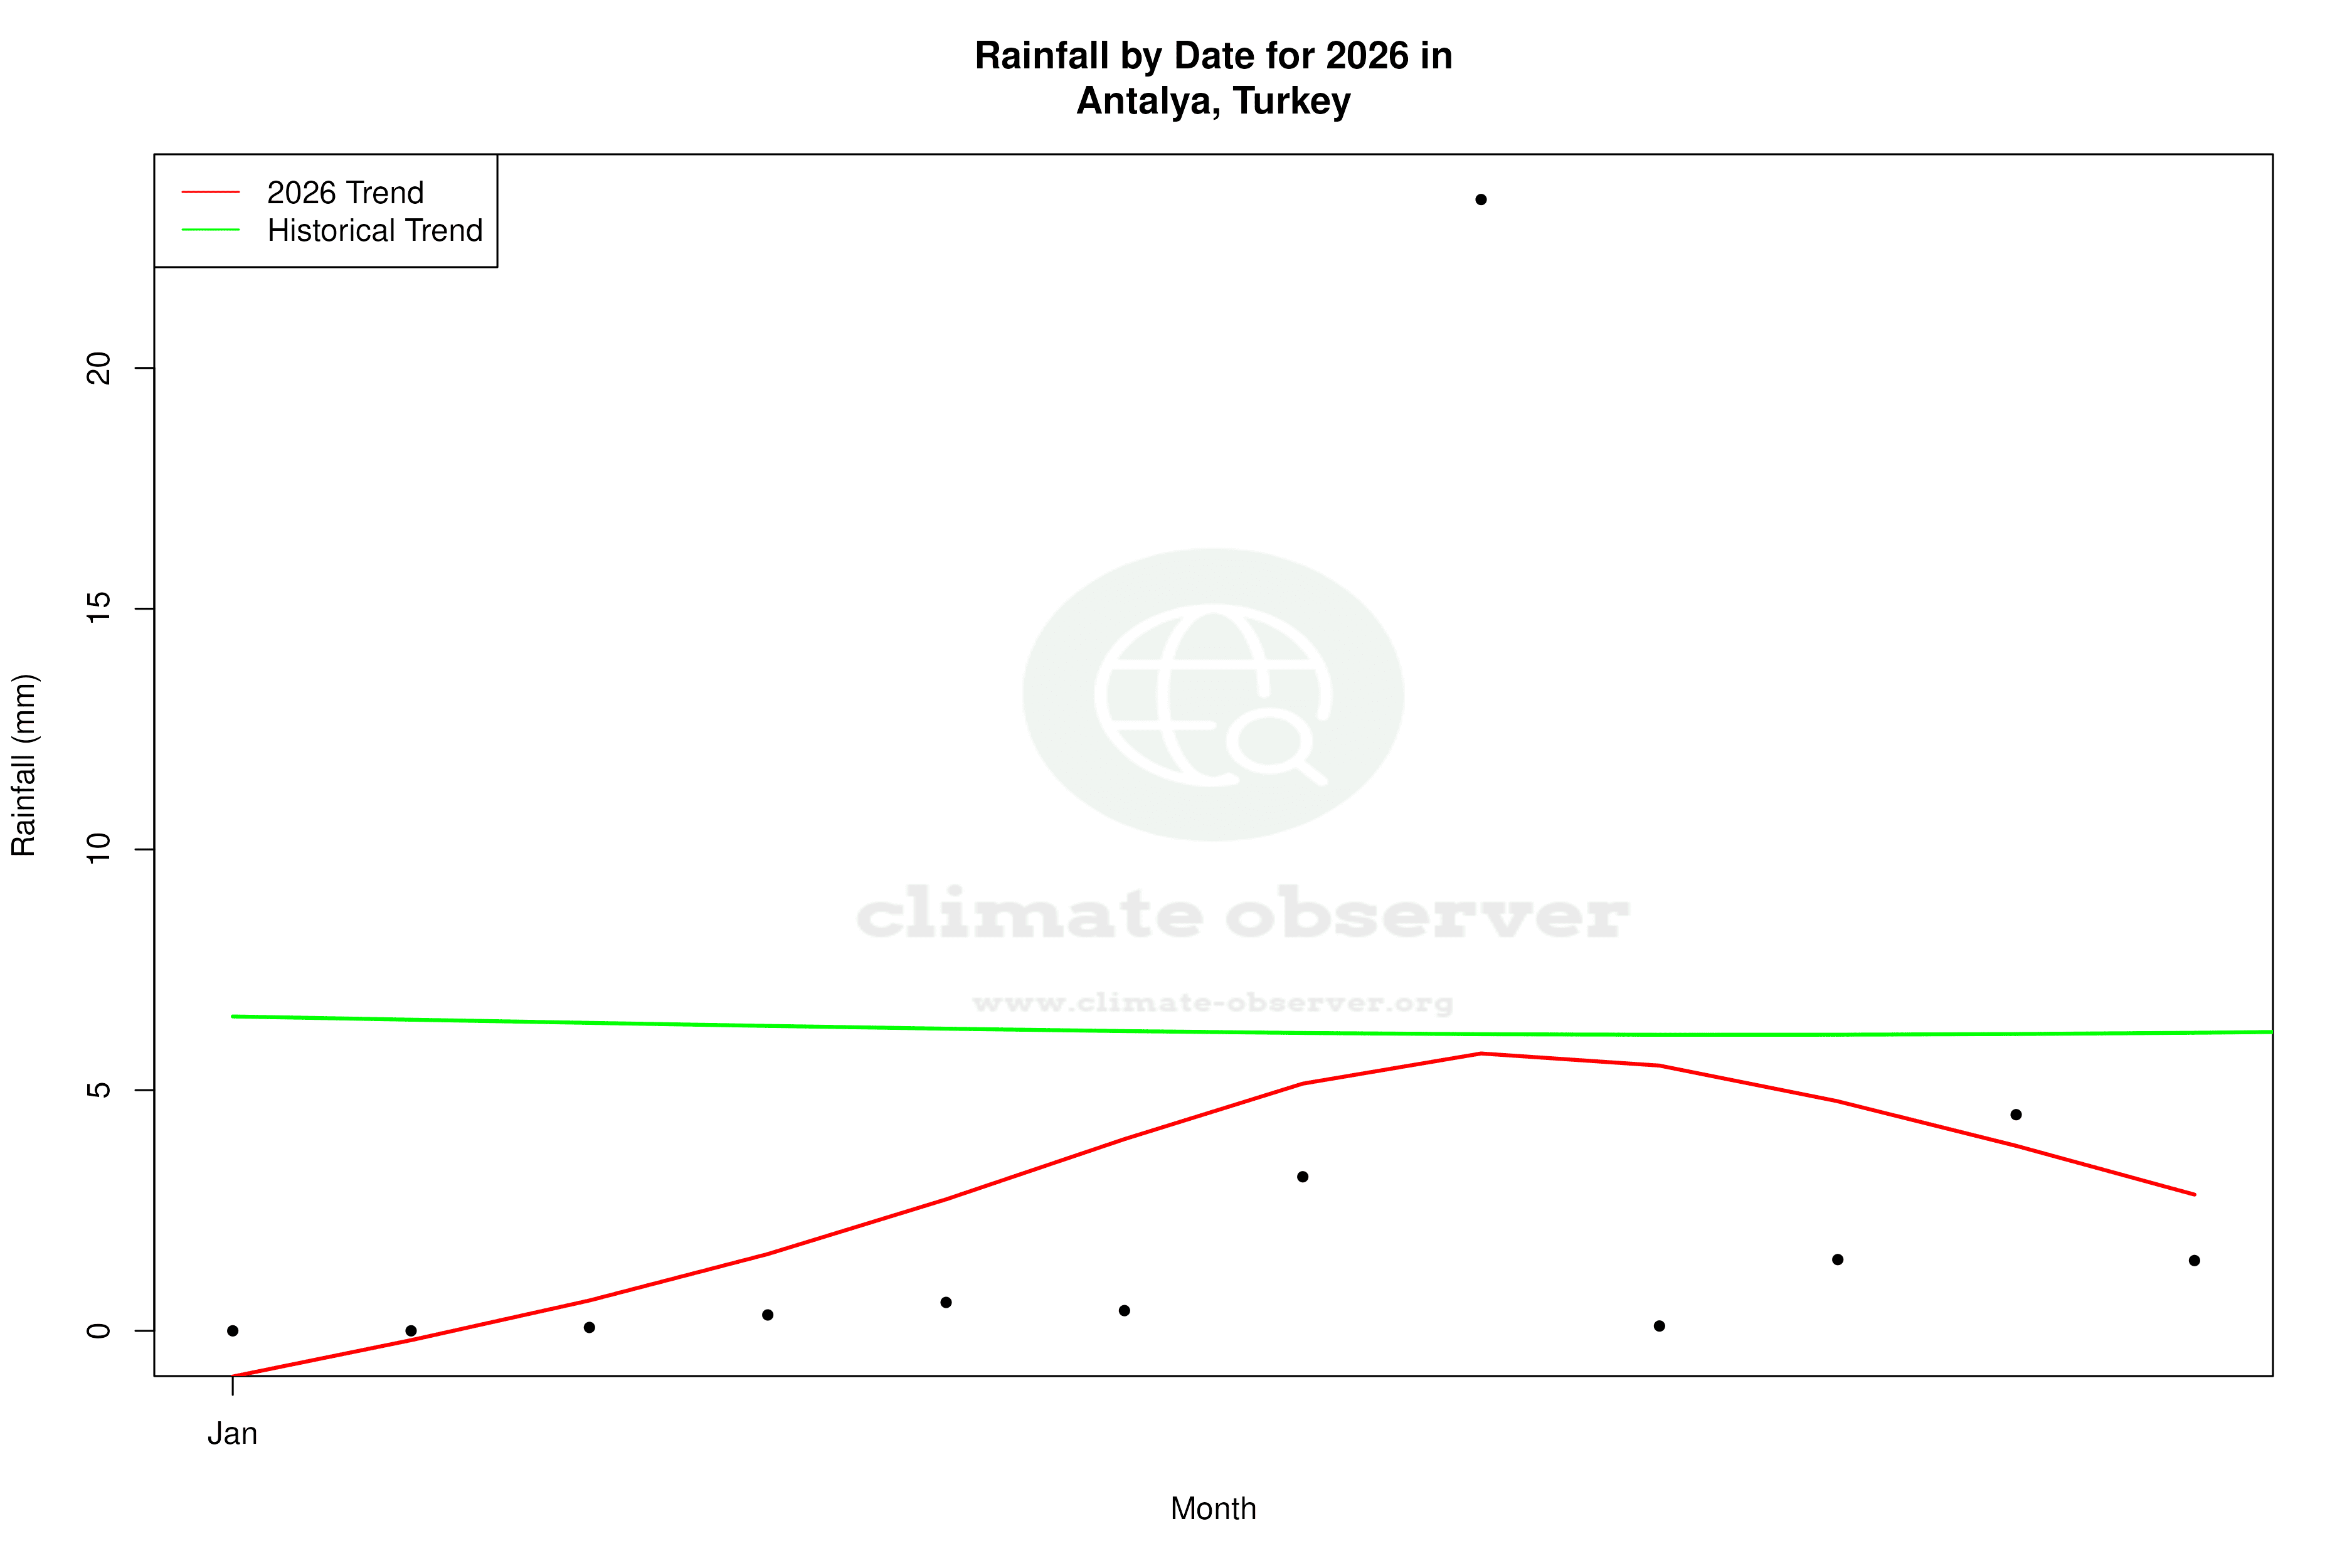
The Precipitation Concentration Index (PCI) for Antalya has shown a notable decrease from a baseline of 18.1 to a current value of 14.3. This indicates that precipitation is becoming more evenly distributed throughout the year, moving away from a pattern of concentrated heavy rainfall events. Such a shift can have significant implications for water resource management and agriculture, as more consistent rainfall can improve soil moisture levels and reduce the risk of flooding.
Record Extremes and Climate Variability
Antalya's climate data also reveals extreme temperature records, with a maximum of 45.2°C (113.4°F) and a minimum of -7.8°C (17.96°F). These extremes underscore the variability inherent in the region's climate, influenced by both local geography and broader climatic changes. Such variability necessitates a robust approach to climate resilience, particularly in light of Turkey's regional climate goals to enhance sustainability and reduce carbon emissions.
Adapting to a Changing Climate
Antalya's climate profile reflects broader regional trends, with a clear warming signal and evolving precipitation patterns. These changes are occurring against the backdrop of Turkey's national climate goals, which include reducing greenhouse gas emissions and enhancing adaptive capacity. Recent weather events, such as heatwaves and unseasonal rainfall, serve as reminders of the urgent need for comprehensive climate strategies that address both mitigation and adaptation.
Station Statistics
10-Year Trend
High: +0.13 °C/decade
Low: +1.50 °C/decade
Rain: +0.78 mm/decade
25-Year Trend
High: +0.07 °C/decade
Low: +0.90 °C/decade
Rain: -0.31 mm/decade
50-Year Trend
High: +0.27 °C/decade
Low: +0.90 °C/decade
Rain: -0.08 mm/decade
All-Time Trend
High: +0.22 °C/decade
Low: +0.51 °C/decade
Rain: -0.06 mm/decade
Percentage Above-Average Days
Last 12 Months: 43.3%
This Year: 26.7%
Precipitation Concentration Index (PCI) ℹ️
Last 12 Months: 18.5
Historical Average: 21.8
Percentile Rank of Last 12 Months ℹ️
High: 49th percentile
Low: 95th percentile
Rain: 54th percentile
Change in Variance ℹ️
High: -3.7%
Low: +5.8%
Intraday: -25.4%
Data Coverage
79.0%
First Year of Data
1951
Station Location
Historical Weather Records
| Max High | Avg High | Min High | Max Avg | Avg Avg | Min Avg | Max Low | Avg Low | Min Low | Max Precipitation | Avg Precipitation | Max Snow | Avg Snow | |
|---|---|---|---|---|---|---|---|---|---|---|---|---|---|
| Record | 45.2 °C | — | 3.5 °C | 38.0 °C | — | -1.2 °C | 32.0 °C | — | -7.8 °C | 257.0 mm | — | — | — |
| January | 23.9 °C | 14.9 °C | 3.5 °C | 18.1 °C | 9.9 °C | -1.2 °C | 16.8 °C | 5.5 °C | -7.8 °C | 257.0 mm | 6.9 mm | — | — |
| February | 26.1 °C | 15.6 °C | 4.1 °C | 18.7 °C | 10.7 °C | 0.8 °C | 16.0 °C | 6.1 °C | -5.4 °C | 132.1 mm | 4.5 mm | — | — |
| March | 29.0 °C | 18.1 °C | 5.6 °C | 21.1 °C | 12.9 °C | 3.6 °C | 17.0 °C | 7.7 °C | -2.0 °C | 113.0 mm | 2.5 mm | — | — |
| April | 36.4 °C | 21.6 °C | 9.1 °C | 27.1 °C | 16.3 °C | 6.2 °C | 21.0 °C | 11.0 °C | -0.9 °C | 107.8 mm | 1.7 mm | — | — |
| May | 41.5 °C | 25.9 °C | 14.0 °C | 32.6 °C | 20.5 °C | 10.8 °C | 25.0 °C | 15.1 °C | 5.5 °C | 45.8 mm | 0.9 mm | — | — |
| June | 44.8 °C | 31.2 °C | 18.0 °C | 36.6 °C | 25.4 °C | 16.5 °C | 29.6 °C | 19.6 °C | 7.0 °C | 22.7 mm | 0.3 mm | — | — |
| July | 45.2 °C | 34.7 °C | 25.9 °C | 38.0 °C | 28.7 °C | 21.7 °C | 32.0 °C | 22.9 °C | 14.9 °C | 24.1 mm | 0.1 mm | — | — |
| August | 44.4 °C | 34.3 °C | 28.0 °C | 36.9 °C | 28.5 °C | 22.7 °C | 30.0 °C | 22.9 °C | 10.0 °C | 15.4 mm | 0.1 mm | — | — |
| September | 42.1 °C | 31.5 °C | 22.3 °C | 33.1 °C | 25.3 °C | 18.3 °C | 27.0 °C | 19.5 °C | 10.0 °C | 55.5 mm | 0.4 mm | — | — |
| October | 40.0 °C | 26.9 °C | 12.4 °C | 31.4 °C | 20.6 °C | 9.9 °C | 27.0 °C | 15.3 °C | 3.9 °C | 115.0 mm | 2.1 mm | — | — |
| November | 33.7 °C | 21.1 °C | 8.0 °C | 23.9 °C | 15.2 °C | 5.7 °C | 20.0 °C | 10.4 °C | -0.6 °C | 249.9 mm | 4.1 mm | — | — |
| December | 25.9 °C | 16.5 °C | 5.2 °C | 18.9 °C | 11.4 °C | 2.1 °C | 16.1 °C | 7.1 °C | -2.3 °C | 223.3 mm | 7.4 mm | — | — |
Data Visualisations
Remove WatermarksCurrent Year Climate Trends vs Historical
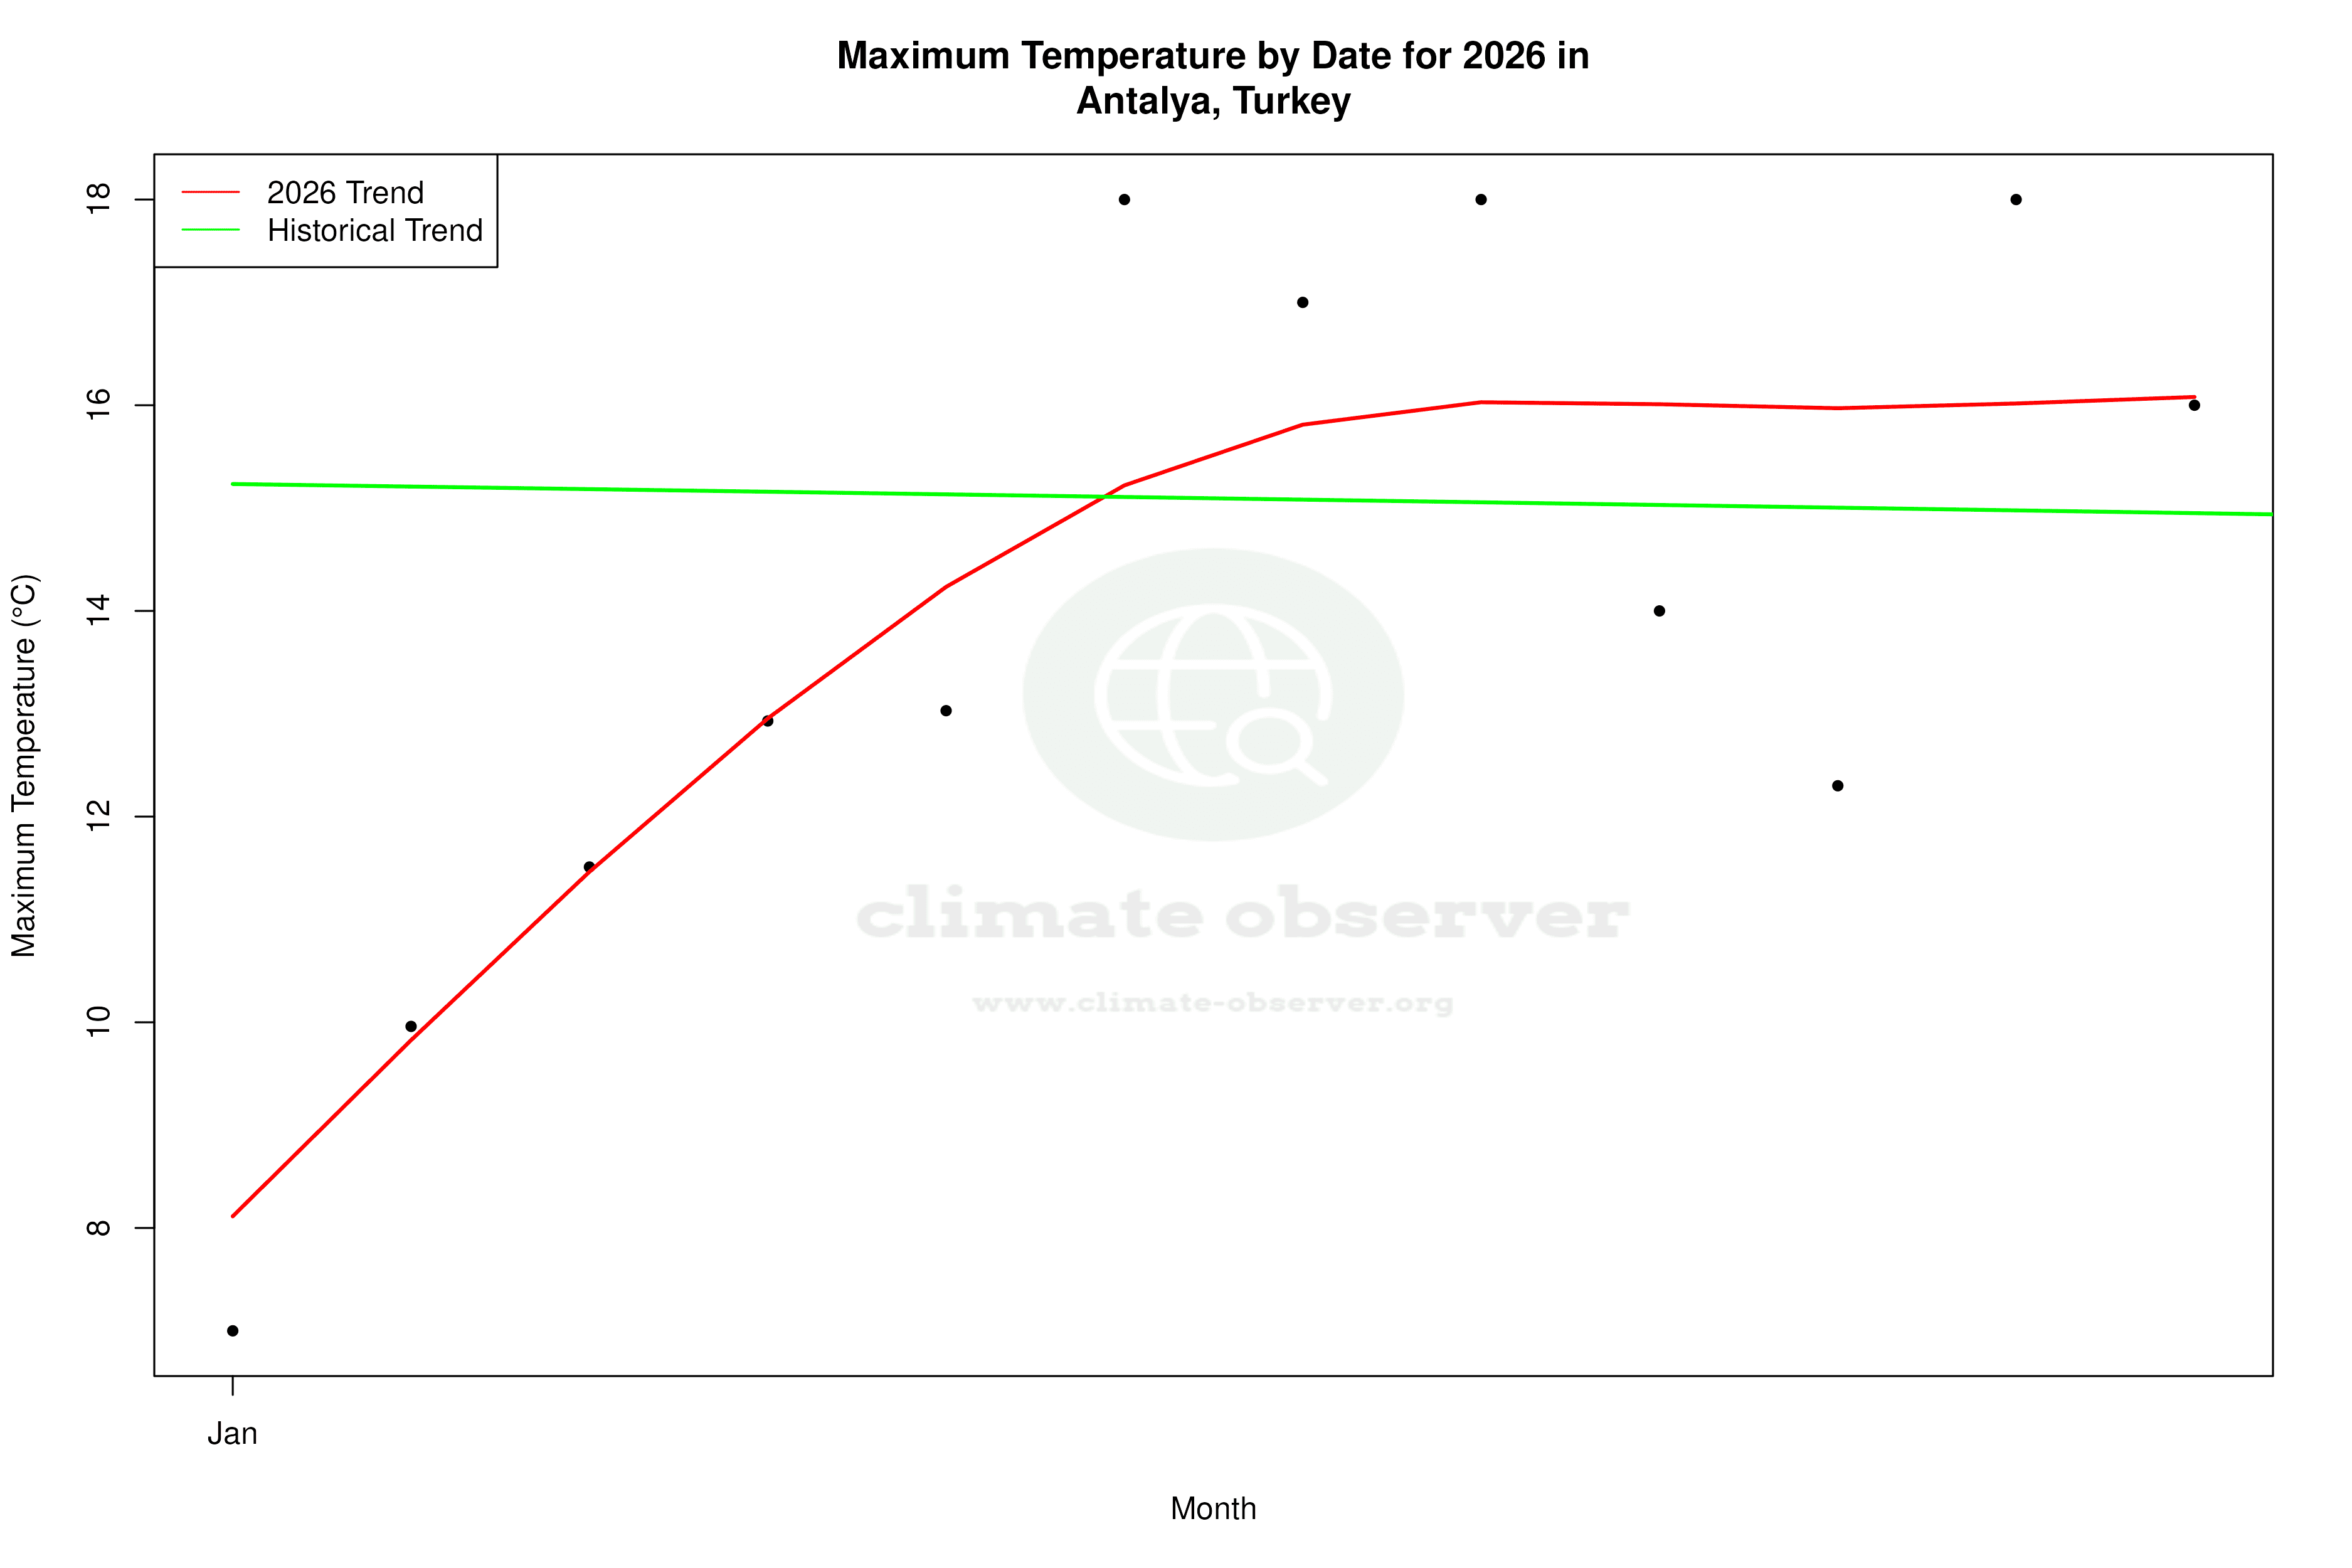


Max Temperature this Year | 1 of 6
Climate 12-Month Moving Averages
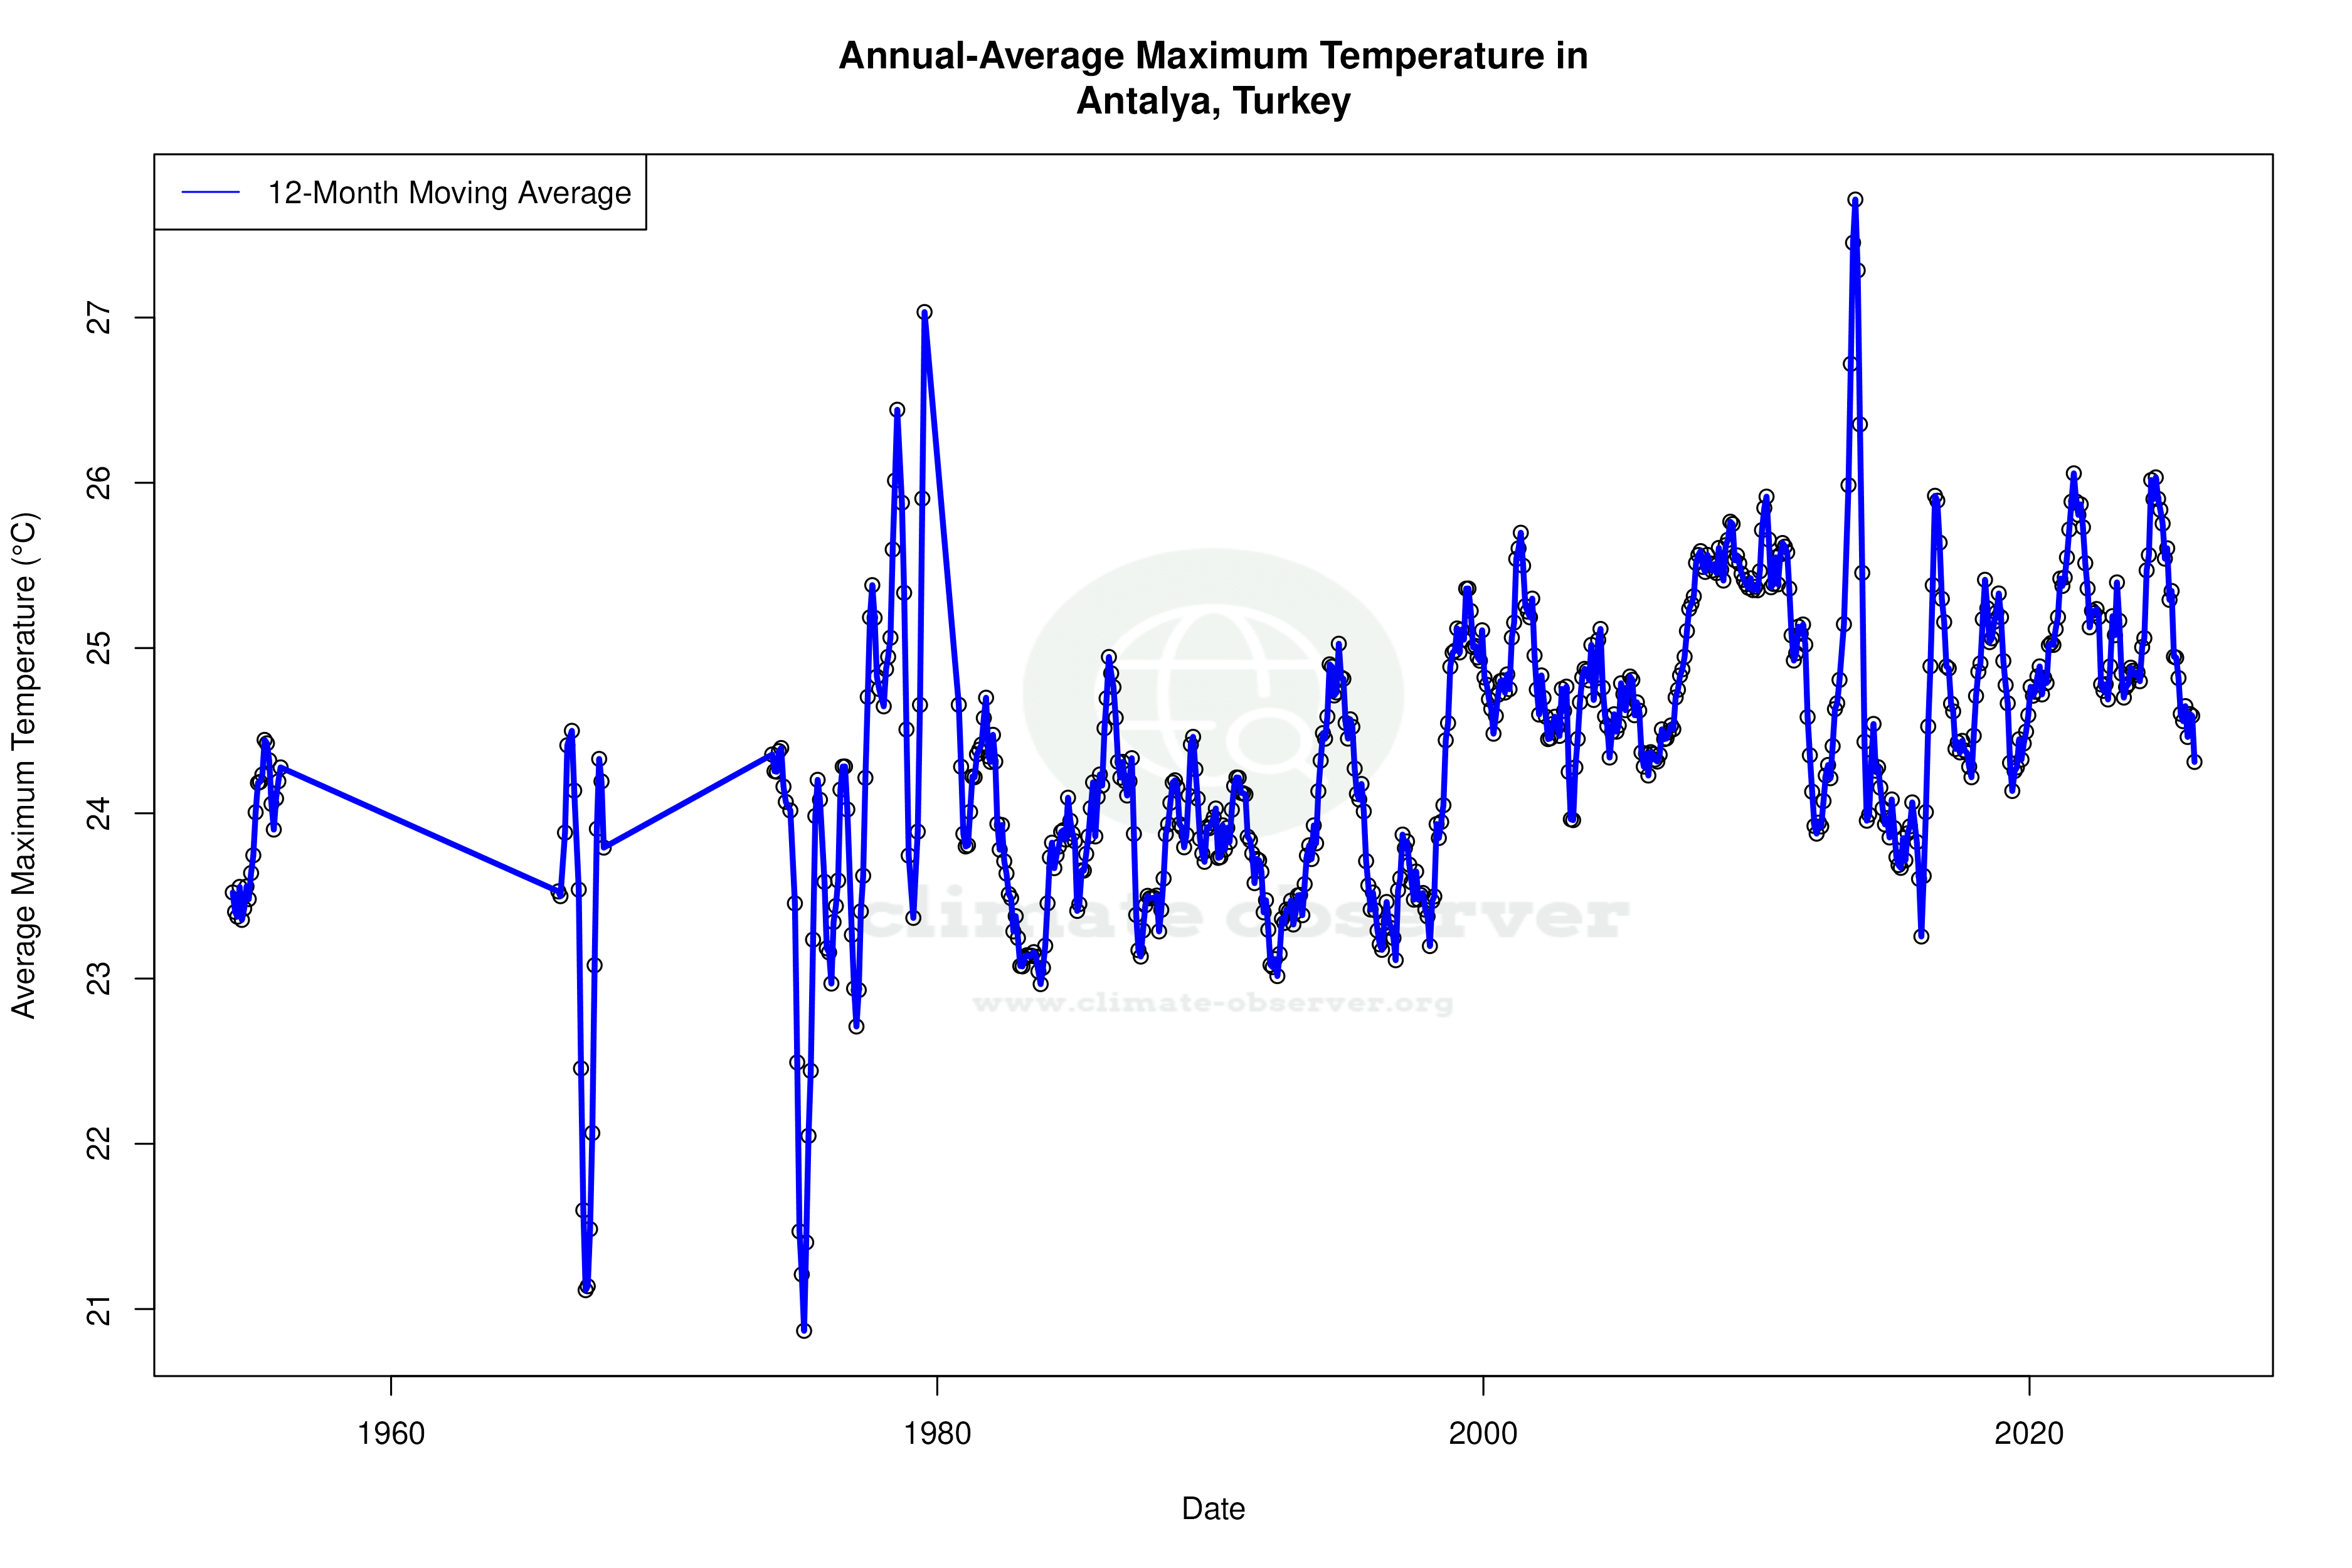
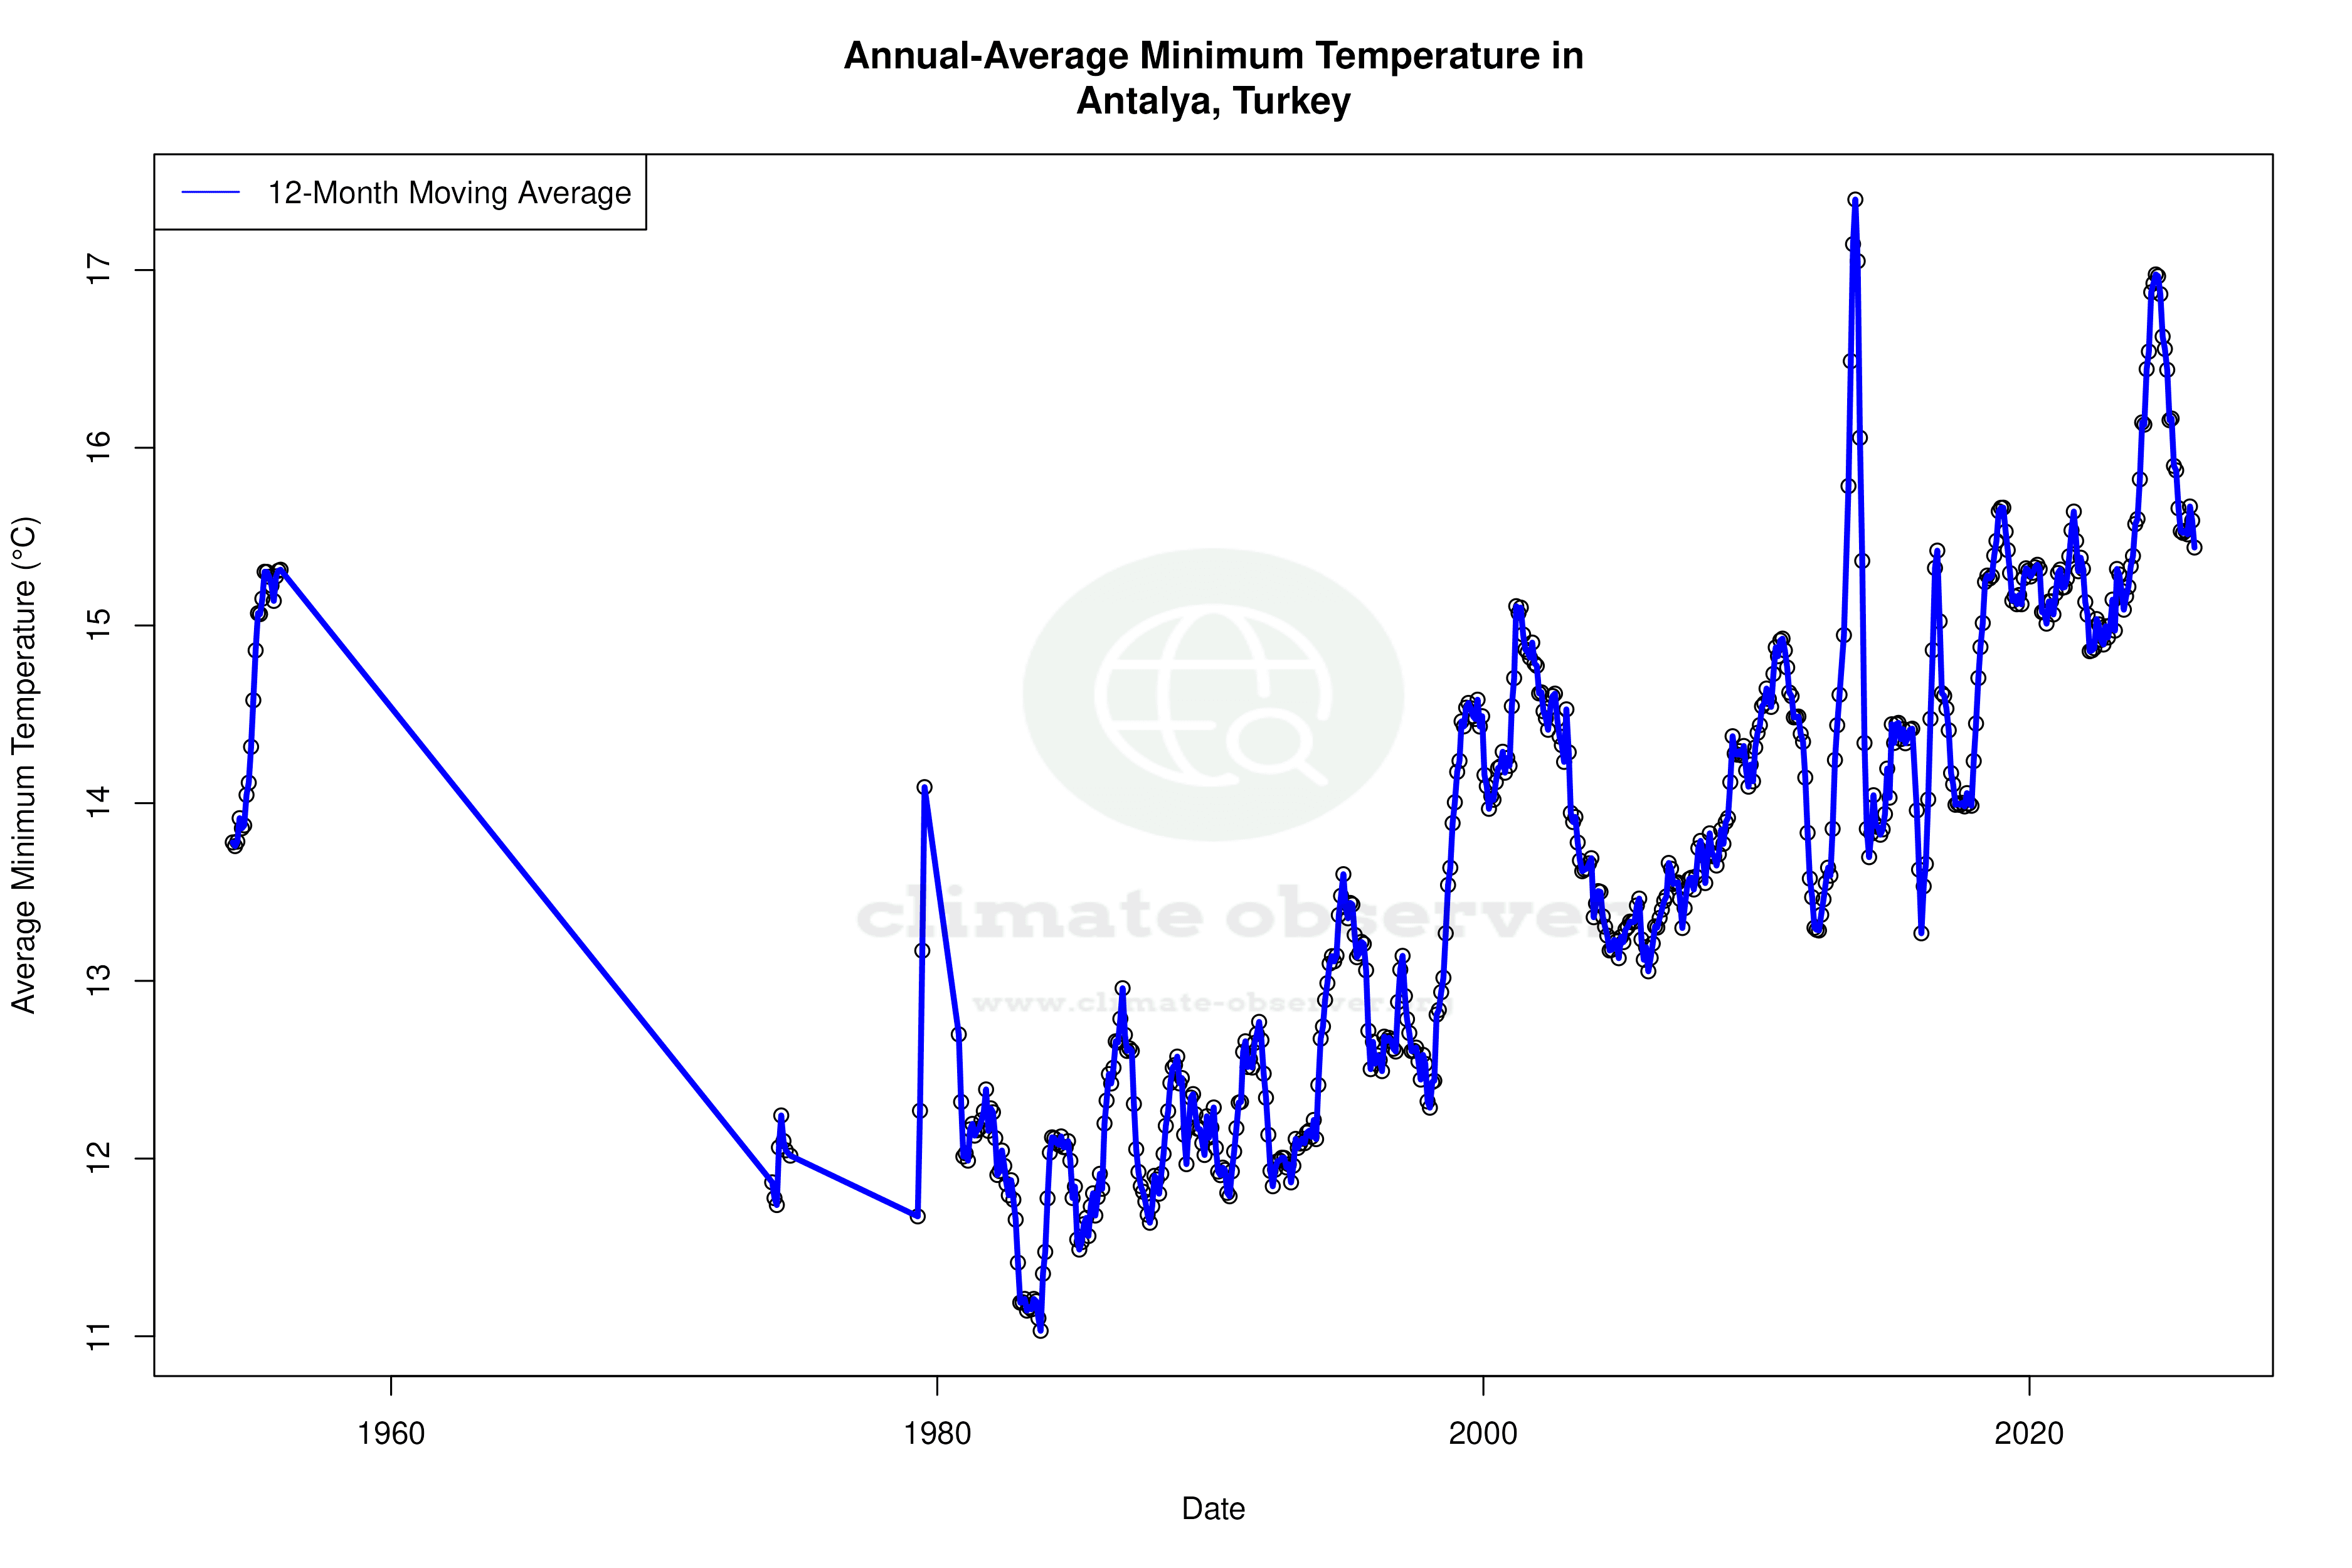


Max Temperature 12-Month MA | 1 of 6
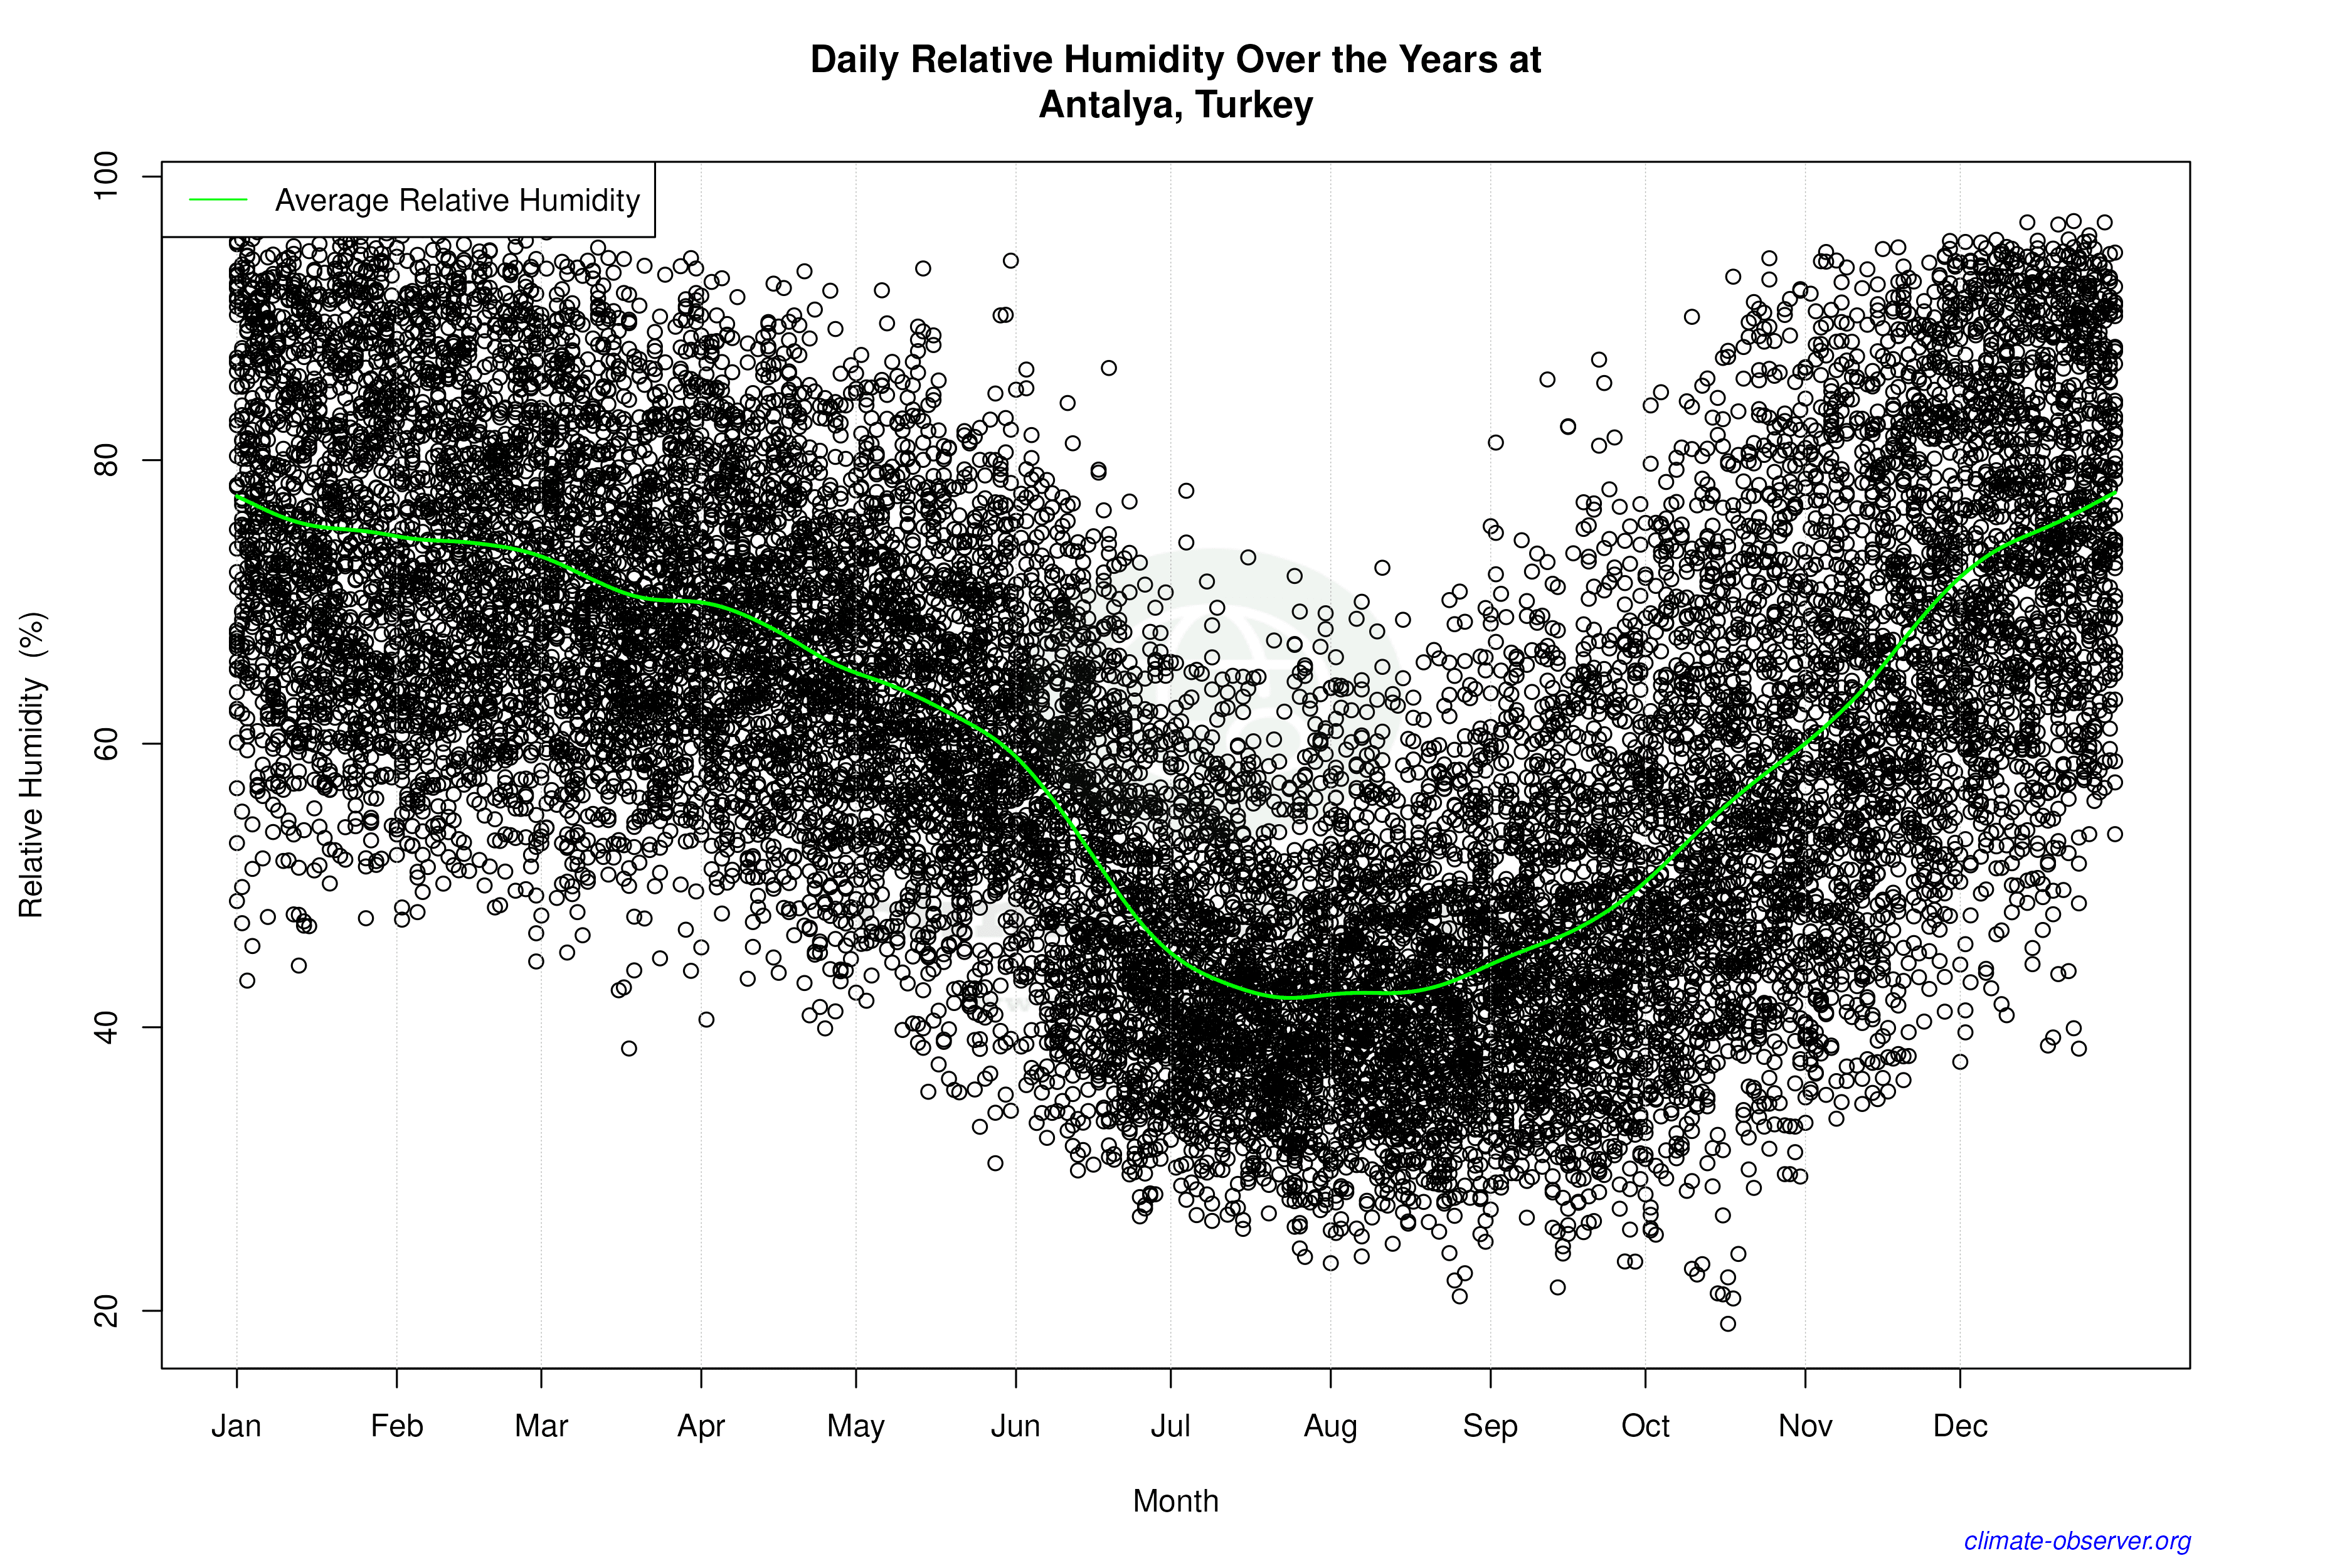
Daily Data Points and Averages Throughout the Year


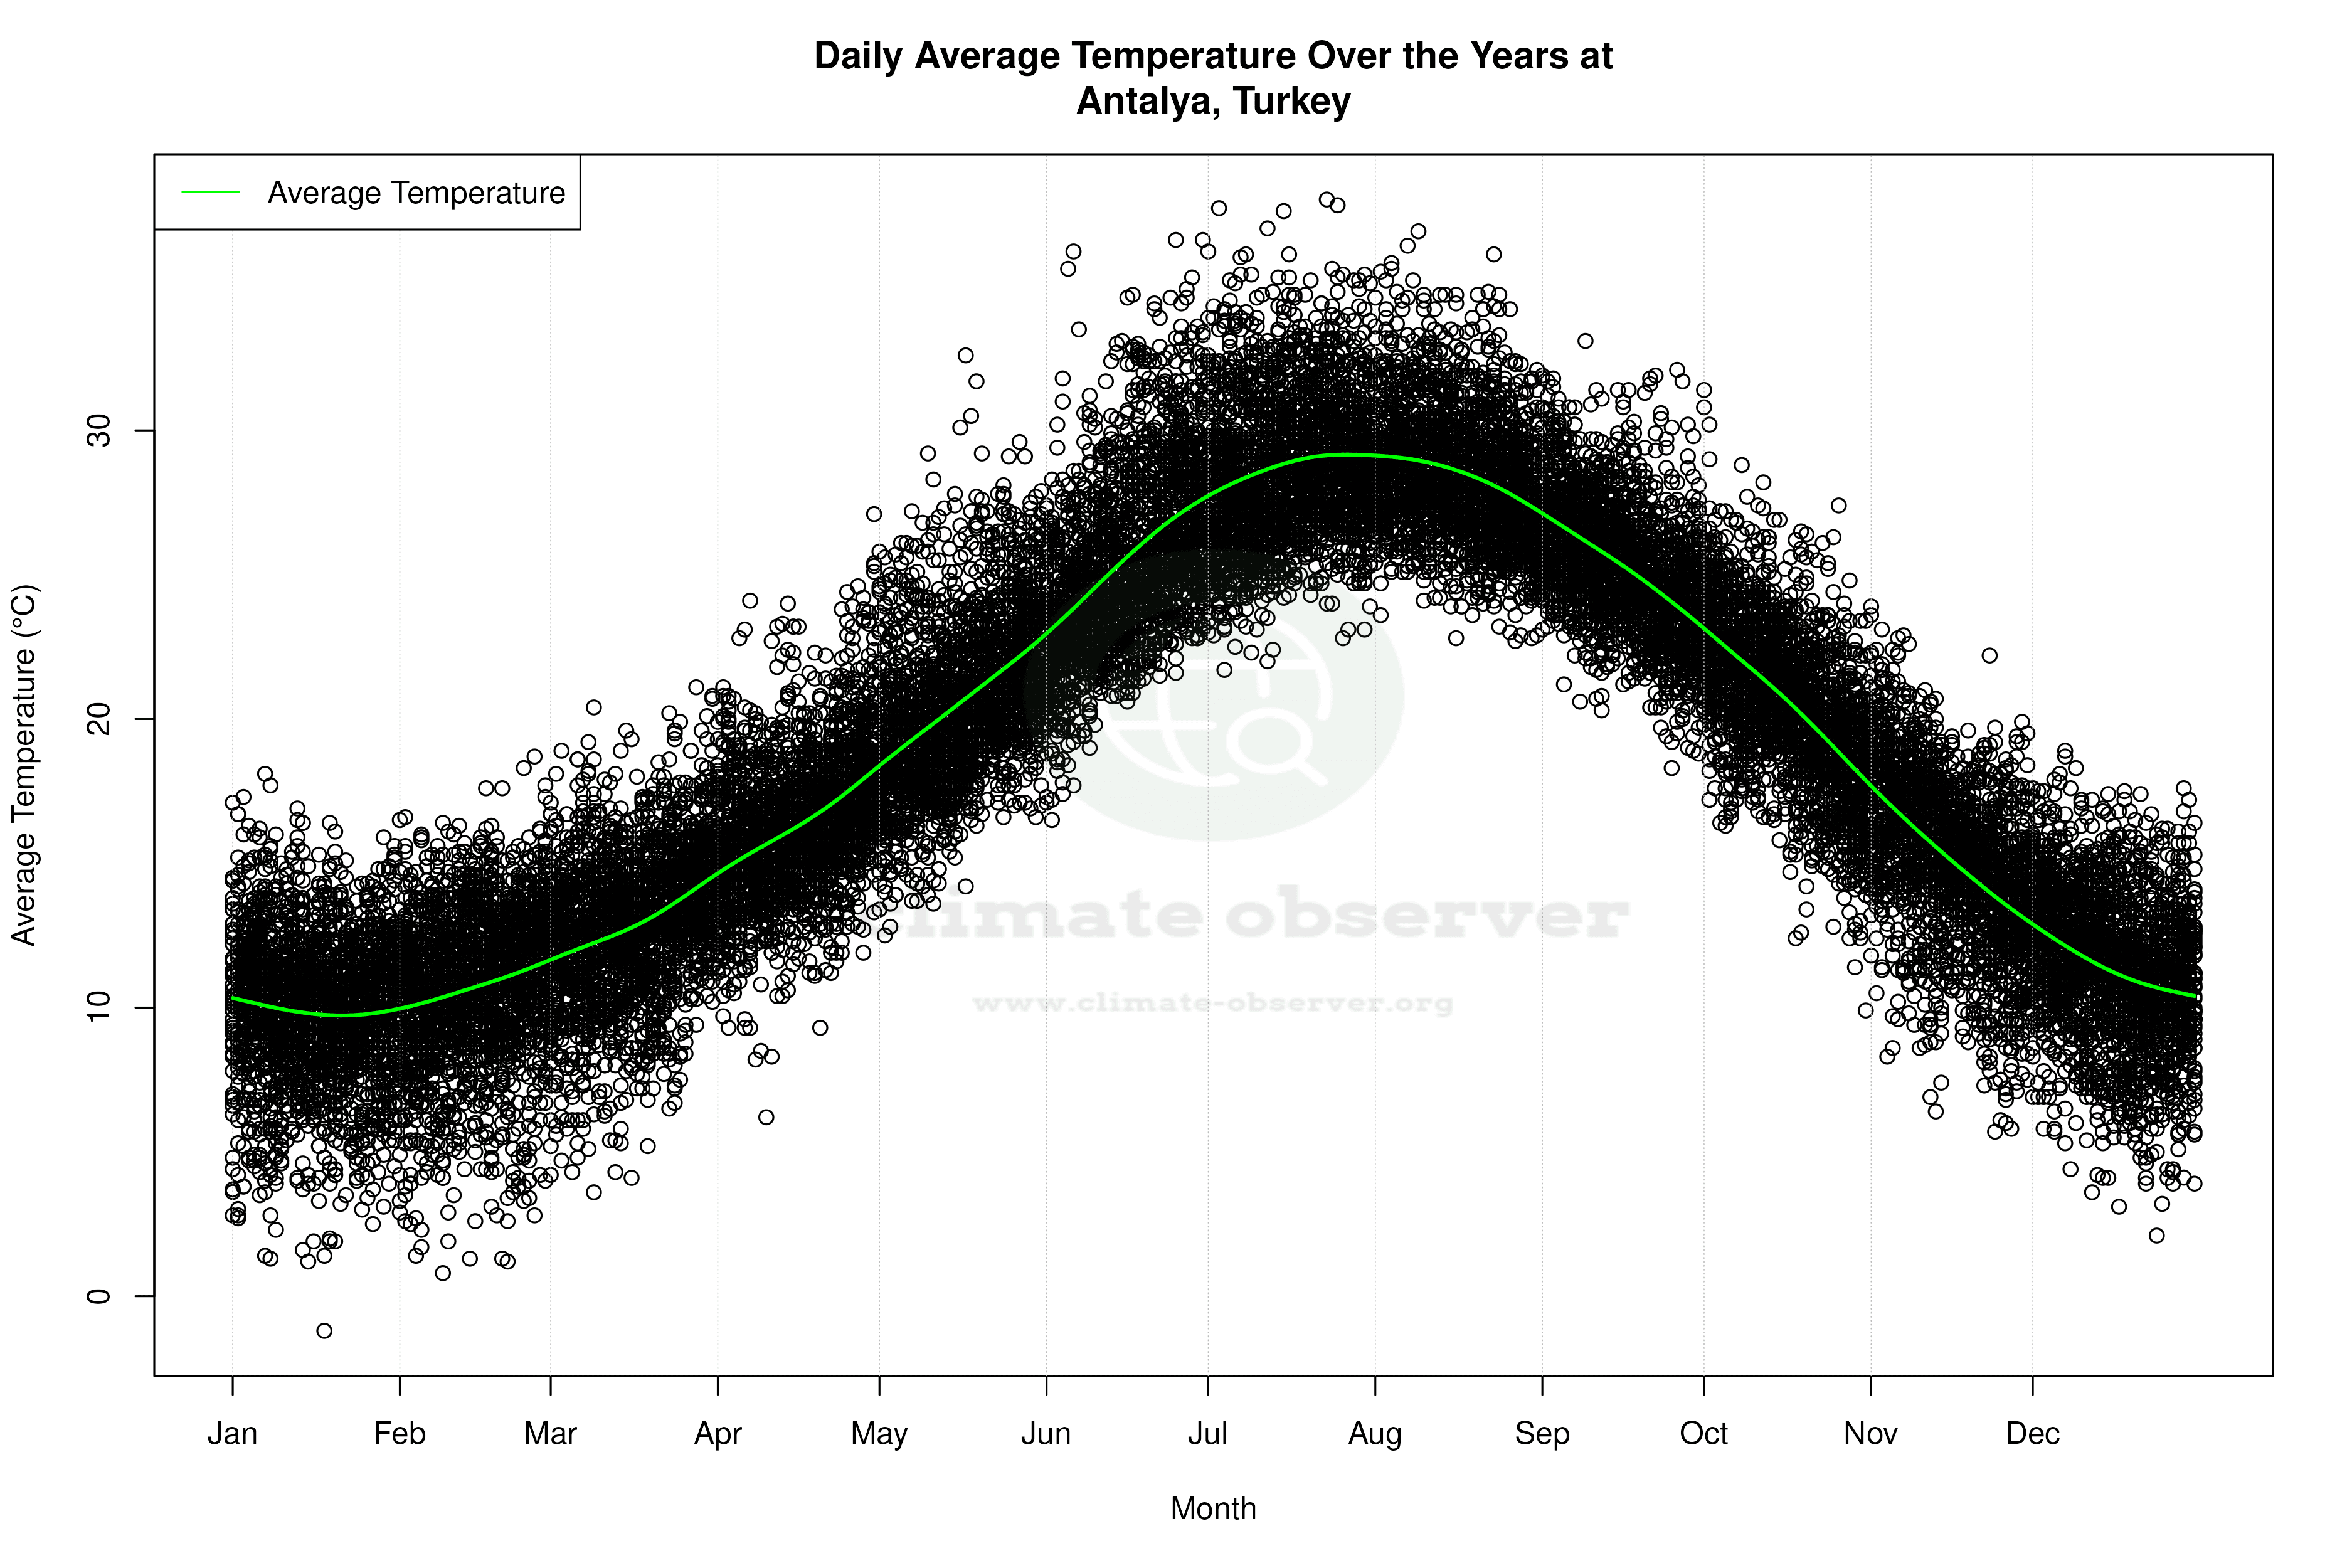

Average Max Temperature Throughout Year | 1 of 5
