Climate for Station: Nanumea, Tuvalu
Loading live weather...
Climate Analysis & Overview
Nanumea, Tuvalu, is experiencing a complex climate narrative with contrasting temperature trends over different timescales. While the long-term data indicates a slight warming, recent years have shown a more pronounced shift with significant cooling in low temperatures. Precipitation patterns have become more evenly distributed, suggesting a shift in rainfall dynamics.
Tropical Climate Dynamics
Nanumea, located in Tuvalu, falls under the tropical rainforest climate classification (Af) according to the Köppen system. This classification is characterised by high temperatures and significant rainfall throughout the year. The island's geographical position, surrounded by the vast Pacific Ocean, plays a crucial role in moderating its climate, providing a buffer against extreme temperature variations.
Temperature Trends and Anomalies
Examining the long-term temperature trends, there is a slight warming noted in the high temperatures, with an increase of 0.01°C (0.02°F). Conversely, the lows have experienced a more noticeable rise of 0.28°C (0.50°F). This suggests a general warming trend over the years. However, the recent 10-year data presents a different picture, with high temperatures increasing significantly by 2.73°C (4.91°F), while low temperatures have sharply decreased by 2.17°C (3.90°F). This divergence indicates a period of heightened variability, possibly influenced by regional climatic phenomena or oceanic patterns.
Precipitation Patterns: A Shift Towards Even Distribution
The Precipitation Concentration Index (PCI) for Nanumea has shown a decrease from a baseline of 13.1 to a current value of 10.2. The PCI is a measure of how precipitation is distributed over time, with lower values indicating a more even distribution. This change suggests that rainfall in Nanumea is becoming more evenly spread throughout the year, reducing the likelihood of intense, concentrated rainfall events. Such a shift can have significant implications for water resource management and agricultural practices on the island.
Temperature Extremes and Records
Nanumea has recorded extreme temperatures with a maximum of 39.0°C (102.2°F) and a minimum of 19.0°C (66.2°F). These records highlight the potential for significant thermal stress during peak heat periods, which could impact both human health and the local ecosystem. The wide range between these extremes underscores the importance of understanding and adapting to potential climate variability.
Regional Implications and Climate Goals
Tuvalu, as a nation, has been actively engaged in addressing climate change impacts, given its vulnerability to sea-level rise and extreme weather events. The observed climatic changes in Nanumea, with its shifting temperature trends and evolving precipitation patterns, are critical for informing regional climate strategies. The data underscores the need for adaptive measures to mitigate potential impacts on the island's infrastructure and natural resources.
Station Statistics
10-Year Trend
High: +4.49 °F/decade
Low: -3.70 °F/decade
Rain: -0.073 in/decade
25-Year Trend
High: +0.73 °F/decade
Low: -0.23 °F/decade
Rain: -0.016 in/decade
50-Year Trend
High: +0.02 °F/decade
Low: +0.49 °F/decade
Rain: -0.026 in/decade
All-Time Trend
High: +0.03 °F/decade
Low: +0.40 °F/decade
Rain: -0.026 in/decade
Percentage Above-Average Days
Last 12 Months: 36.5%
This Year: 46.3%
Precipitation Concentration Index (PCI) ℹ️
Last 12 Months: 10.1
Historical Average: 11.9
Percentile Rank of Last 12 Months ℹ️
High: 75th percentile
Low: 33rd percentile
Rain: 38th percentile
Change in Variance ℹ️
High: +7.8%
Low: -25.0%
Intraday: -7.3%
Data Coverage
57.3%
First Year of Data
1943
Station Location
Historical Weather Records
| Max High | Avg High | Min High | Max Avg | Avg Avg | Min Avg | Max Low | Avg Low | Min Low | Max Precipitation | Avg Precipitation | Max Snow | Avg Snow | |
|---|---|---|---|---|---|---|---|---|---|---|---|---|---|
| Record | 102.20 °F | — | 78.80 °F | 91.04 °F | — | 74.30 °F | 86.22 °F | — | 66.20 °F | 7.02 in | — | — | — |
| January | 102.20 °F | 85.08 °F | 79.90 °F | 89.24 °F | 82.80 °F | 76.64 °F | 85.87 °F | 80.89 °F | 66.20 °F | 7.02 in | 0.36 in | — | — |
| February | 102.20 °F | 84.75 °F | 79.56 °F | 88.88 °F | 82.72 °F | 76.82 °F | 85.24 °F | 80.90 °F | 66.20 °F | 5.60 in | 0.34 in | — | — |
| March | 93.20 °F | 84.70 °F | 78.80 °F | 88.34 °F | 82.53 °F | 77.36 °F | 85.24 °F | 80.67 °F | 68.36 °F | 6.22 in | 0.30 in | — | — |
| April | 94.82 °F | 84.99 °F | 80.26 °F | 89.24 °F | 82.76 °F | 74.30 °F | 85.21 °F | 80.74 °F | 66.20 °F | 3.91 in | 0.26 in | — | — |
| May | 92.48 °F | 85.19 °F | 80.69 °F | 91.04 °F | 83.08 °F | 74.66 °F | 86.09 °F | 81.22 °F | 69.62 °F | 4.25 in | 0.22 in | — | — |
| June | 96.80 °F | 85.08 °F | 80.33 °F | 88.34 °F | 83.05 °F | 78.08 °F | 85.41 °F | 81.05 °F | 69.44 °F | 5.12 in | 0.22 in | — | — |
| July | 102.20 °F | 84.62 °F | 80.06 °F | 88.52 °F | 82.73 °F | 76.64 °F | 84.90 °F | 80.98 °F | 66.20 °F | 3.74 in | 0.20 in | — | — |
| August | 91.94 °F | 84.67 °F | 79.34 °F | 87.26 °F | 82.67 °F | 76.64 °F | 85.35 °F | 80.74 °F | 69.08 °F | 3.54 in | 0.20 in | — | — |
| September | 96.08 °F | 85.00 °F | 80.08 °F | 88.34 °F | 82.97 °F | 77.90 °F | 85.10 °F | 80.96 °F | 71.60 °F | 4.09 in | 0.16 in | — | — |
| October | 94.10 °F | 85.33 °F | 80.49 °F | 89.60 °F | 83.03 °F | 76.82 °F | 85.59 °F | 80.80 °F | 71.60 °F | 5.17 in | 0.19 in | — | — |
| November | 102.20 °F | 85.50 °F | 79.95 °F | 89.24 °F | 83.22 °F | 78.44 °F | 85.53 °F | 81.12 °F | 72.50 °F | 4.38 in | 0.19 in | — | — |
| December | 102.20 °F | 85.37 °F | 80.49 °F | 87.12 °F | 83.06 °F | 76.82 °F | 86.22 °F | 81.08 °F | 66.20 °F | 6.23 in | 0.34 in | — | — |
Data Visualisations
Remove WatermarksCurrent Year Climate Trends vs Historical


Max Temperature this Year | 1 of 6
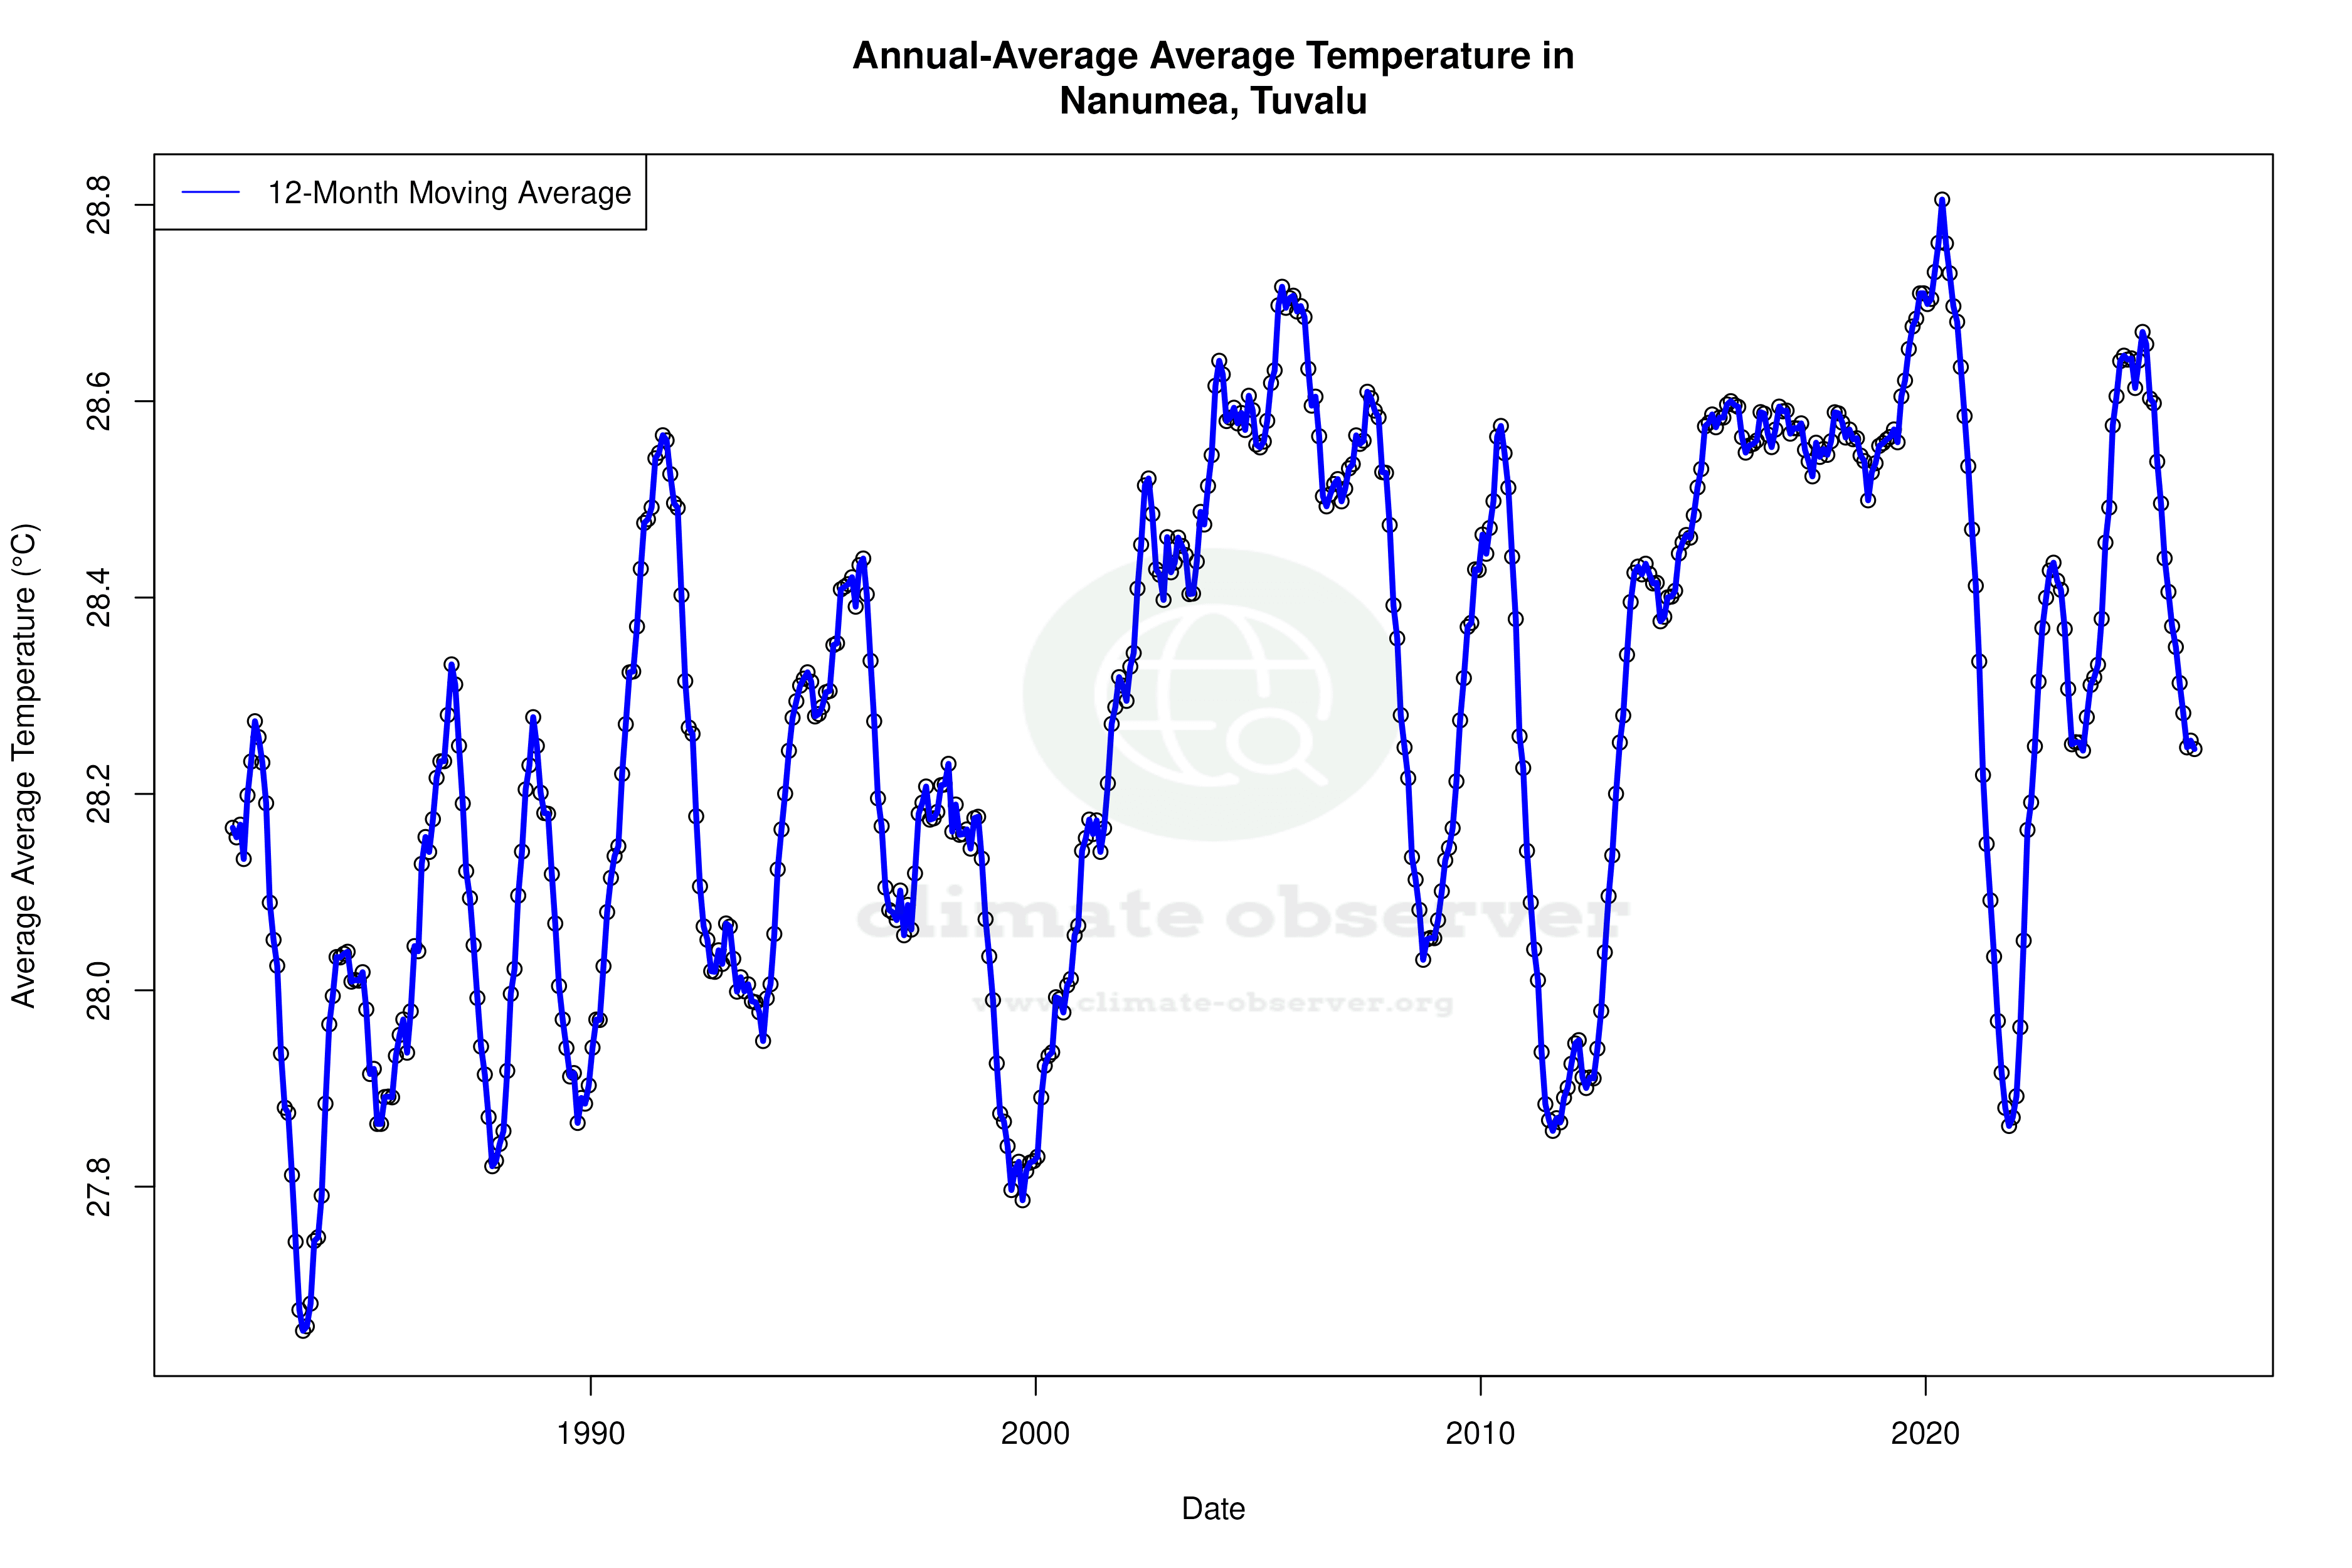
Climate 12-Month Moving Averages
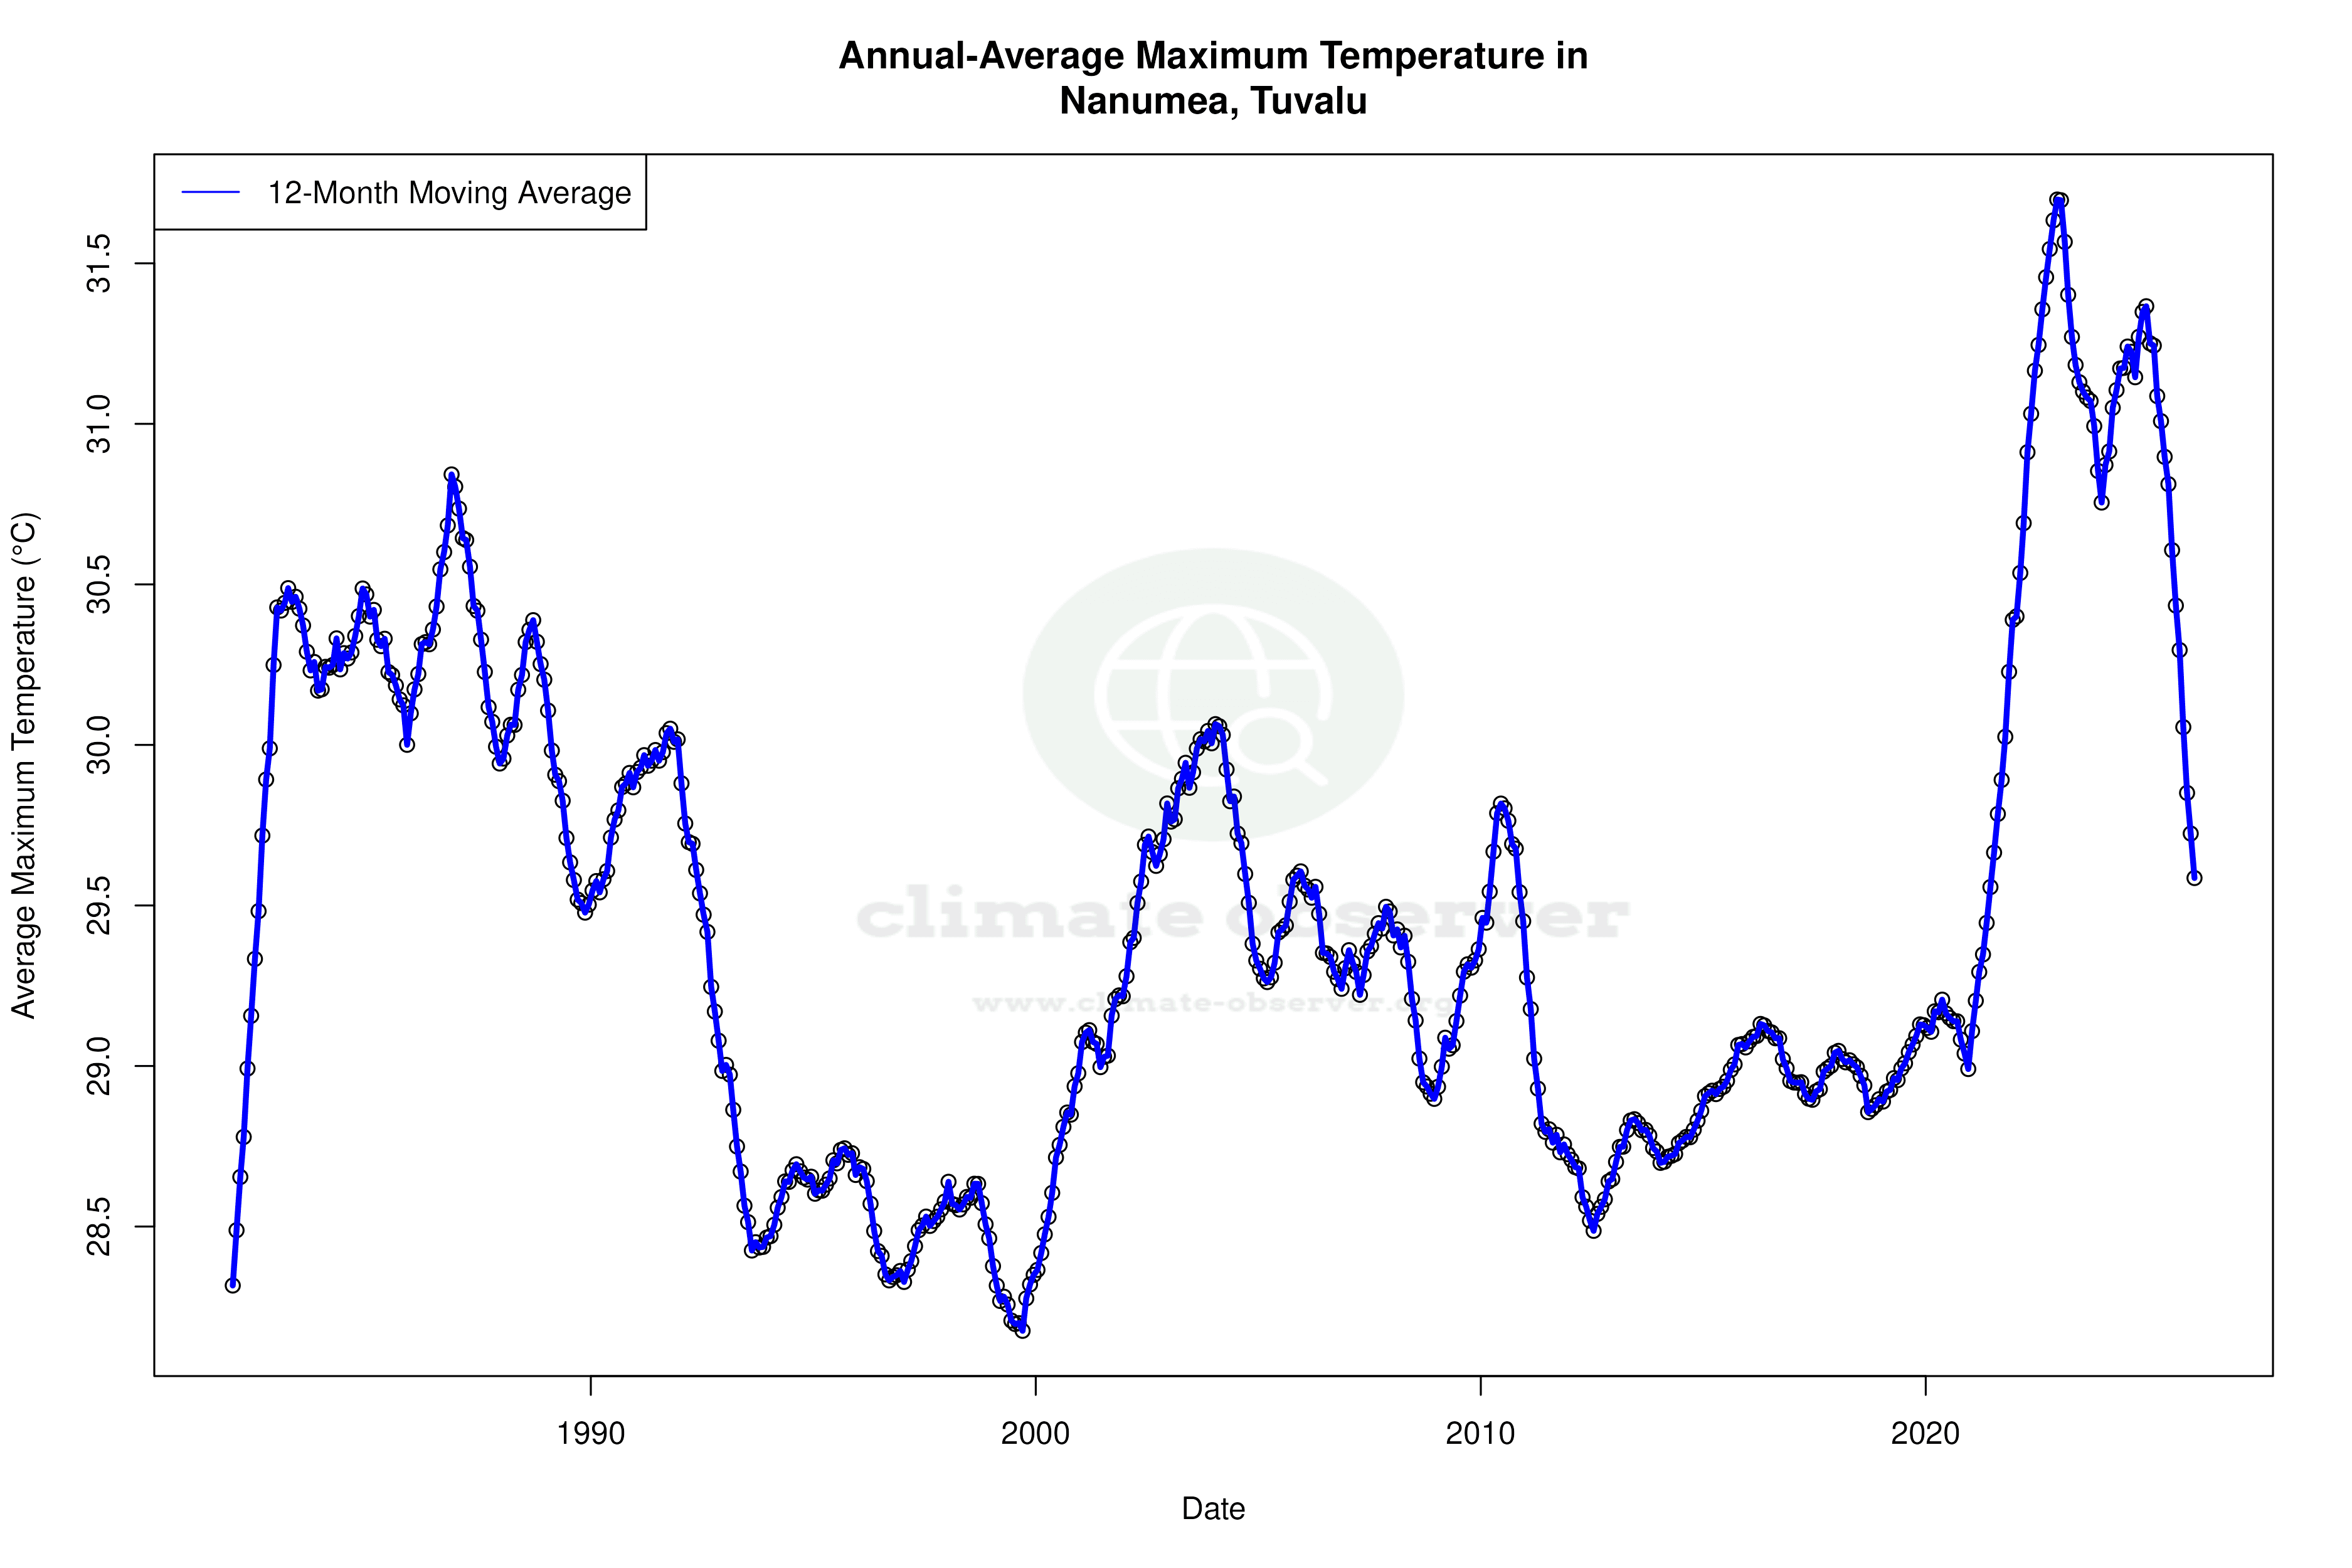


Max Temperature 12-Month MA | 1 of 6
Daily Data Points and Averages Throughout the Year


Average Max Temperature Throughout Year | 1 of 5
