Climate for Station: Chardzhev, Chardzhou (Türkmenabat), Turkmenistan
Loading live weather...
Climate Analysis & Overview
Chardzhev, located in the heart of Turkmenistan, is experiencing a warming trend with both highs and lows increasing over time. While the 10-year trends show a more pronounced warming, the all-time trends indicate a steady rise. Precipitation is becoming slightly more evenly distributed, suggesting subtle shifts in local weather patterns.
Rising Temperatures in Chardzhev
Chardzhev, situated at 39.0831°N, 63.6°E in Turkmenistan, falls under the Köppen climate classification of BWh, indicating a hot desert climate. This region is characterised by extreme temperatures due to its arid conditions and lack of significant water bodies or mountain ranges that could moderate the climate. Over the past decade, the area has seen a notable warming trend, with high temperatures increasing by 1.50°C (2.70°F) and low temperatures by 1.48°C (2.67°F). These figures highlight a significant shift towards warmer conditions in recent years.
Historical Temperature Trends
When considering the all-time trends, Chardzhev has experienced a more gradual warming. The all-time high temperatures have risen by 0.17°C (0.31°F), while lows have increased by 0.14°C (0.25°F). This long-term data suggests a consistent, albeit slower, warming trend compared to the recent decade. The record temperatures for the region further illustrate the extremes, with a maximum recorded temperature of 46.4°C (115.5°F) and a minimum of -25.4°C (-13.7°F), showcasing the vast thermal range typical of desert climates.
Precipitation Patterns and PCI
The Precipitation Concentration Index (PCI) for Chardzhev has shown a slight decrease from a baseline of 22.4 to a current value of 21.7. The PCI is a measure of how precipitation is distributed over time; a decrease suggests that rainfall is becoming slightly more evenly spread throughout the year. Despite this marginal change, the PCI remains above 20, indicating that precipitation events are still relatively concentrated, a common characteristic of desert climates where rain often falls in intense, short bursts.
Implications for Regional Climate Goals
Turkmenistan has been actively working towards adapting to climate change impacts, focusing on sustainable water management and desertification mitigation. The warming trends observed in Chardzhev align with broader regional patterns, posing challenges for agriculture and water resources. The slight shift towards more evenly distributed precipitation could offer some relief, potentially aiding in water conservation efforts. However, the persistent high PCI underscores the need for continued adaptation strategies to manage the intense and sporadic rainfall events that define the region's climate.
Station Statistics
10-Year Trend
High: +3.56 °F/decade
Low: +3.37 °F/decade
Rain: -0.001 in/decade
25-Year Trend
High: +1.01 °F/decade
Low: +1.80 °F/decade
Rain: +0.001 in/decade
50-Year Trend
High: +0.65 °F/decade
Low: +0.78 °F/decade
Rain: +0.000 in/decade
All-Time Trend
High: +0.27 °F/decade
Low: +0.22 °F/decade
Rain: +0.000 in/decade
Percentage Above-Average Days
Last 12 Months: 61.0%
This Year: 73.2%
Precipitation Concentration Index (PCI) ℹ️
Last 12 Months: 18.6
Historical Average: 22.4
Percentile Rank of Last 12 Months ℹ️
High: 94th percentile
Low: 96th percentile
Rain: 68th percentile
Change in Variance ℹ️
High: +1.4%
Low: +12.6%
Intraday: -14.1%
Data Coverage
87.5%
First Year of Data
1894
Station Location
Historical Weather Records
| Max High | Avg High | Min High | Max Avg | Avg Avg | Min Avg | Max Low | Avg Low | Min Low | Max Precipitation | Avg Precipitation | Max Snow | Avg Snow | |
|---|---|---|---|---|---|---|---|---|---|---|---|---|---|
| Record | 115.52 °F | — | 4.64 °F | 103.46 °F | — | -3.46 °F | 87.44 °F | — | -13.72 °F | 2.76 in | — | — | — |
| January | 75.20 °F | 44.74 °F | 5.36 °F | 66.02 °F | 34.50 °F | -1.30 °F | 55.40 °F | 26.58 °F | -13.72 °F | 1.23 in | 0.02 in | — | — |
| February | 83.12 °F | 50.70 °F | 7.52 °F | 68.36 °F | 39.57 °F | -0.04 °F | 60.80 °F | 30.56 °F | -7.96 °F | 1.22 in | 0.03 in | — | — |
| March | 96.62 °F | 61.93 °F | 23.90 °F | 83.12 °F | 49.70 °F | 14.90 °F | 68.90 °F | 39.26 °F | 2.66 °F | 2.76 in | 0.04 in | — | — |
| April | 104.54 °F | 76.33 °F | 41.36 °F | 88.88 °F | 63.37 °F | 31.82 °F | 73.58 °F | 51.24 °F | 23.72 °F | 2.48 in | 0.03 in | — | — |
| May | 109.22 °F | 87.36 °F | 53.24 °F | 96.44 °F | 74.49 °F | 43.70 °F | 80.60 °F | 60.82 °F | 33.44 °F | 2.64 in | 0.01 in | — | — |
| June | 115.52 °F | 95.27 °F | 67.10 °F | 100.94 °F | 82.31 °F | 56.84 °F | 84.06 °F | 67.65 °F | 48.92 °F | 1.41 in | 0.00 in | — | — |
| July | 115.16 °F | 97.96 °F | 78.26 °F | 103.46 °F | 85.19 °F | 67.46 °F | 86.90 °F | 71.00 °F | 52.16 °F | 1.81 in | 0.00 in | — | — |
| August | 114.51 °F | 94.65 °F | 72.86 °F | 96.08 °F | 80.89 °F | 64.58 °F | 87.44 °F | 66.54 °F | 48.38 °F | 0.07 in | 0.00 in | — | — |
| September | 106.03 °F | 85.81 °F | 51.80 °F | 86.90 °F | 70.48 °F | 41.72 °F | 74.03 °F | 55.96 °F | 32.00 °F | 0.14 in | 0.00 in | — | — |
| October | 99.14 °F | 73.06 °F | 37.40 °F | 78.62 °F | 57.59 °F | 29.48 °F | 66.96 °F | 44.42 °F | 14.90 °F | 0.68 in | 0.00 in | — | — |
| November | 113.00 °F | 58.99 °F | 22.10 °F | 74.66 °F | 45.90 °F | 5.90 °F | 65.48 °F | 35.28 °F | -3.64 °F | 0.94 in | 0.01 in | — | — |
| December | 79.88 °F | 47.11 °F | 4.64 °F | 69.26 °F | 37.22 °F | -3.46 °F | 64.40 °F | 29.04 °F | -10.12 °F | 0.90 in | 0.02 in | — | — |
Data Visualisations
Remove WatermarksCurrent Year Climate Trends vs Historical


Max Temperature this Year | 1 of 6
Climate 12-Month Moving Averages


Max Temperature 12-Month MA | 1 of 6
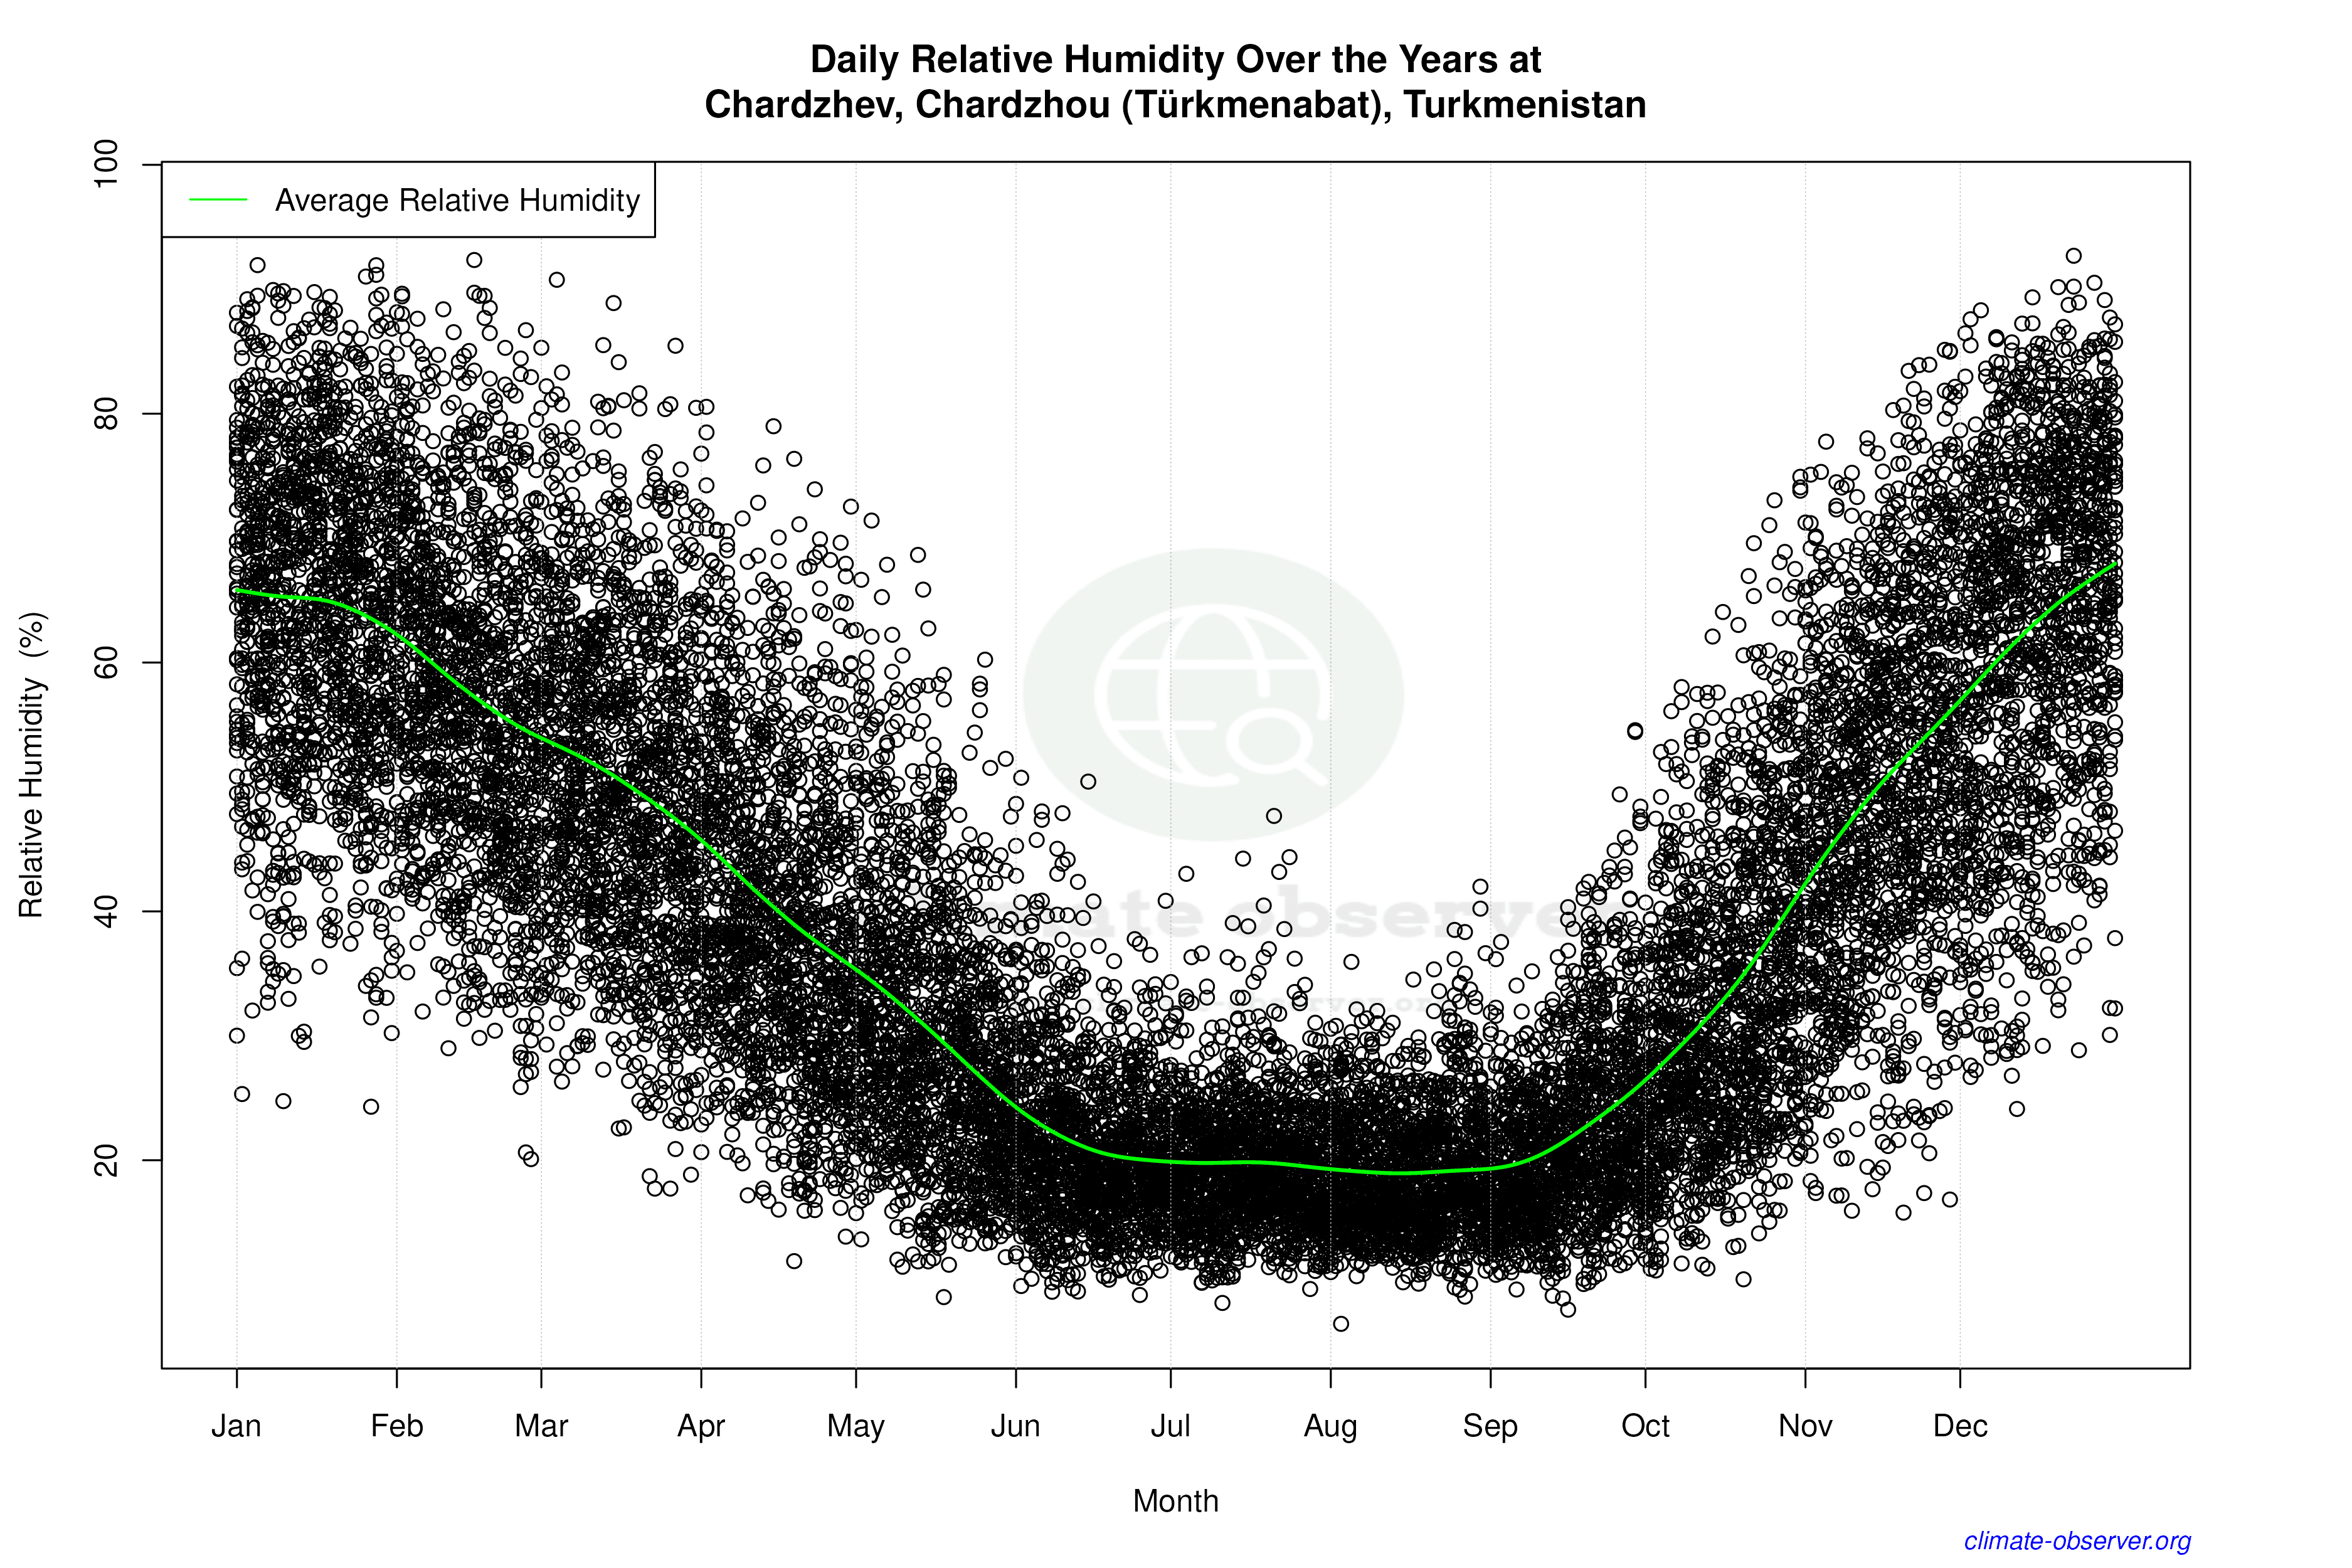
Daily Data Points and Averages Throughout the Year


Average Max Temperature Throughout Year | 1 of 5
