Climate for Station: Mwanza, Tanzania
Loading live weather...
Climate Analysis & Overview
Mwanza, located on the southern shores of Lake Victoria, exhibits a complex climate narrative. While all-time temperature trends indicate a slight warming for highs, recent data shows a cooling trend for both highs and lows over the past decade. Meanwhile, the region's precipitation is becoming more evenly distributed, aligning with Tanzania's climate adaptation goals.
A Tale of Two Temperature Trends
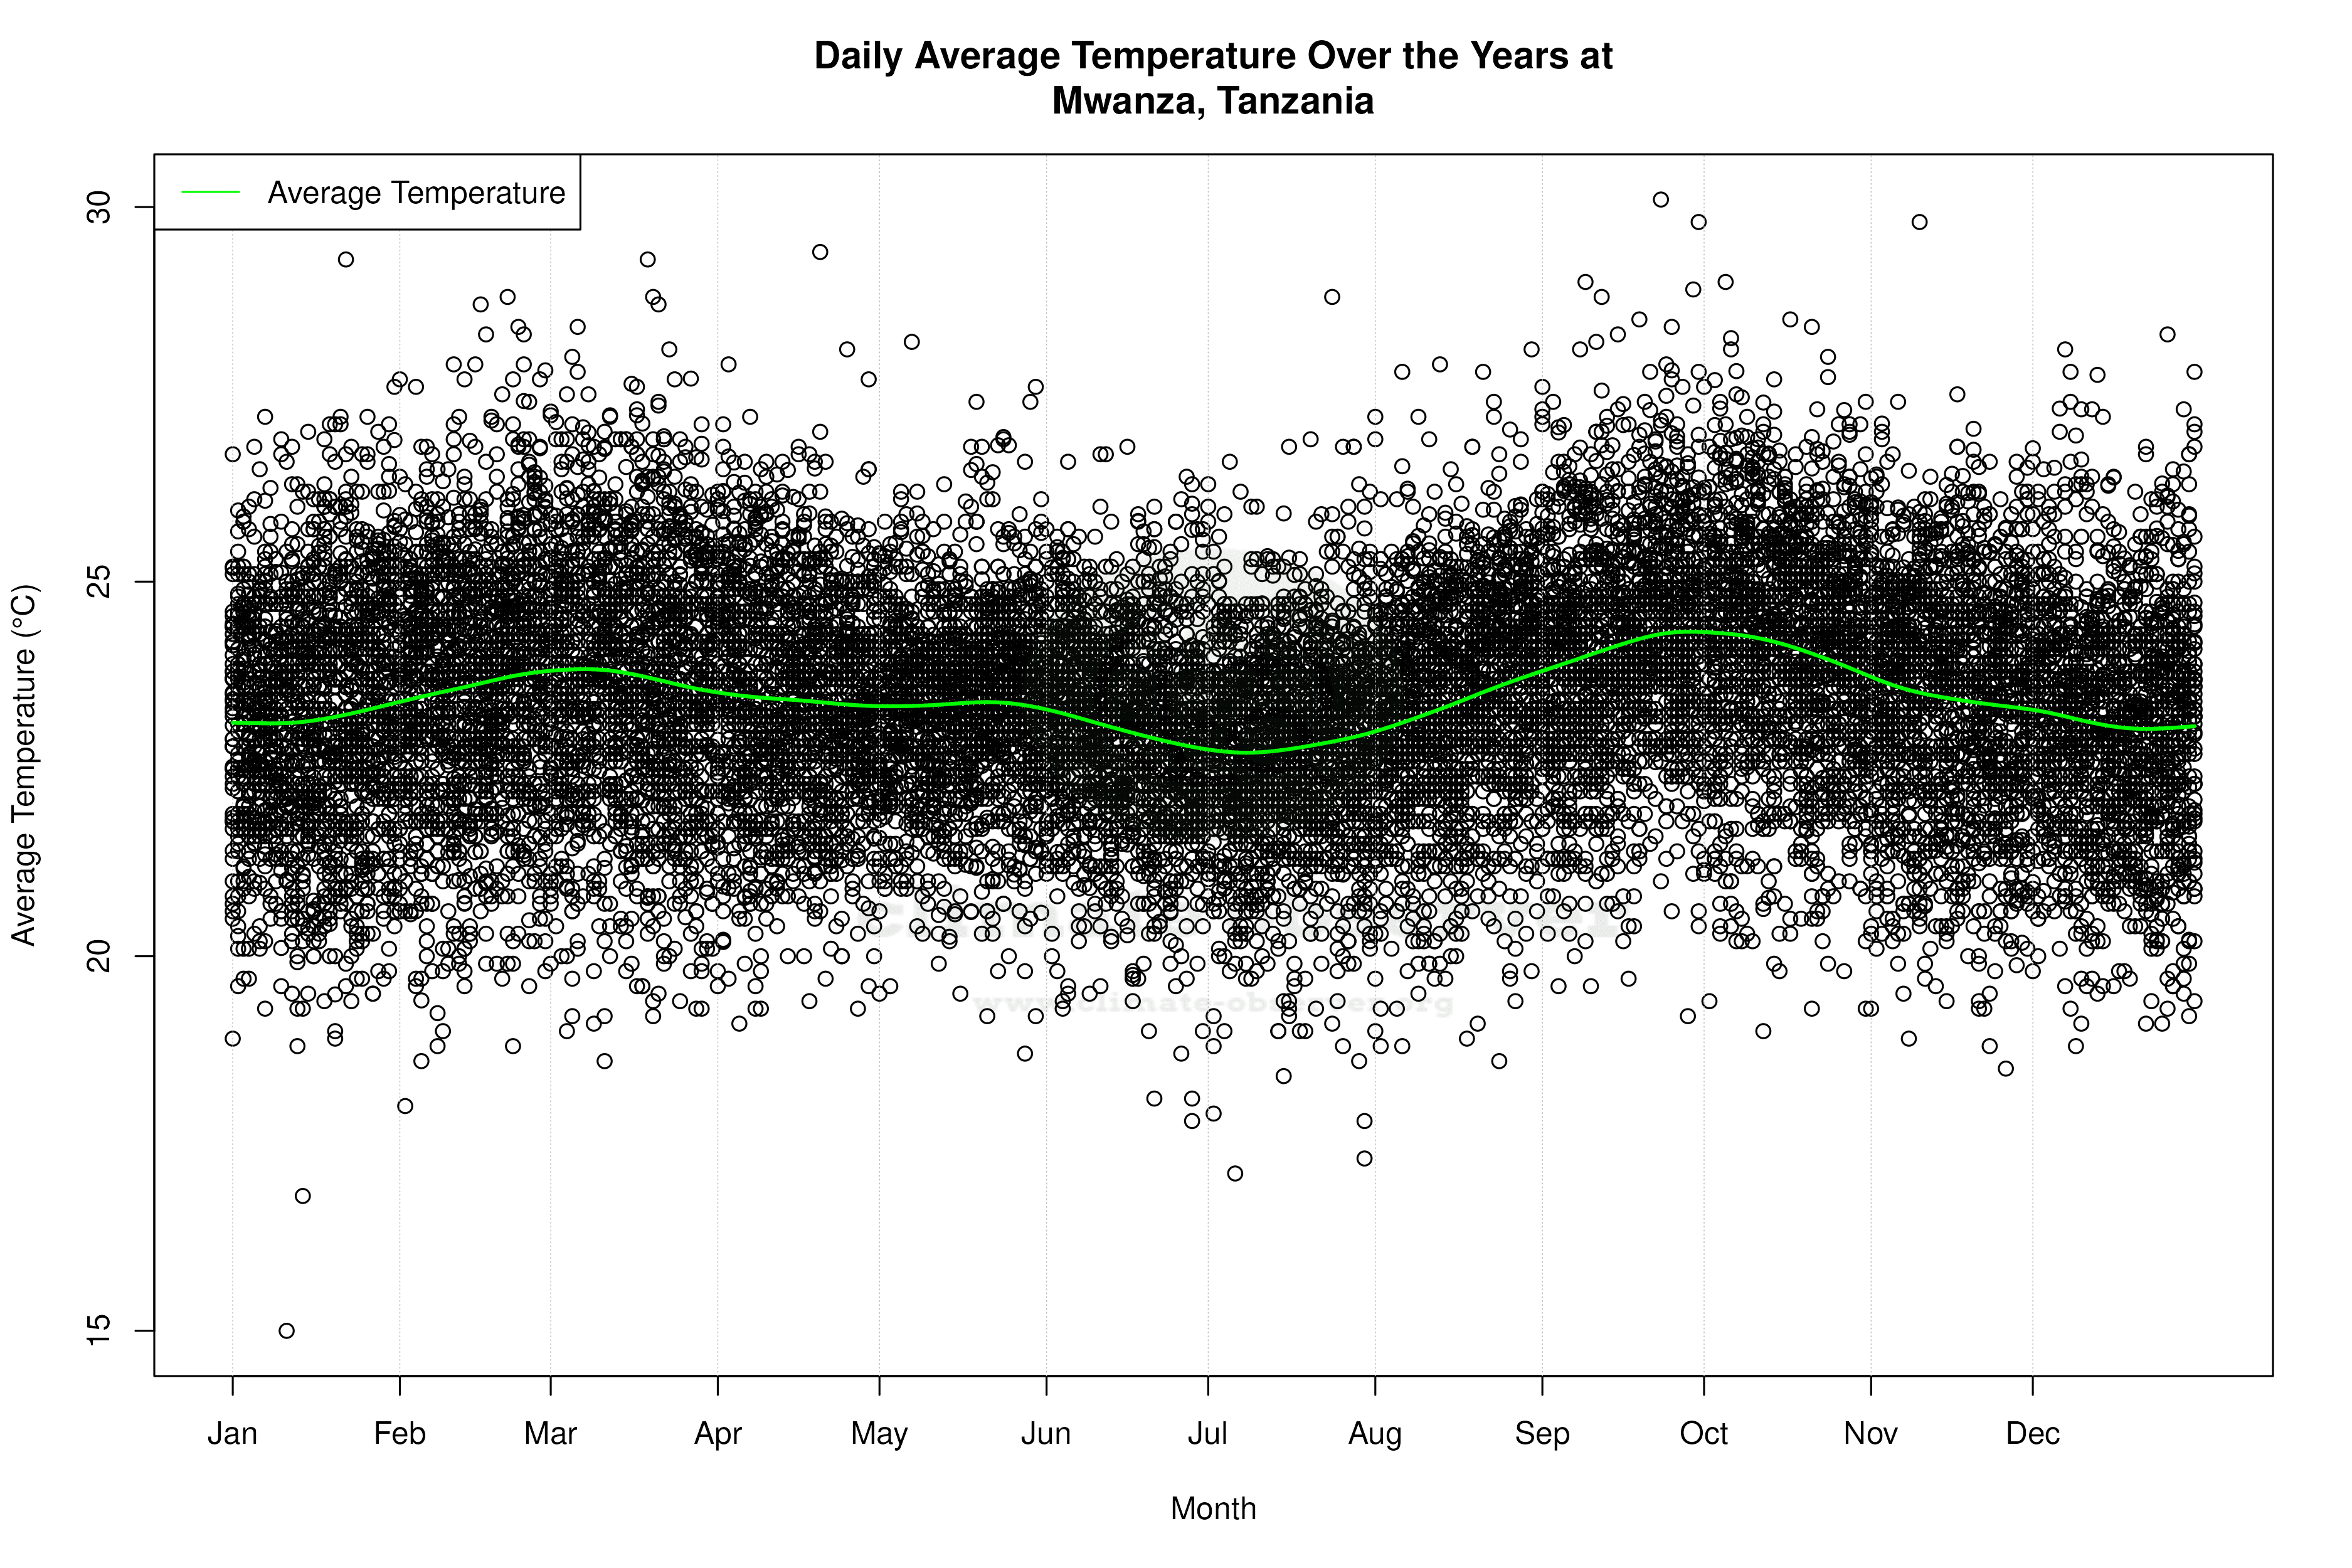
Mwanza, situated in the Lake Zone of Tanzania, is characterised by a tropical savanna climate (Köppen classification Aw). This region is influenced by its proximity to Lake Victoria, which moderates temperatures and affects precipitation patterns. Over the long term, the all-time temperature data reveals a subtle warming trend in high temperatures, with an increase of 0.05°C (0.09°F). In contrast, low temperatures have experienced a slight cooling of 0.09°C (0.16°F). However, examining the past decade, a different picture emerges. High temperatures have cooled by 0.03°C (0.05°F), while low temperatures show a more pronounced cooling of 0.65°C (1.17°F). This recent cooling trend may reflect short-term climatic variability or localised influences such as changes in land use or vegetation cover.
Precipitation Patterns: A Shift Towards Even Distribution
The Precipitation Concentration Index (PCI) is a measure of how precipitation is distributed over time. For Mwanza, the PCI has decreased from a baseline of 13.8 to a current value of 10.4, indicating a more even distribution of rainfall events. This shift suggests that precipitation is now less concentrated in heavy downpours and more evenly spread throughout the year. Such changes are favourable for agriculture and water management, aligning with Tanzania's regional climate adaptation strategies aimed at enhancing resilience to climate variability.
Temperature Extremes: Historical Context
The historical temperature records for Mwanza highlight the region's climatic extremes. The highest recorded temperature is 37.7°C (99.9°F), while the lowest is 9.7°C (49.5°F). These extremes underscore the variability inherent in Mwanza's climate, influenced by both its equatorial location and the moderating effects of Lake Victoria. Understanding these extremes is crucial for planning and resilience-building in sectors such as agriculture and infrastructure.
Regional Climate Goals and Recent Developments
Mwanza's climate data must be viewed within the broader context of Tanzania's efforts to address climate change. The recent cooling trend in temperatures and the more even distribution of precipitation align with national goals to mitigate the impacts of climate change and improve agricultural productivity. Recent weather events, such as unseasonal rains or droughts, further underscore the importance of ongoing monitoring and adaptation efforts. These developments highlight the dynamic nature of Mwanza's climate and the need for continued research and policy support.
Station Statistics
10-Year Trend
High: -0.47 °F/decade
Low: -0.97 °F/decade
Rain: +0.047 in/decade
25-Year Trend
High: +0.01 °F/decade
Low: -0.11 °F/decade
Rain: +0.023 in/decade
50-Year Trend
High: +0.08 °F/decade
Low: -0.17 °F/decade
Rain: +0.008 in/decade
All-Time Trend
High: +0.08 °F/decade
Low: -0.17 °F/decade
Rain: +0.004 in/decade
Percentage Above-Average Days
Last 12 Months: 35.1%
This Year: 35.8%
Precipitation Concentration Index (PCI) ℹ️
Last 12 Months: 11.3
Historical Average: 13.7
Percentile Rank of Last 12 Months ℹ️
High: 24th percentile
Low: 18th percentile
Rain: 87th percentile
Change in Variance ℹ️
High: -9.6%
Low: -34.9%
Intraday: -15.7%
Data Coverage
73.2%
First Year of Data
1950
Station Location
Historical Weather Records
| Max High | Avg High | Min High | Max Avg | Avg Avg | Min Avg | Max Low | Avg Low | Min Low | Max Precipitation | Avg Precipitation | Max Snow | Avg Snow | |
|---|---|---|---|---|---|---|---|---|---|---|---|---|---|
| Record | 99.86 °F | — | 68.54 °F | 86.18 °F | — | 59.00 °F | 76.87 °F | — | 49.46 °F | 6.25 in | — | — | — |
| January | 92.30 °F | 81.18 °F | 68.54 °F | 84.74 °F | 73.75 °F | 59.00 °F | 74.77 °F | 66.62 °F | 57.20 °F | 3.25 in | 0.12 in | — | — |
| February | 93.40 °F | 82.93 °F | 69.31 °F | 86.18 °F | 74.48 °F | 64.40 °F | 76.87 °F | 67.01 °F | 53.42 °F | 5.75 in | 0.14 in | — | — |
| March | 95.90 °F | 83.24 °F | 69.80 °F | 84.74 °F | 74.65 °F | 65.48 °F | 75.07 °F | 67.09 °F | 55.58 °F | 6.25 in | 0.19 in | — | — |
| April | 92.30 °F | 82.14 °F | 70.34 °F | 84.92 °F | 74.18 °F | 66.38 °F | 72.68 °F | 66.72 °F | 59.00 °F | 5.94 in | 0.23 in | — | — |
| May | 92.48 °F | 82.70 °F | 69.82 °F | 82.76 °F | 74.04 °F | 65.66 °F | 73.04 °F | 65.44 °F | 54.50 °F | 2.91 in | 0.10 in | — | — |
| June | 95.00 °F | 83.56 °F | 71.80 °F | 80.24 °F | 73.46 °F | 64.04 °F | 72.73 °F | 63.02 °F | 49.46 °F | 1.25 in | 0.02 in | — | — |
| July | 98.60 °F | 83.98 °F | 71.60 °F | 83.84 °F | 73.02 °F | 62.78 °F | 71.29 °F | 62.07 °F | 51.62 °F | 2.03 in | 0.01 in | — | — |
| August | 93.20 °F | 84.90 °F | 70.16 °F | 82.58 °F | 74.12 °F | 65.48 °F | 72.99 °F | 63.88 °F | 50.00 °F | 3.76 in | 0.03 in | — | — |
| September | 93.96 °F | 85.42 °F | 71.60 °F | 85.64 °F | 75.45 °F | 66.56 °F | 74.98 °F | 66.26 °F | 51.80 °F | 2.14 in | 0.06 in | — | — |
| October | 93.56 °F | 84.68 °F | 70.63 °F | 84.20 °F | 75.41 °F | 66.20 °F | 75.06 °F | 67.30 °F | 55.04 °F | 4.65 in | 0.13 in | — | — |
| November | 91.40 °F | 81.87 °F | 69.62 °F | 85.64 °F | 74.18 °F | 65.30 °F | 74.12 °F | 67.08 °F | 55.40 °F | 5.12 in | 0.21 in | — | — |
| December | 99.86 °F | 80.89 °F | 69.08 °F | 82.94 °F | 73.61 °F | 65.84 °F | 74.80 °F | 66.84 °F | 57.56 °F | 5.10 in | 0.20 in | — | — |
Data Visualisations
Remove WatermarksCurrent Year Climate Trends vs Historical


Max Temperature this Year | 1 of 6
Climate 12-Month Moving Averages


Max Temperature 12-Month MA | 1 of 6
Daily Data Points and Averages Throughout the Year


Average Max Temperature Throughout Year | 1 of 5
