Climate for Station: Heathrow, Greater London, United Kingdom
Loading live weather...
Climate Analysis & Overview
Heathrow's climate profile reveals a warming trend, with notable increases in both high and low temperatures over the past decade. The Precipitation Concentration Index shows a marginal decrease, indicating a more even distribution of rainfall. These changes are set against the backdrop of the UK's climate goals to reduce greenhouse gas emissions and adapt to a changing climate.
Warming Patterns in Heathrow
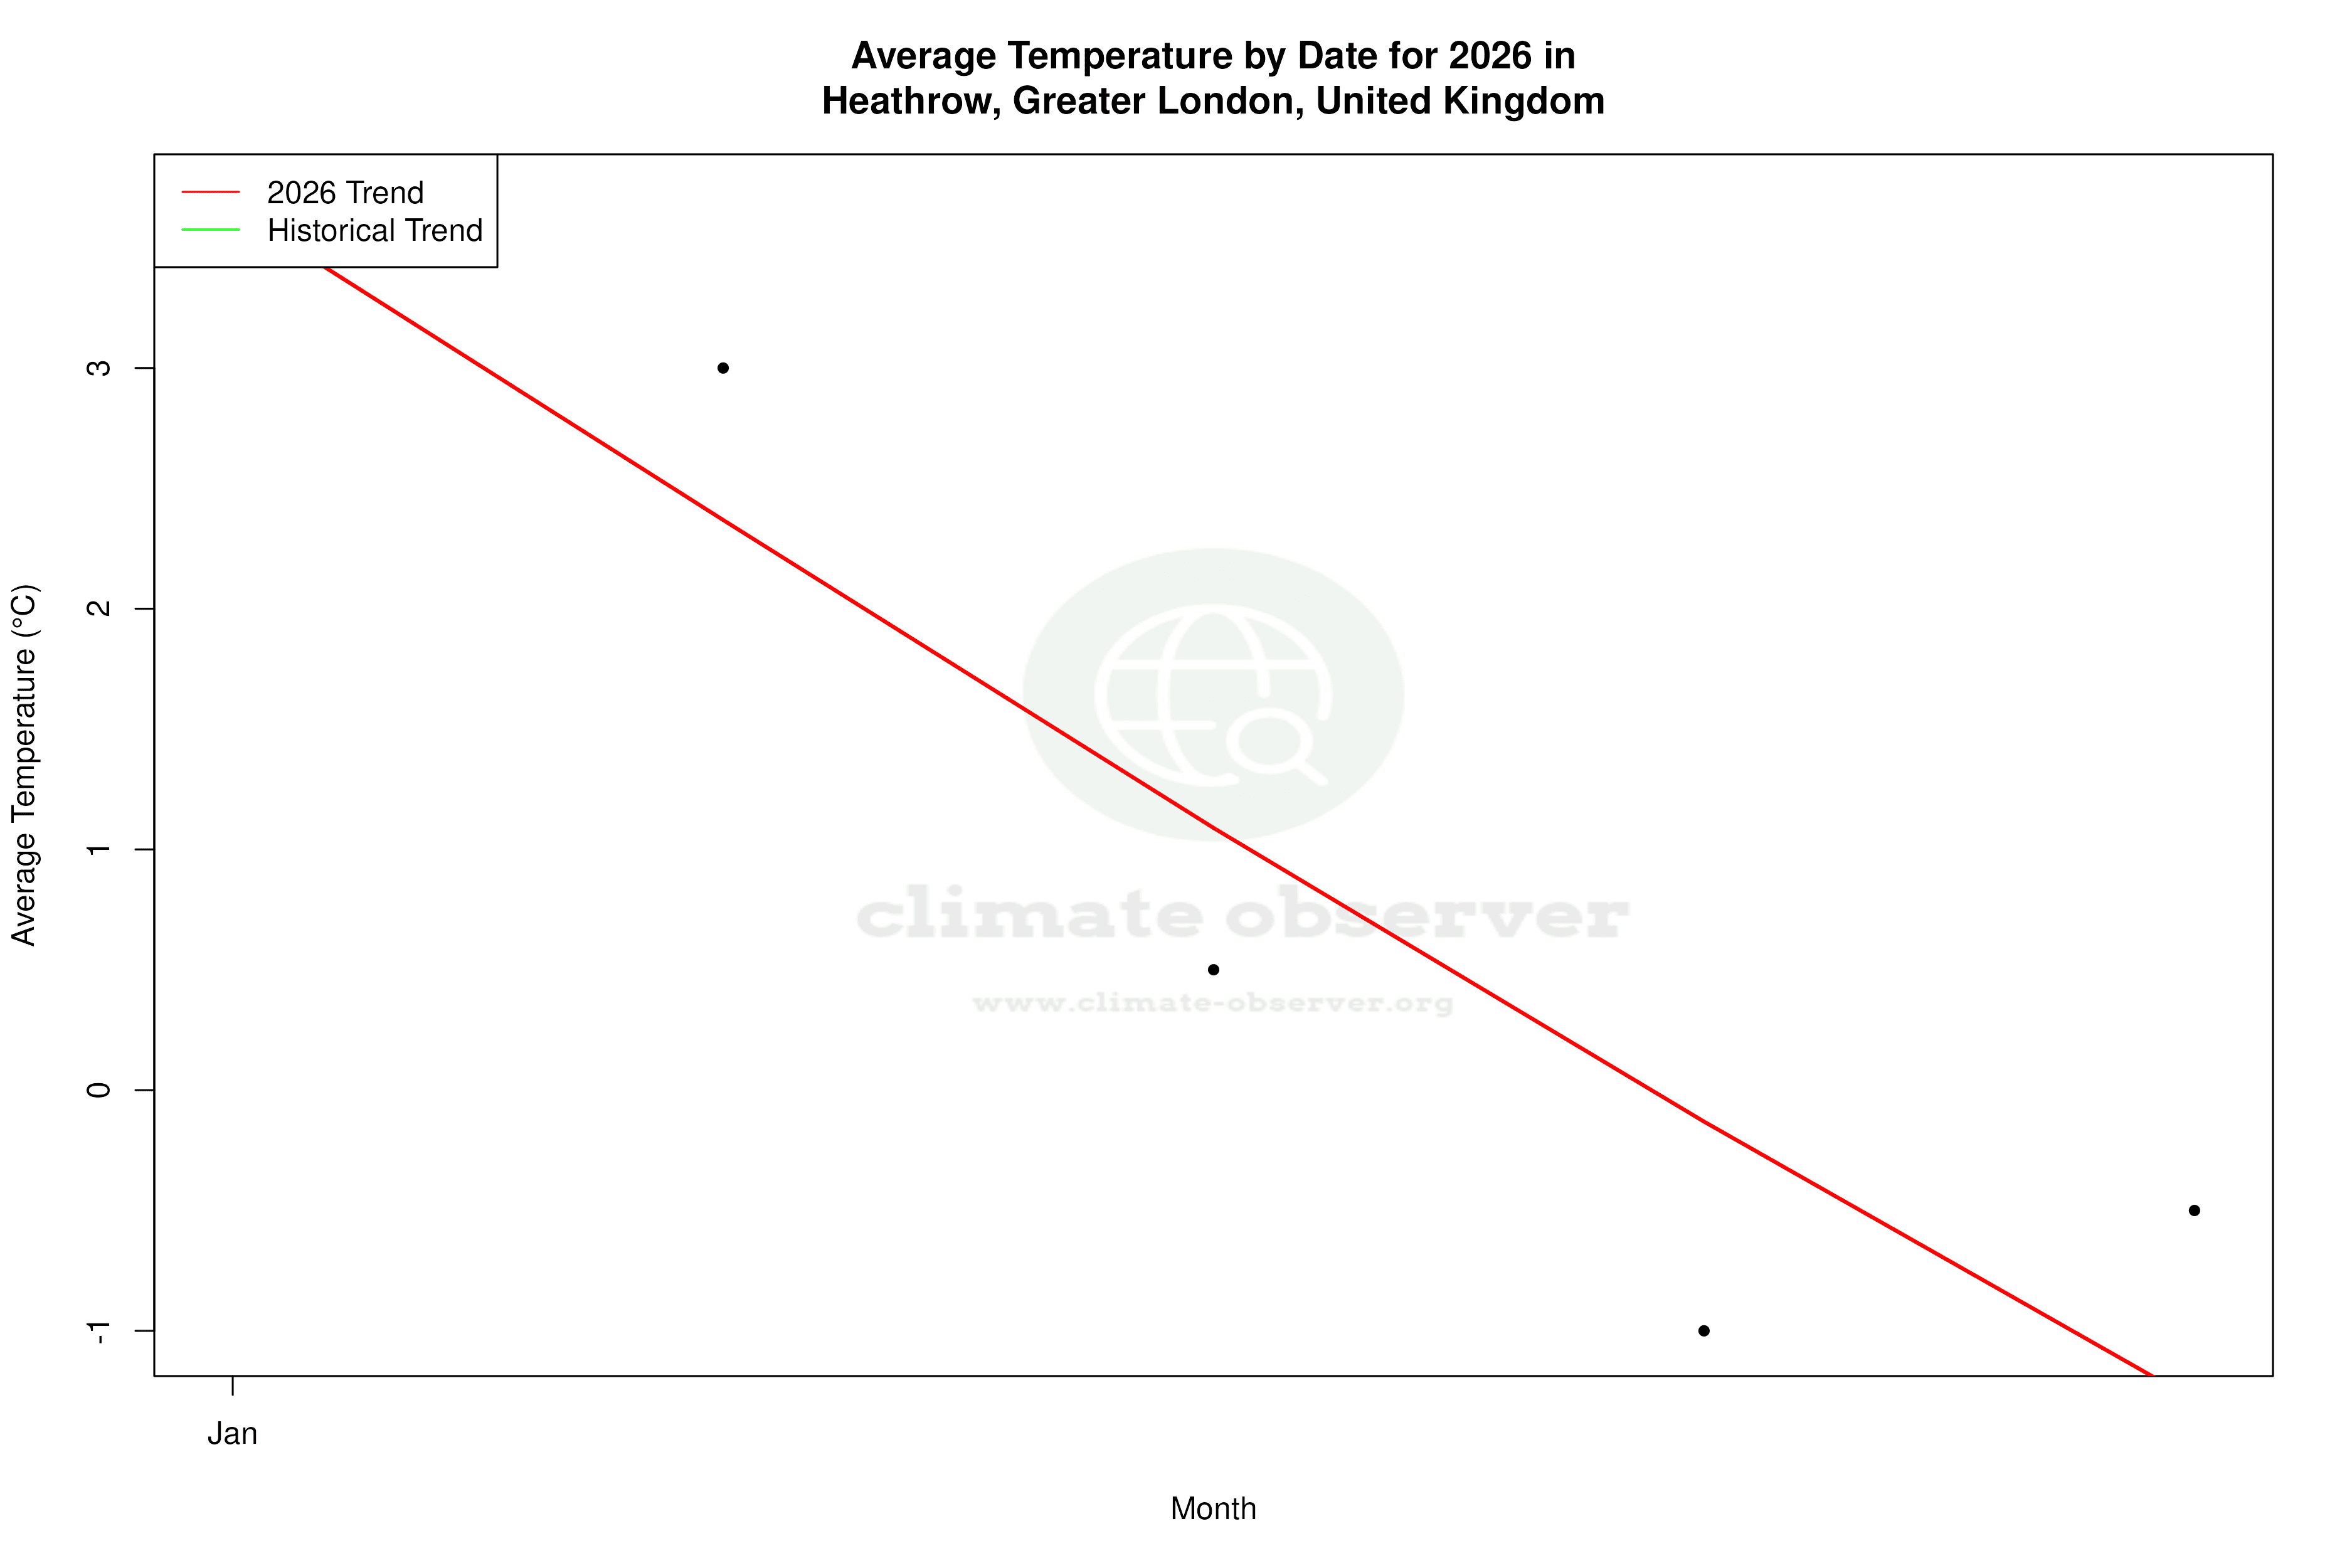
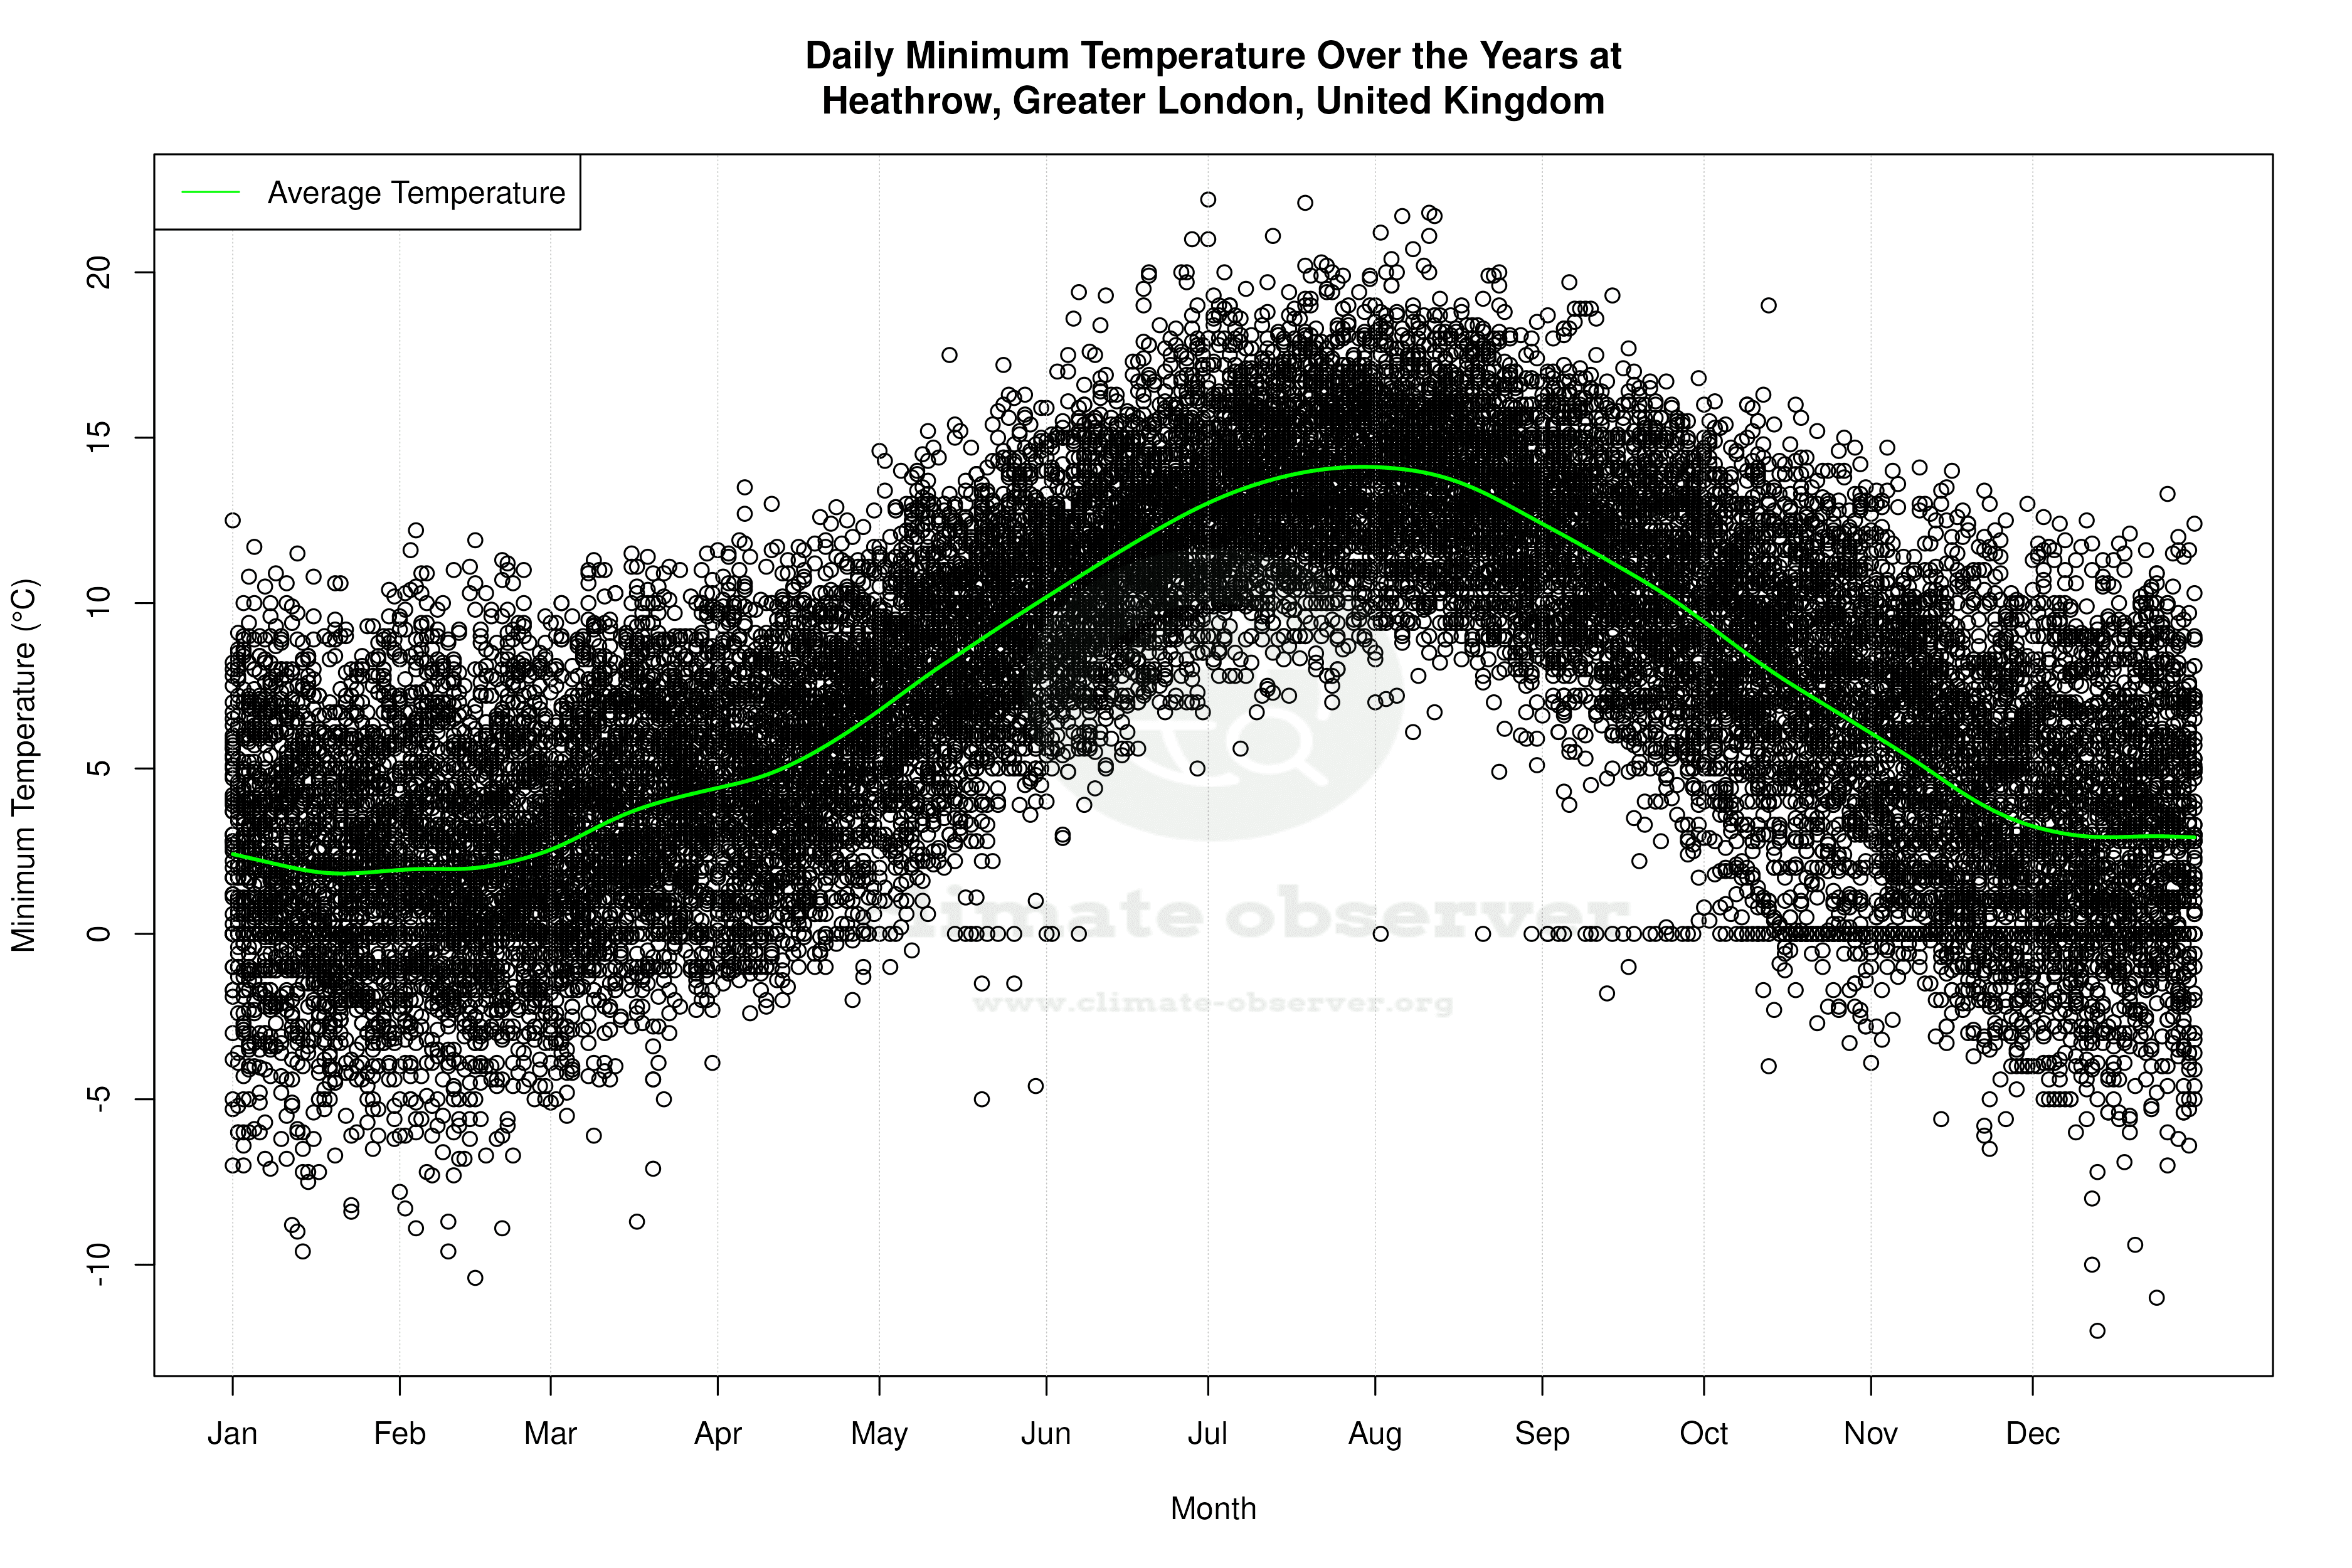
Heathrow, located in the London Borough of Hillingdon, experiences a temperate oceanic climate (Köppen classification Cfb), characterized by mild temperatures and moderate rainfall. Over the past decade, the data shows a significant warming trend, with high temperatures increasing by 1.46°C (2.63°F) and low temperatures by 0.36°C (0.65°F). This trend is more pronounced than the all-time warming, where highs have risen by 0.34°C (0.61°F) and lows by 0.24°C (0.43°F). Such changes are crucial as they align with broader regional efforts to mitigate climate impacts.
Temperature Extremes and Records
Heathrow has recorded a maximum temperature of 40.2°C (104.4°F) and a minimum of -12.0°C (10.4°F). These extremes highlight the variability and potential for significant weather events in the area. The increasing trend in high temperatures could lead to more frequent heatwaves, challenging local infrastructure and health systems.
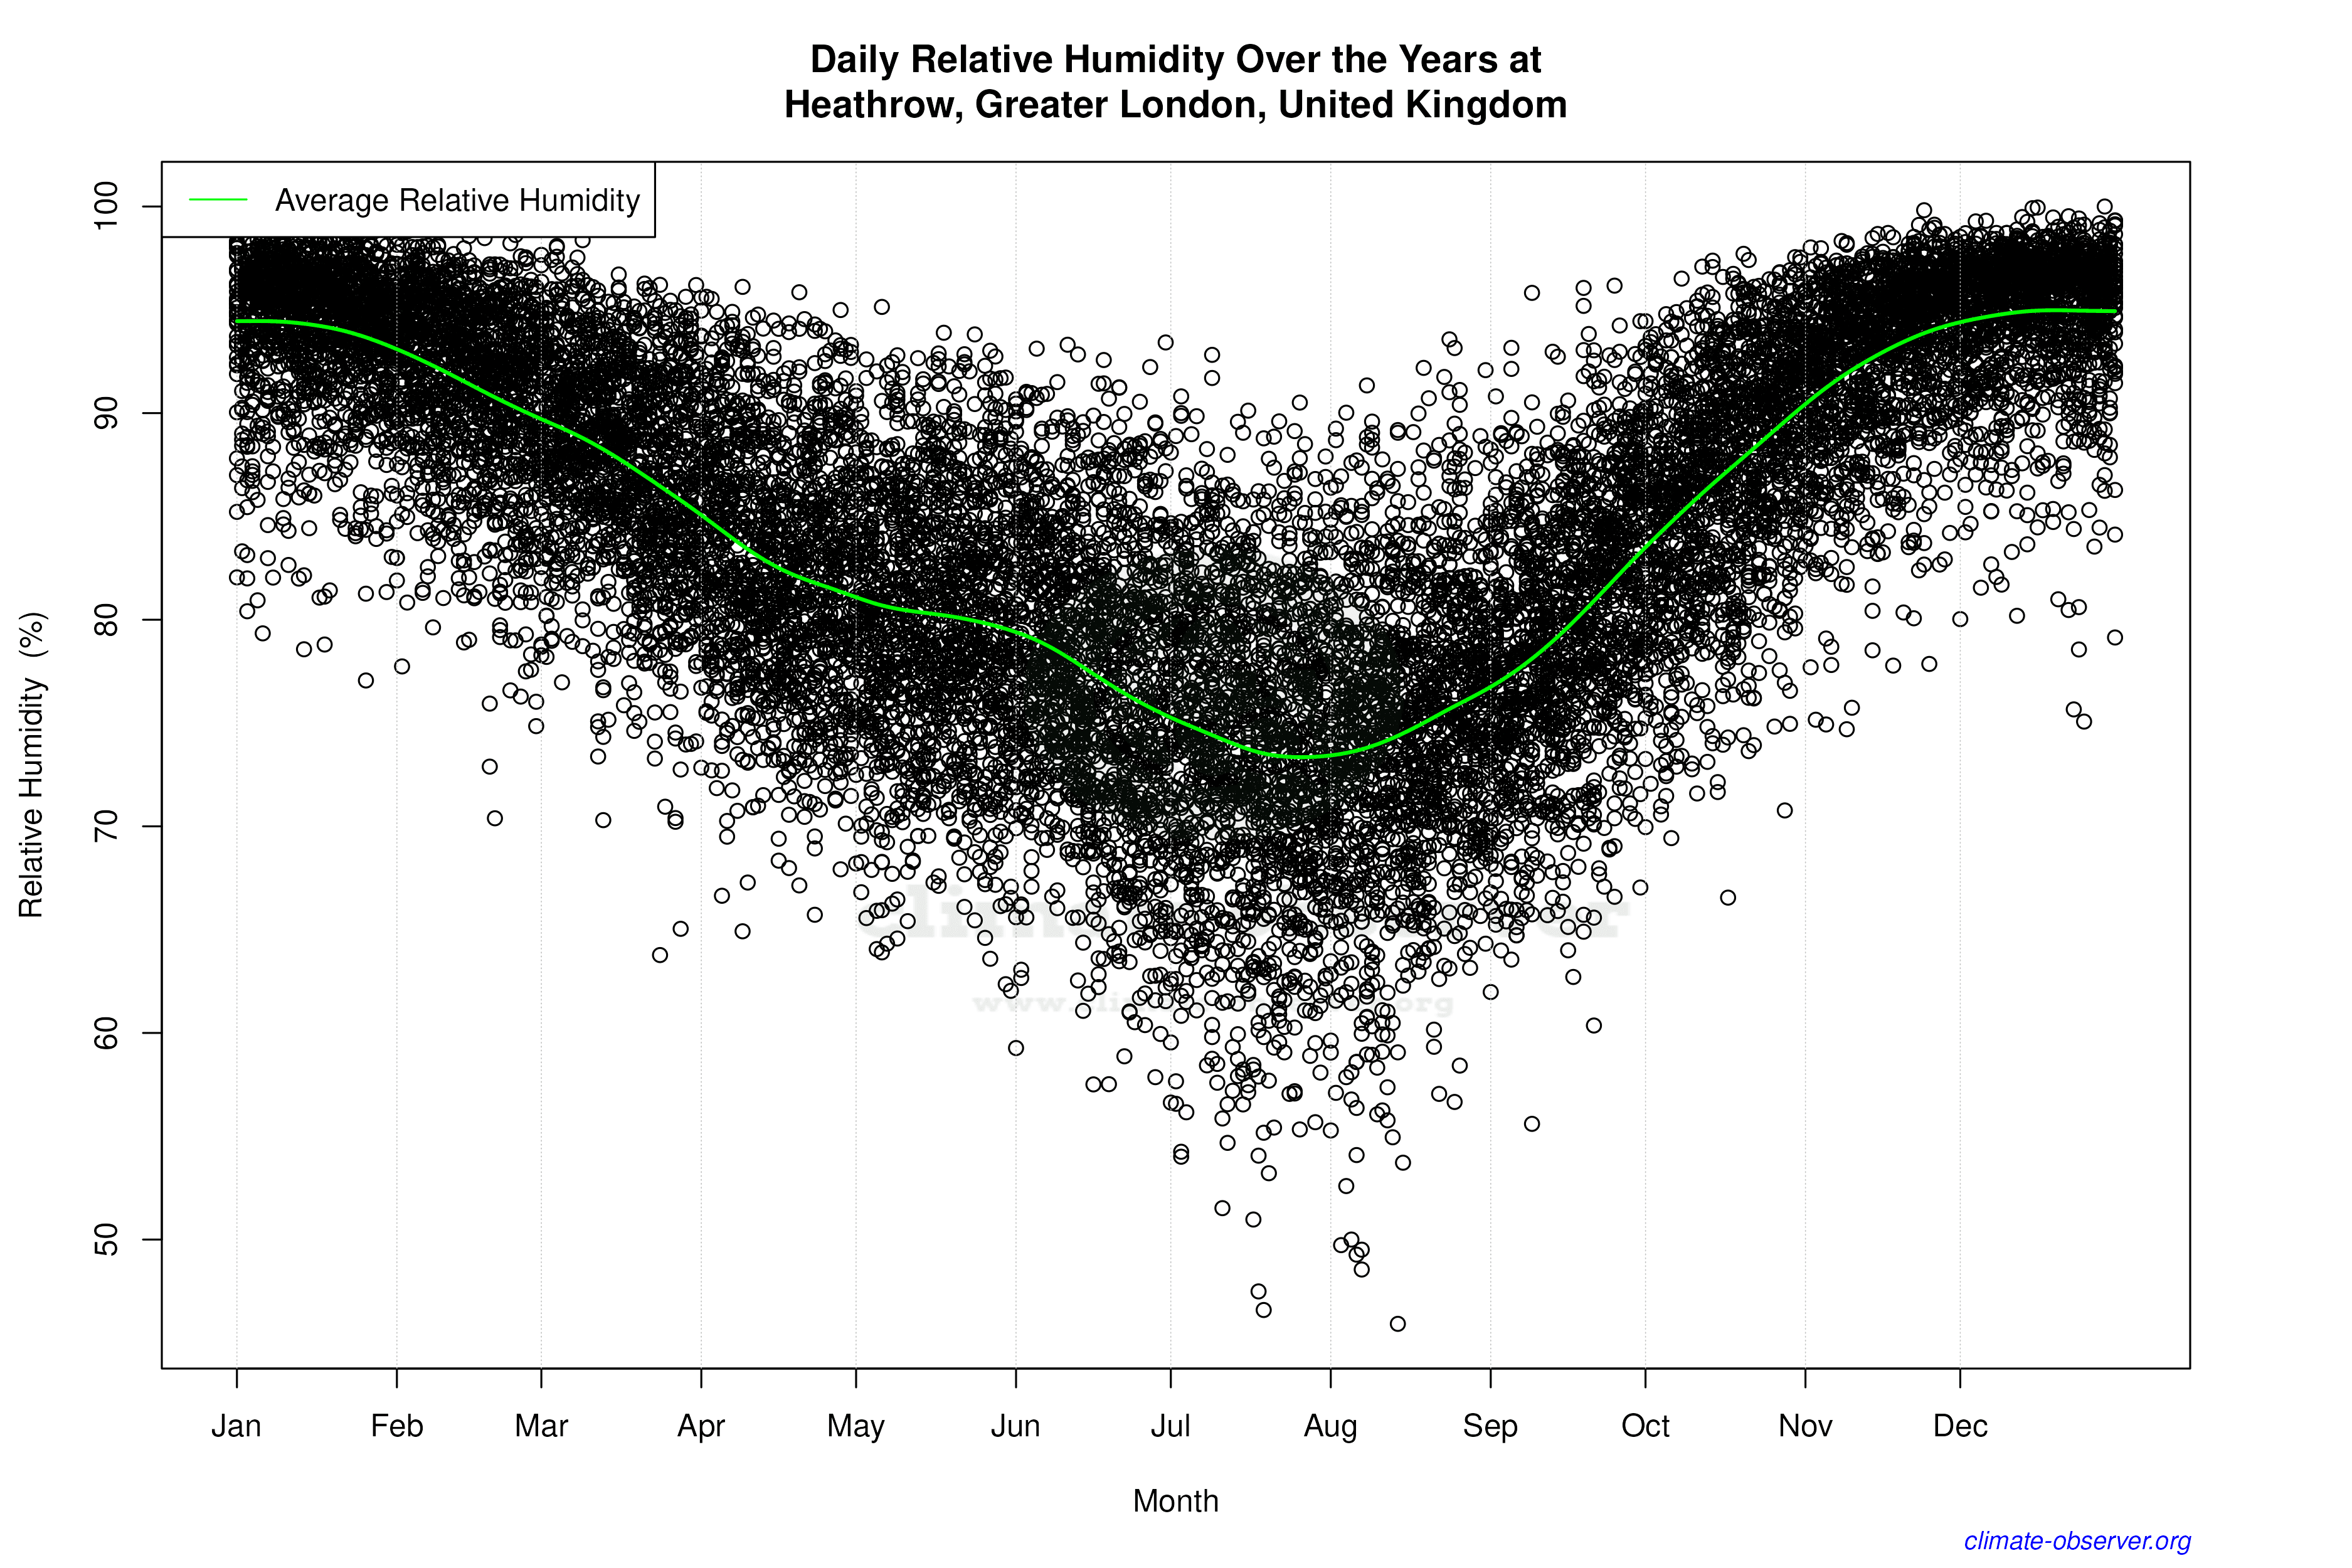
Precipitation Distribution Shifts
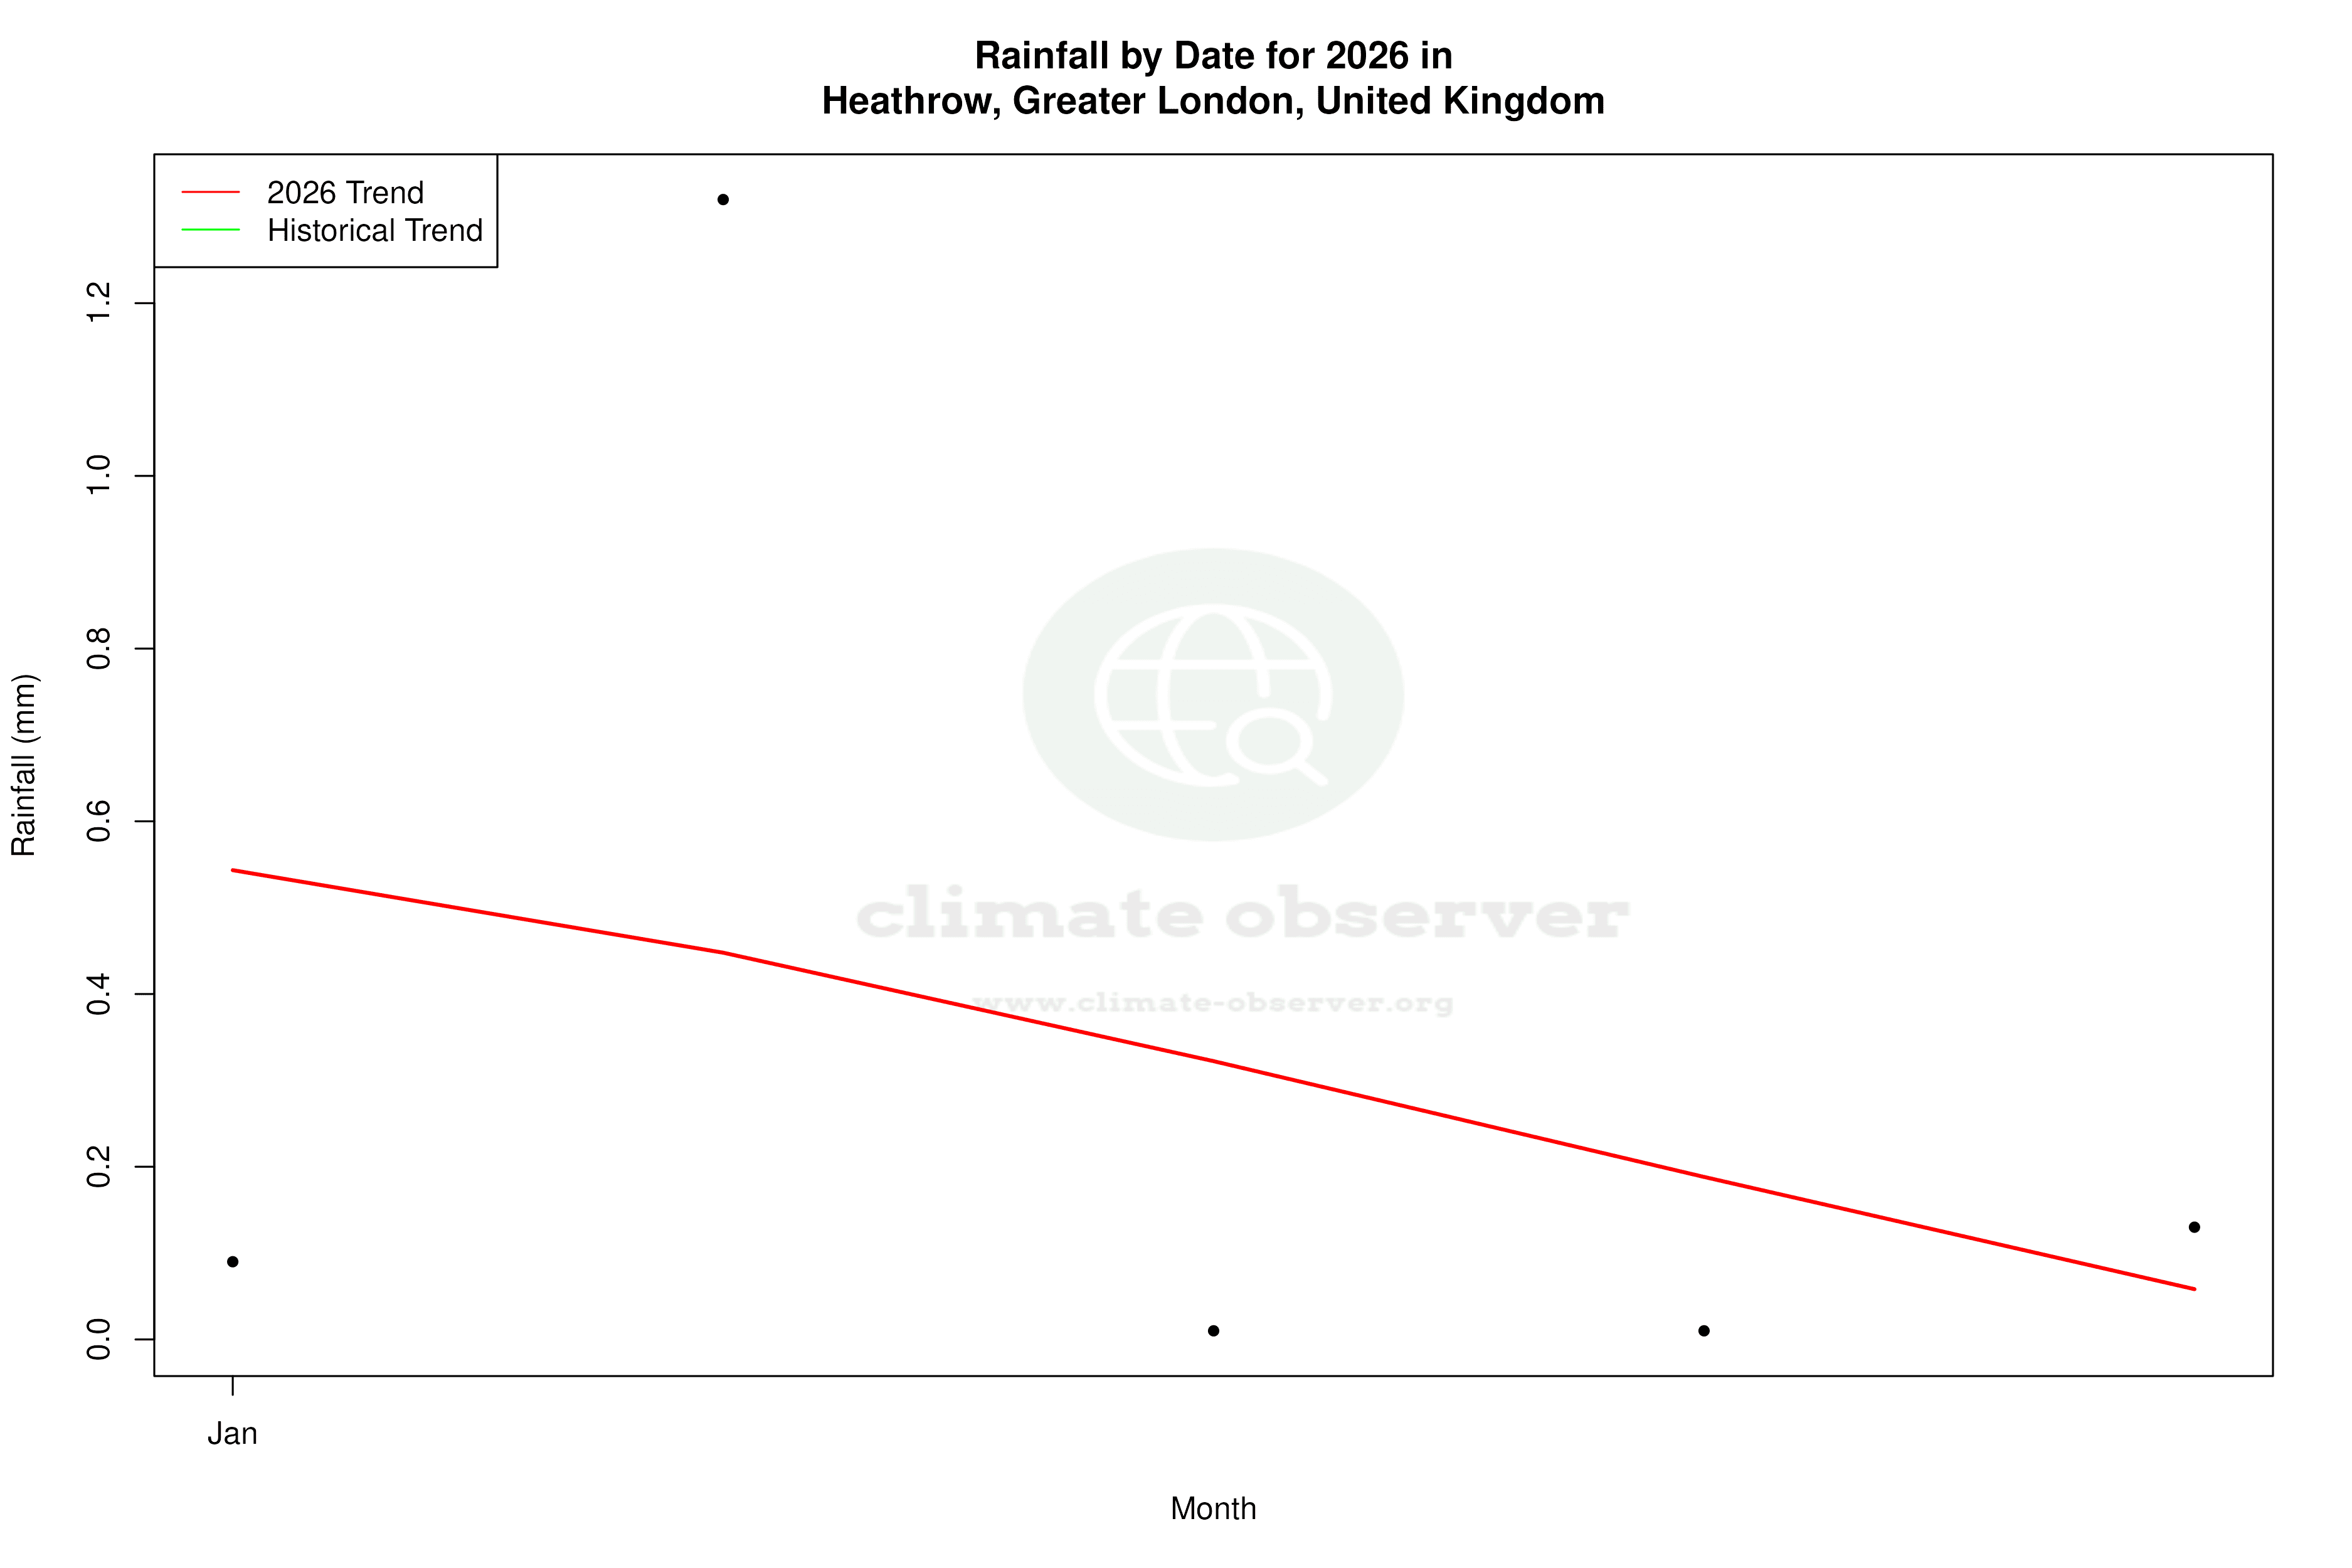
The Precipitation Concentration Index (PCI) at Heathrow has shown a slight decrease from a baseline of 11.16 to a current value of 10.72. This indicates that rainfall is becoming more evenly distributed throughout the year, reducing the risk of intense, short-duration rainfall events that can lead to flooding. This shift is beneficial in managing water resources and aligns with the UK's strategies for climate resilience.
Geographical and Climatic Influences
Heathrow's location near the River Thames and its proximity to the North Atlantic Ocean influence its climate patterns. The oceanic climate is moderated by the Gulf Stream, which helps maintain mild temperatures. However, urban heat island effects due to London's dense development can exacerbate warming trends, particularly during summer months.
Regional Climate Goals and Implications
The UK's commitment to reducing carbon emissions and enhancing climate adaptation measures is crucial in the context of Heathrow's climate data. The observed warming trends and changes in precipitation patterns underscore the importance of these goals. As the UK progresses towards its targets, monitoring such climate indicators at key locations like Heathrow remains vital for informed policy-making and public awareness.
Station Statistics
10-Year Trend
High: +2.61 °F/decade
Low: +0.88 °F/decade
Rain: +0.010 in/decade
25-Year Trend
High: +0.98 °F/decade
Low: +1.23 °F/decade
Rain: -0.003 in/decade
50-Year Trend
High: +0.79 °F/decade
Low: +0.56 °F/decade
Rain: -0.000 in/decade
All-Time Trend
High: +0.61 °F/decade
Low: +0.43 °F/decade
Rain: -0.000 in/decade
Percentage Above-Average Days
Last 12 Months: 53.2%
This Year: 66.8%
Precipitation Concentration Index (PCI) ℹ️
Last 12 Months: 10.3
Historical Average: 10.9
Percentile Rank of Last 12 Months ℹ️
High: 97th percentile
Low: 97th percentile
Rain: 16th percentile
Change in Variance ℹ️
High: +6.7%
Low: -3.8%
Intraday: +2.3%
Data Coverage
78.6%
First Year of Data
1948
Station Location
Historical Weather Records
| Max High | Avg High | Min High | Max Avg | Avg Avg | Min Avg | Max Low | Avg Low | Min Low | Max Precipitation | Avg Precipitation | Max Snow | Avg Snow | |
|---|---|---|---|---|---|---|---|---|---|---|---|---|---|
| Record | 104.36 °F | — | 21.02 °F | 85.64 °F | — | 18.68 °F | 71.96 °F | — | 10.40 °F | 1.93 in | — | — | — |
| January | 60.80 °F | 45.95 °F | 21.02 °F | 56.66 °F | 41.27 °F | 18.68 °F | 54.50 °F | 35.58 °F | 14.72 °F | 1.10 in | 0.08 in | — | — |
| February | 68.00 °F | 47.12 °F | 24.98 °F | 57.02 °F | 41.64 °F | 21.20 °F | 53.96 °F | 35.92 °F | 13.28 °F | 1.28 in | 0.06 in | — | — |
| March | 74.12 °F | 52.02 °F | 32.18 °F | 60.62 °F | 45.05 °F | 27.32 °F | 52.70 °F | 38.53 °F | 16.34 °F | 1.52 in | 0.06 in | — | — |
| April | 82.22 °F | 57.57 °F | 37.94 °F | 68.00 °F | 49.18 °F | 35.96 °F | 56.30 °F | 41.50 °F | 27.68 °F | 1.38 in | 0.06 in | — | — |
| May | 89.06 °F | 63.99 °F | 44.60 °F | 74.46 °F | 55.41 °F | 38.84 °F | 63.50 °F | 47.29 °F | 23.00 °F | 1.18 in | 0.06 in | — | — |
| June | 95.00 °F | 70.01 °F | 51.08 °F | 82.76 °F | 61.23 °F | 46.58 °F | 69.80 °F | 52.96 °F | 32.00 °F | 1.57 in | 0.07 in | — | — |
| July | 104.36 °F | 73.88 °F | 57.20 °F | 85.64 °F | 64.92 °F | 52.34 °F | 71.96 °F | 56.80 °F | 42.08 °F | 1.54 in | 0.06 in | — | — |
| August | 100.22 °F | 73.05 °F | 55.94 °F | 82.94 °F | 64.15 °F | 52.34 °F | 71.24 °F | 56.31 °F | 32.00 °F | 1.89 in | 0.07 in | — | — |
| September | 91.40 °F | 67.52 °F | 51.08 °F | 78.08 °F | 59.44 °F | 44.60 °F | 67.46 °F | 51.91 °F | 28.76 °F | 1.93 in | 0.07 in | — | — |
| October | 83.84 °F | 59.80 °F | 42.80 °F | 68.72 °F | 53.09 °F | 33.98 °F | 66.20 °F | 45.88 °F | 24.80 °F | 1.73 in | 0.09 in | — | — |
| November | 73.40 °F | 51.68 °F | 34.70 °F | 61.16 °F | 46.38 °F | 28.58 °F | 58.46 °F | 40.22 °F | 20.30 °F | 1.26 in | 0.08 in | — | — |
| December | 61.52 °F | 47.34 °F | 26.60 °F | 58.28 °F | 42.89 °F | 23.72 °F | 55.94 °F | 37.38 °F | 10.40 °F | 1.22 in | 0.08 in | — | — |
Data Visualisations
Remove WatermarksCurrent Year Climate Trends vs Historical


Max Temperature this Year | 1 of 6
Climate 12-Month Moving Averages


Max Temperature 12-Month MA | 1 of 6
Daily Data Points and Averages Throughout the Year
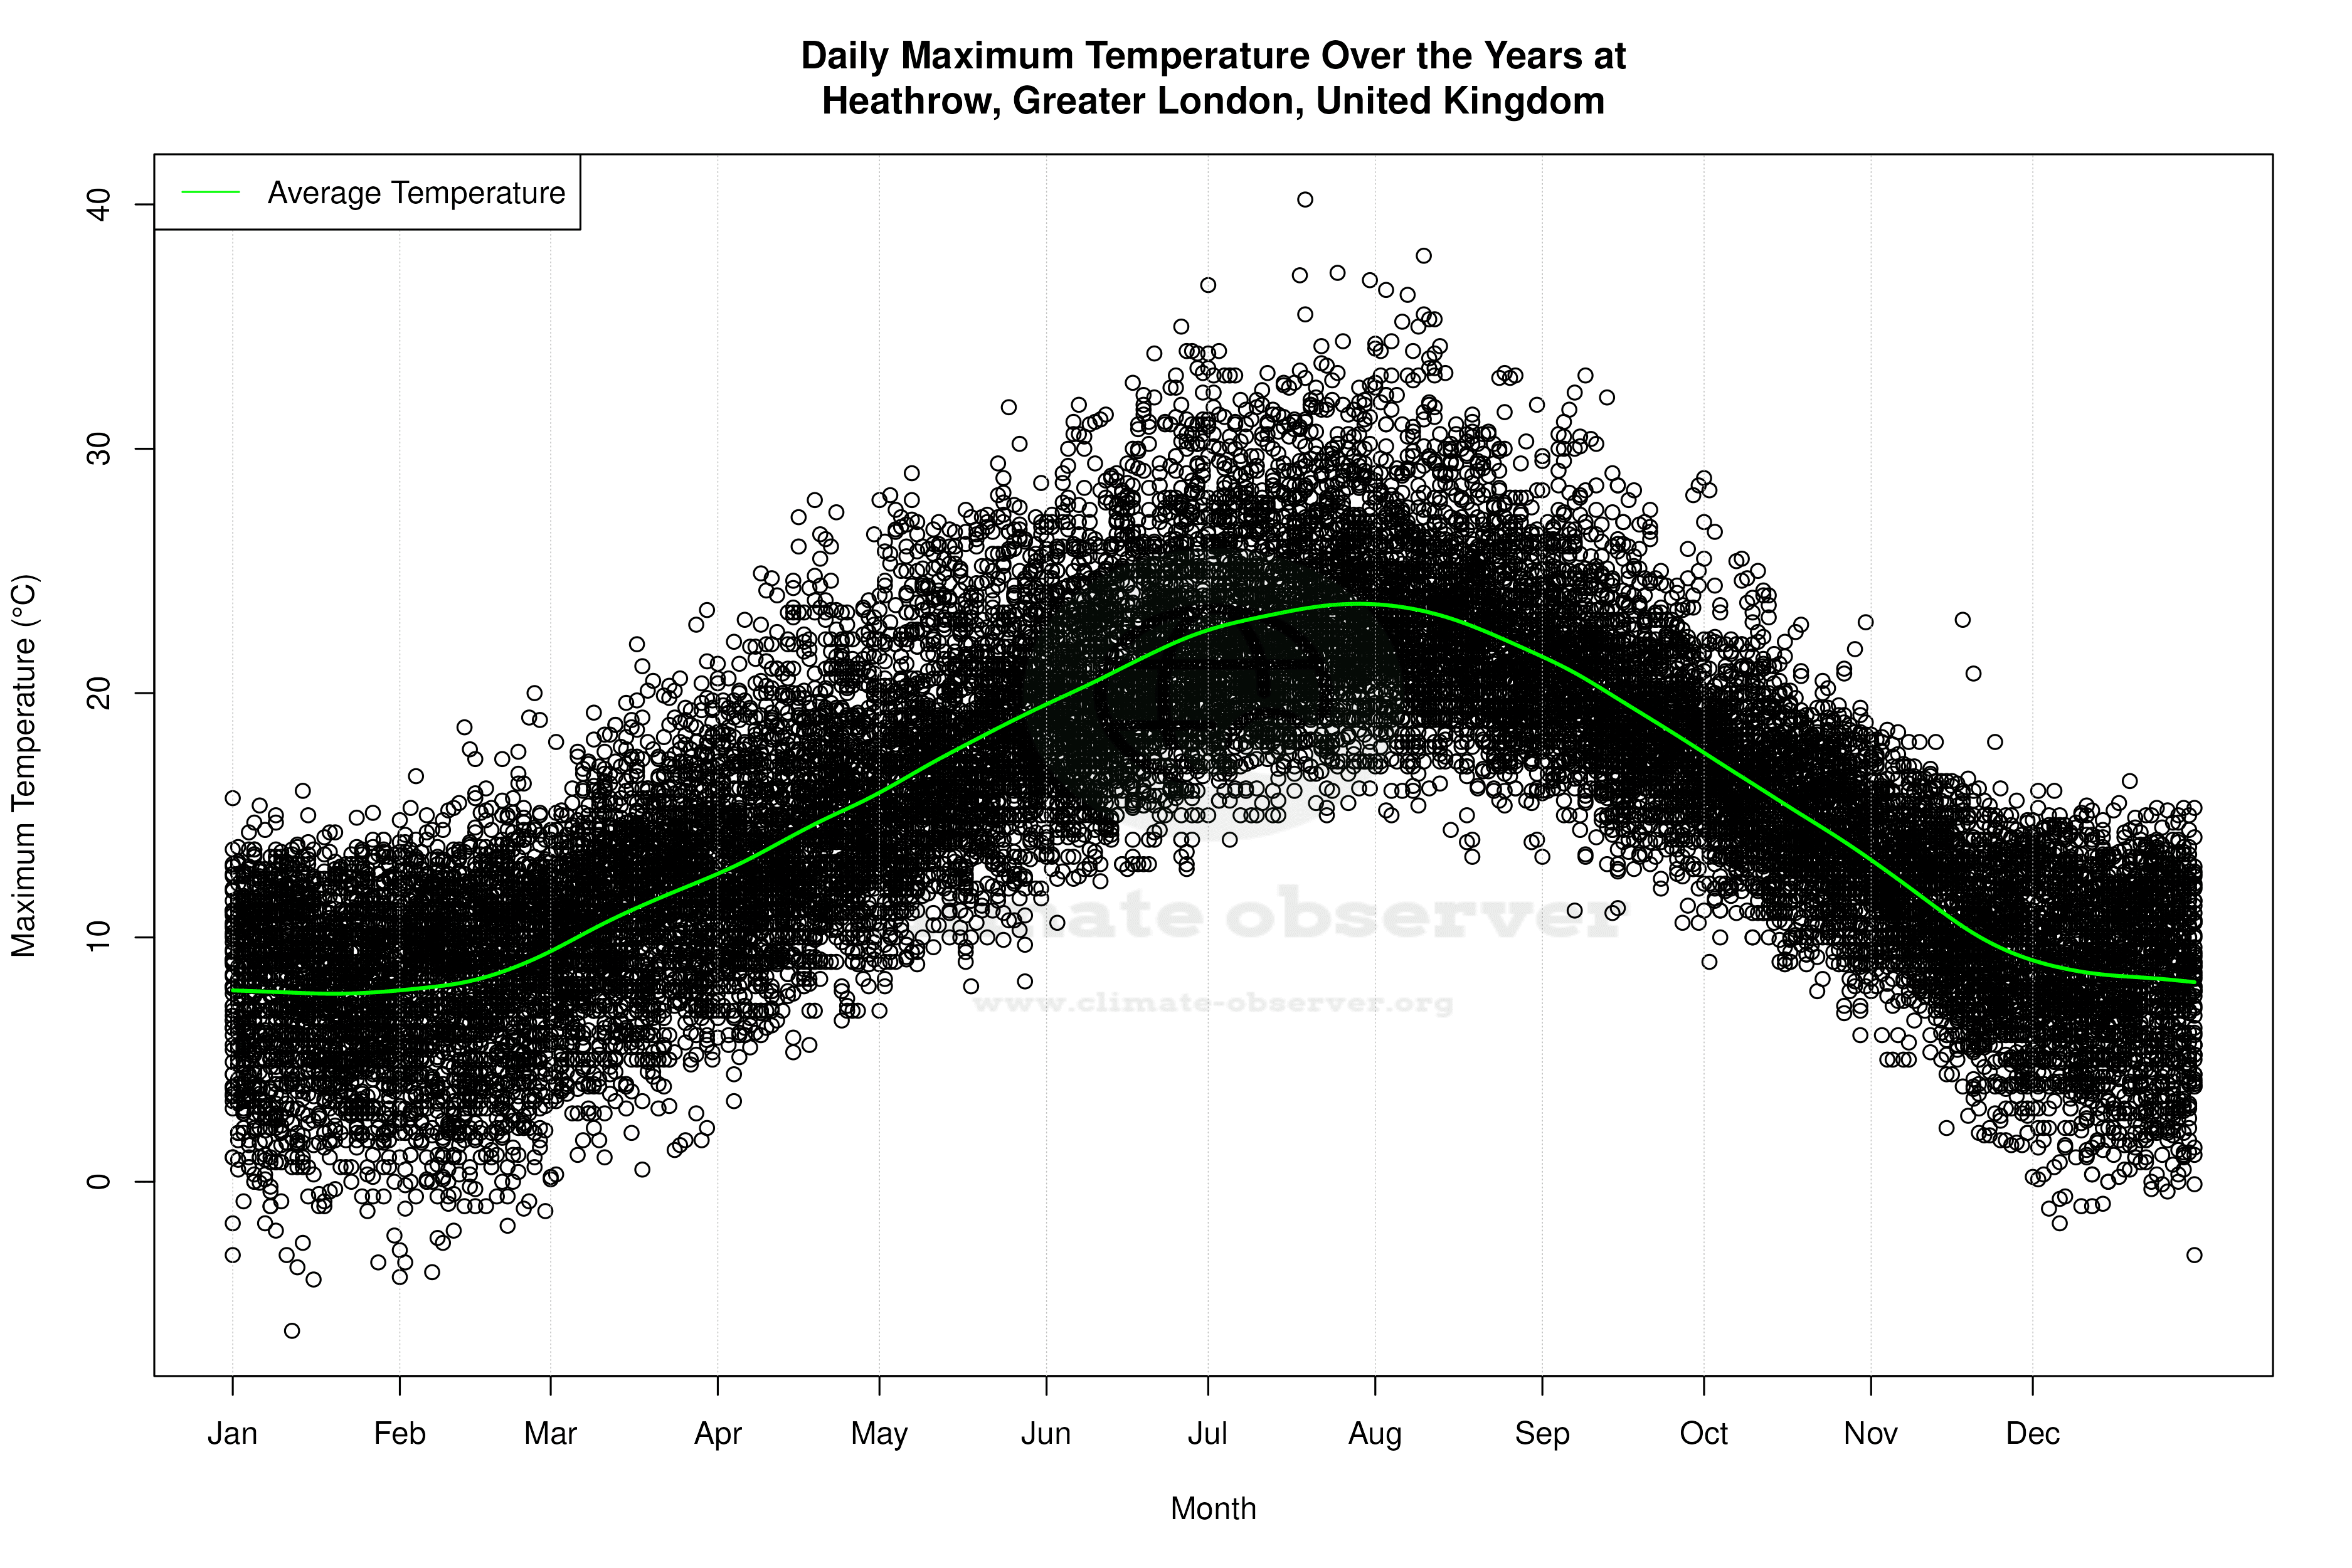


Average Max Temperature Throughout Year | 1 of 5
