Climate for Station: Alexander City, Alabama, United States
Loading live weather...
Climate Analysis & Overview
Alexander City, located in Tallapoosa County, Alabama, experiences a complex climate narrative. While the long-term data suggests a slight warming trend, recent years have shown a cooling pattern. Precipitation events are becoming marginally more concentrated, indicating potential shifts in local weather patterns.
Subtropical Climate Dynamics
Alexander City falls under the humid subtropical climate classification, characterised by hot summers and mild winters. This region, nestled in the southeastern United States, is influenced by its proximity to the Gulf of Mexico, which contributes to its warm and humid conditions. The local geography, with its rolling hills and proximity to Lake Martin, plays a significant role in moderating temperatures and impacting precipitation patterns.
Temperature Trends: A Mixed Story
The all-time temperature trends for Alexander City indicate a slight warming, with highs increasing by 0.08°C (0.14°F) and lows by 0.28°C (0.50°F). This suggests a gradual rise in temperatures over the long term. However, the past decade presents a contrasting picture, with a cooling trend observed. Highs have decreased by 0.93°C (1.67°F), and lows have fallen by 0.22°C (0.39°F). This divergence between long-term and recent trends highlights the complexity of local climate dynamics.
Precipitation Patterns: Increasing Concentration
The Precipitation Concentration Index (PCI) for Alexander City has shown a marginal increase from a baseline of 11.25 to a current value of 11.73. The PCI measures how precipitation is distributed over time, with higher values indicating more concentrated rainfall events. This slight increase suggests that rainfall is becoming marginally more concentrated in fewer, possibly more intense, events. Such changes may have implications for water management and flood risk in the region.
Extreme Temperature Records
Alexander City has experienced significant temperature extremes, with a record high of 40.6°C (105.1°F) and a record low of -21.1°C (-6.0°F). These extremes underscore the variability inherent in the region's climate and the potential for both heatwaves and cold snaps.
Regional Climate Considerations
In the context of the United States' broader climate goals, which focus on reducing greenhouse gas emissions and enhancing resilience to climate impacts, Alexander City's climate profile offers insights into localised trends. The cooling observed over the past decade may provide a temporary reprieve from the broader warming trend, but the increasing concentration of precipitation events could pose challenges for infrastructure and agriculture. As climate policies evolve, understanding these nuanced trends will be crucial for effective adaptation strategies.
Station Statistics
10-Year Trend
High: -0.35 °F/decade
Low: +0.97 °F/decade
Rain: +0.040 in/decade
25-Year Trend
High: +0.75 °F/decade
Low: +1.12 °F/decade
Rain: +0.014 in/decade
50-Year Trend
High: +0.19 °F/decade
Low: +0.60 °F/decade
Rain: +0.003 in/decade
All-Time Trend
High: +0.19 °F/decade
Low: +0.51 °F/decade
Rain: -0.001 in/decade
Percentage Above-Average Days
Last 12 Months: 61.6%
This Year: 54.5%
Precipitation Concentration Index (PCI) ℹ️
Last 12 Months: 11.3
Historical Average: 10.3
Percentile Rank of Last 12 Months ℹ️
High: 74th percentile
Low: 89th percentile
Rain: 39th percentile
Change in Variance ℹ️
High: -11.6%
Low: -0.9%
Intraday: -3.4%
Data Coverage
94.9%
First Year of Data
1990
Station Location
Historical Weather Records
| Max High | Avg High | Min High | Max Avg | Avg Avg | Min Avg | Max Low | Avg Low | Min Low | Max Precipitation | Avg Precipitation | Max Snow | Avg Snow | |
|---|---|---|---|---|---|---|---|---|---|---|---|---|---|
| Record | 105.08 °F | — | 19.94 °F | 90.77 °F | — | 9.37 °F | 78.98 °F | — | -5.98 °F | 5.34 in | — | 5.00 in | — |
| January | 80.06 °F | 55.16 °F | 19.94 °F | 73.40 °F | 43.69 °F | 10.40 °F | 62.96 °F | 31.82 °F | -5.98 °F | 3.57 in | 0.17 in | 5.00 in | 0.01 in |
| February | 82.04 °F | 59.93 °F | 21.02 °F | 73.76 °F | 48.43 °F | 9.37 °F | 68.00 °F | 34.89 °F | 5.00 °F | 3.90 in | 0.19 in | 0.00 in | 0.00 in |
| March | 89.06 °F | 68.24 °F | 28.04 °F | 74.84 °F | 55.28 °F | 24.12 °F | 68.00 °F | 41.86 °F | 12.02 °F | 4.16 in | 0.20 in | 0.51 in | 0.00 in |
| April | 91.94 °F | 75.47 °F | 46.04 °F | 80.24 °F | 62.35 °F | 36.84 °F | 69.08 °F | 48.61 °F | 24.98 °F | 4.50 in | 0.16 in | 0.71 in | 0.00 in |
| May | 96.08 °F | 81.94 °F | 55.04 °F | 85.10 °F | 70.42 °F | 49.46 °F | 73.04 °F | 57.86 °F | 35.06 °F | 3.36 in | 0.15 in | 0.00 in | 0.00 in |
| June | 102.02 °F | 88.15 °F | 66.92 °F | 88.88 °F | 77.31 °F | 62.83 °F | 77.00 °F | 65.69 °F | 42.08 °F | 4.67 in | 0.16 in | 0.00 in | 0.00 in |
| July | 104.20 °F | 90.88 °F | 71.96 °F | 90.03 °F | 80.19 °F | 69.62 °F | 78.98 °F | 69.49 °F | 55.42 °F | 2.85 in | 0.16 in | 0.00 in | 0.00 in |
| August | 105.08 °F | 90.10 °F | 68.00 °F | 90.77 °F | 79.61 °F | 63.30 °F | 77.00 °F | 68.46 °F | 53.06 °F | 3.06 in | 0.13 in | 0.00 in | 0.00 in |
| September | 100.94 °F | 85.64 °F | 57.02 °F | 87.37 °F | 74.25 °F | 55.26 °F | 73.94 °F | 62.72 °F | 37.94 °F | 5.34 in | 0.13 in | 0.00 in | 0.00 in |
| October | 100.04 °F | 76.62 °F | 42.98 °F | 82.04 °F | 63.81 °F | 36.70 °F | 71.96 °F | 50.53 °F | 26.06 °F | 4.73 in | 0.10 in | 0.00 in | 0.00 in |
| November | 93.92 °F | 66.77 °F | 35.06 °F | 75.74 °F | 53.59 °F | 31.64 °F | 71.06 °F | 40.83 °F | 14.00 °F | 4.08 in | 0.14 in | 0.00 in | 0.00 in |
| December | 80.96 °F | 58.26 °F | 21.02 °F | 74.12 °F | 46.52 °F | 10.58 °F | 68.00 °F | 34.74 °F | -0.94 °F | 2.77 in | 0.16 in | 2.01 in | 0.00 in |
Data Visualisations
Remove WatermarksCurrent Year Climate Trends vs Historical


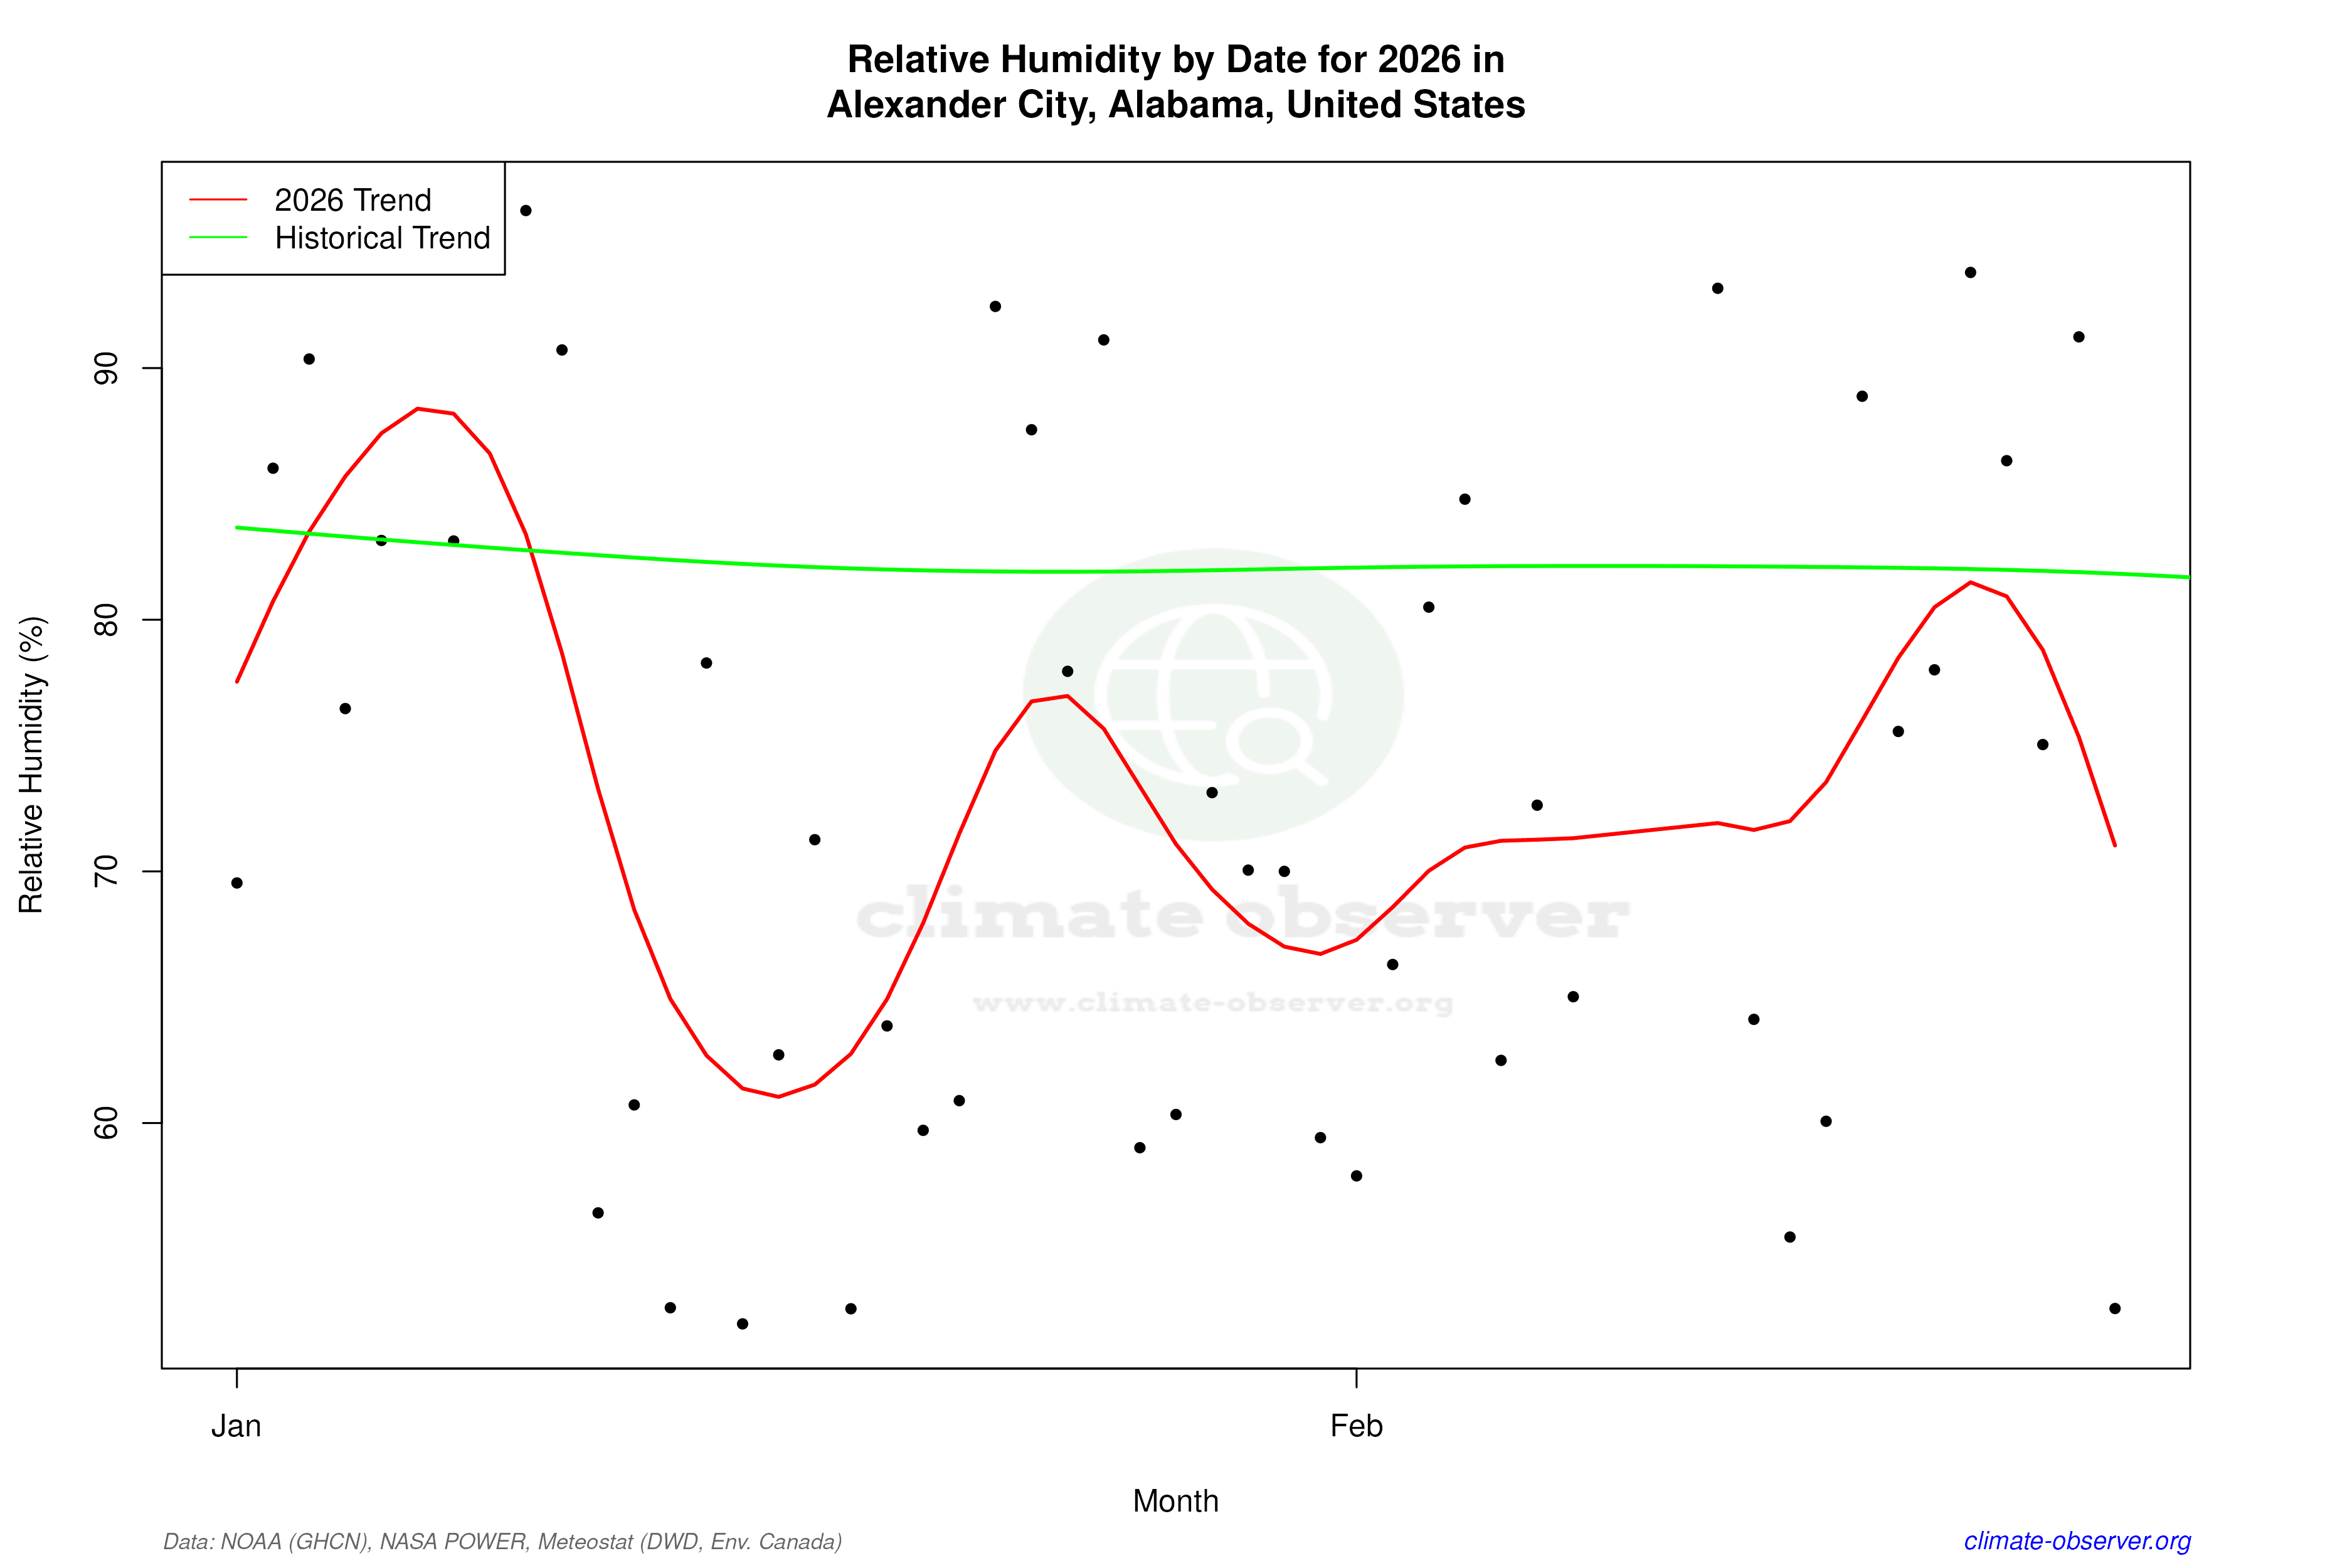

Max Temperature this Year | 1 of 6
Climate 12-Month Moving Averages


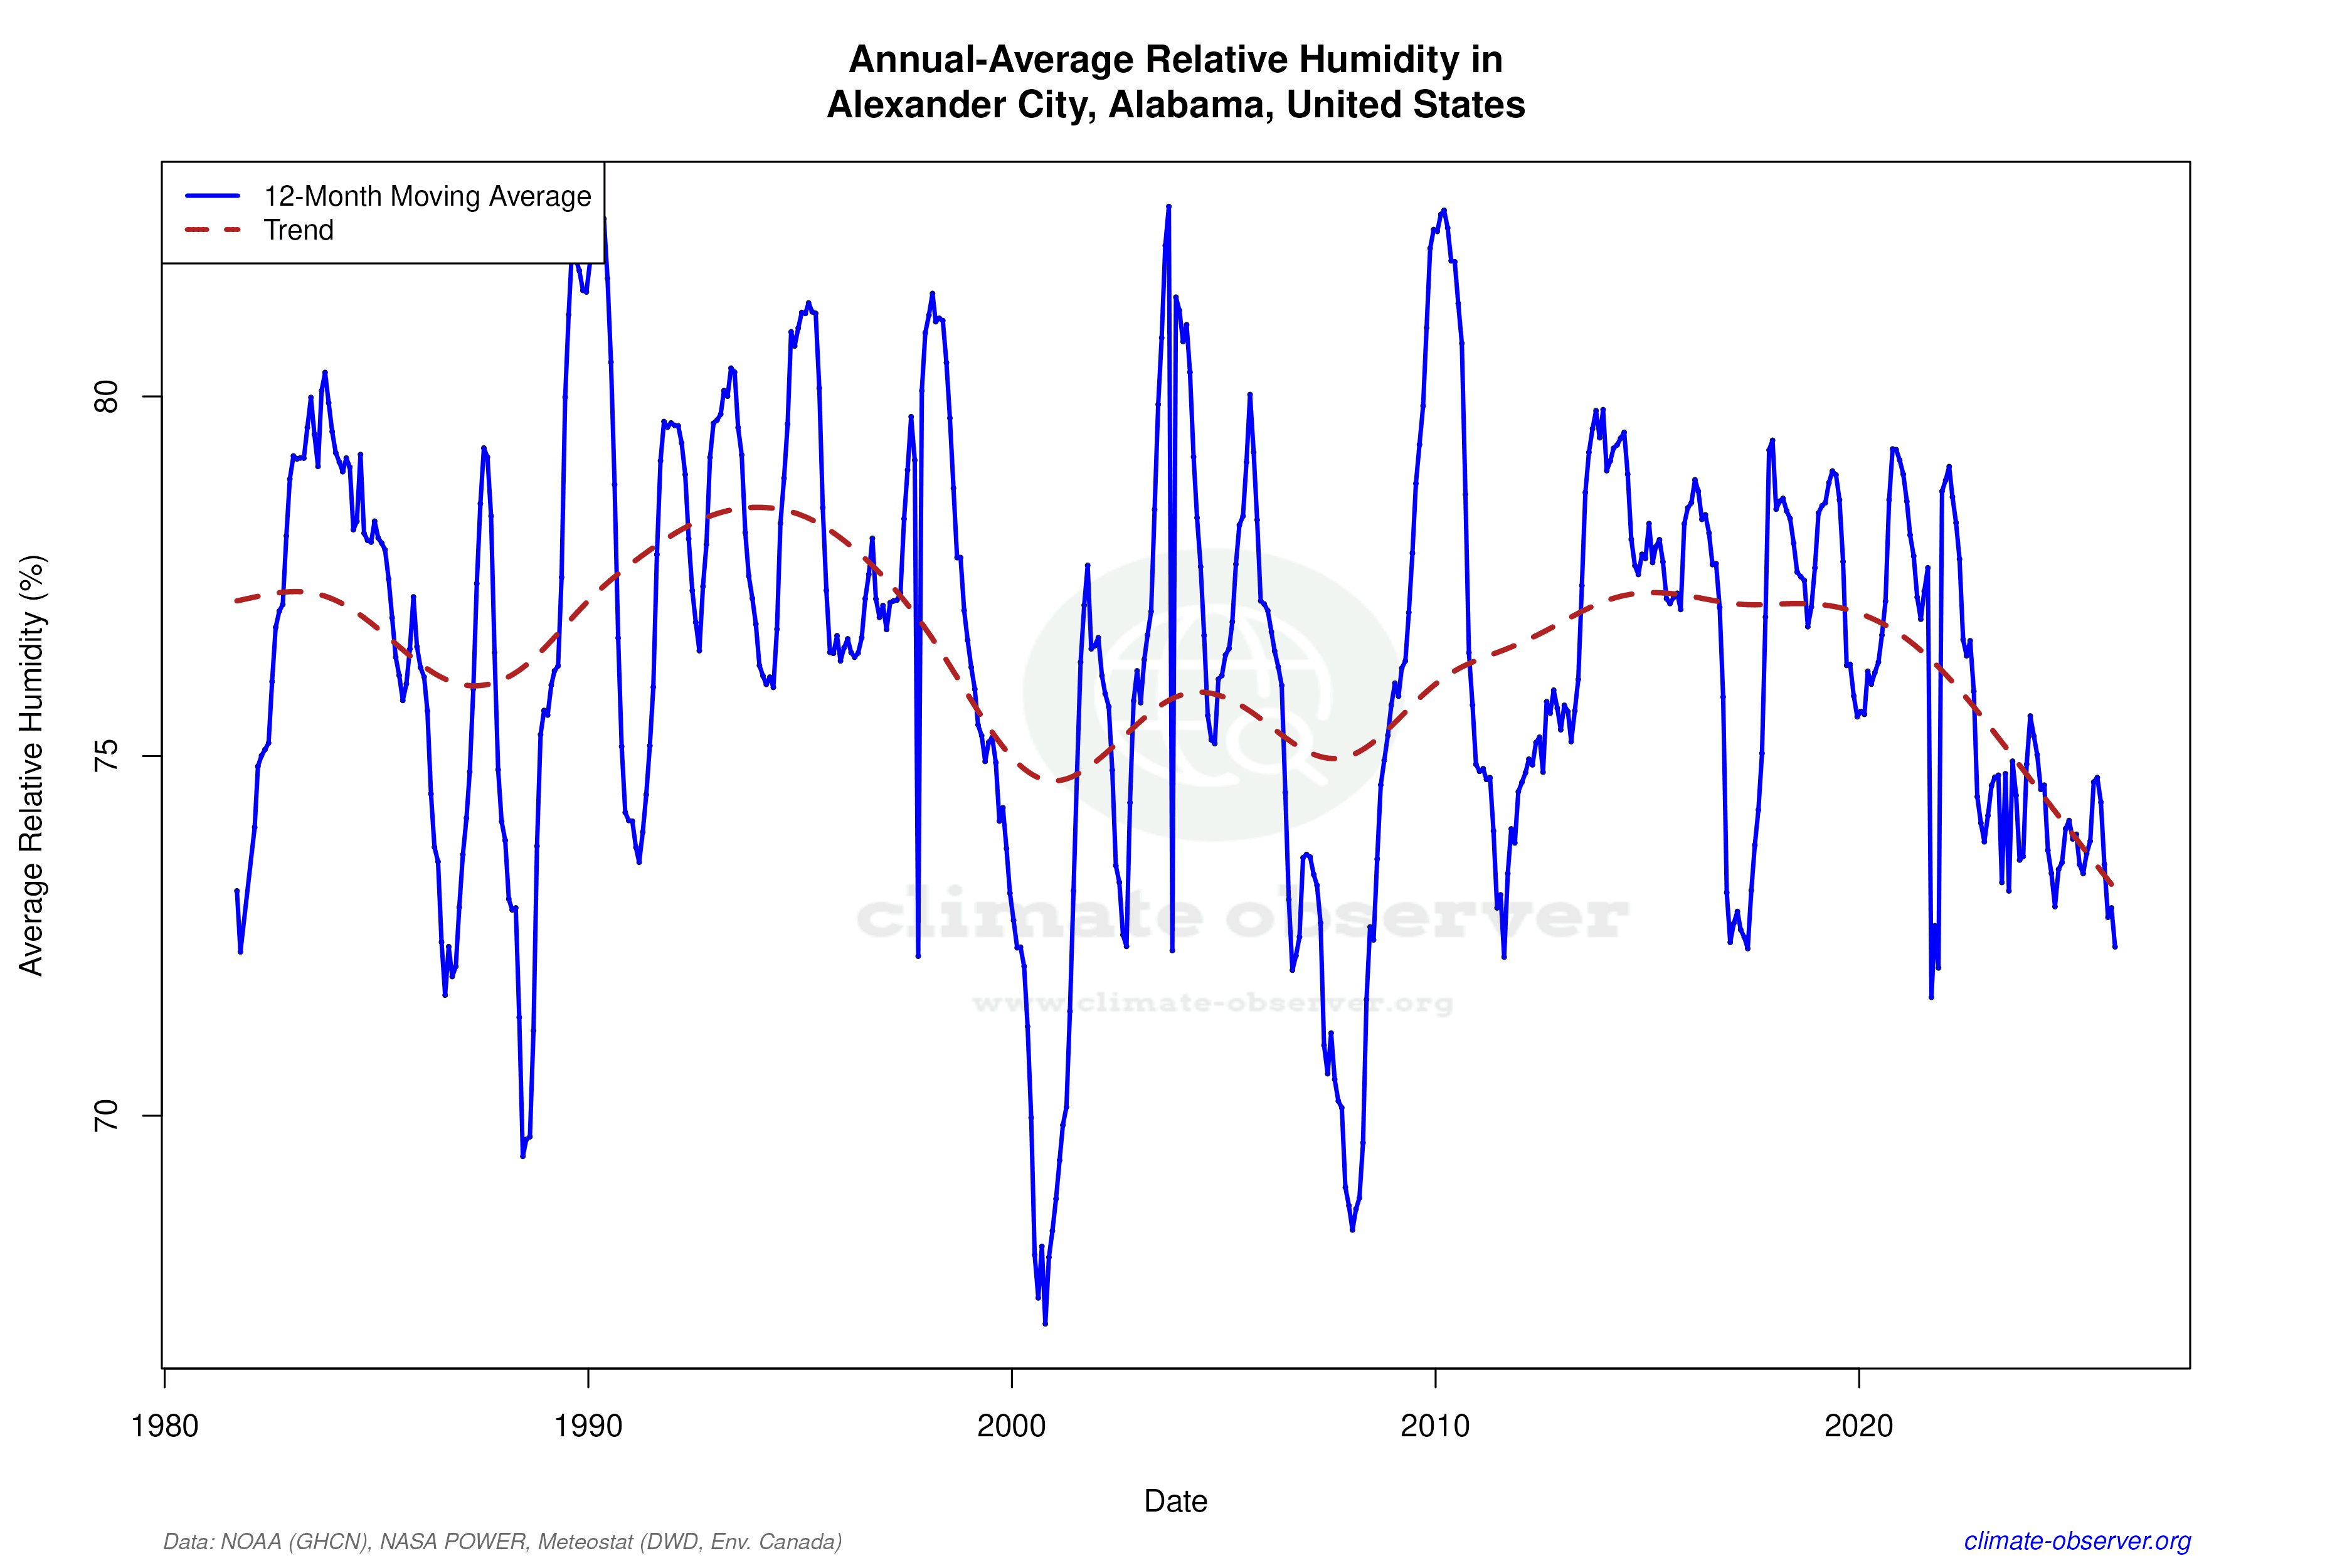

Max Temperature 12-Month MA | 1 of 6
Daily Data Points and Averages Throughout the Year


Average Max Temperature Throughout Year | 1 of 5
