Climate for Station: Gila Bend 2se, Arizona, United States
Loading live weather...
Climate Analysis & Overview
Gila Bend 2se in the Sonoran Desert is experiencing a warming trend in high temperatures over the past decade, contrasting with a historical cooling trend. The precipitation pattern has become more evenly distributed, suggesting a shift in local climate dynamics.
Desert Climate Dynamics
Located in the heart of the Sonoran Desert, Gila Bend 2se is characterised by its arid climate, classified under the Köppen system as a hot desert climate (BWh). This region is known for its extreme temperatures and minimal rainfall, influenced by its geographical position in Maricopa County, Arizona. The surrounding desert landscape, devoid of significant water bodies or mountains, allows for rapid temperature fluctuations.
Temperature Trends: A Tale of Two Timelines
Over the past decade, Gila Bend 2se has witnessed a warming trend in high temperatures, with an increase of 1.51°C (2.72°F). This recent warming contrasts sharply with the all-time trend, which shows a slight cooling of 0.03°C (0.05°F) in high temperatures. Meanwhile, the low temperatures have decreased by 0.61°C (1.10°F) over the last ten years, yet have risen by 0.31°C (0.56°F) historically. These opposing trends highlight the complex interplay of factors influencing the local climate.
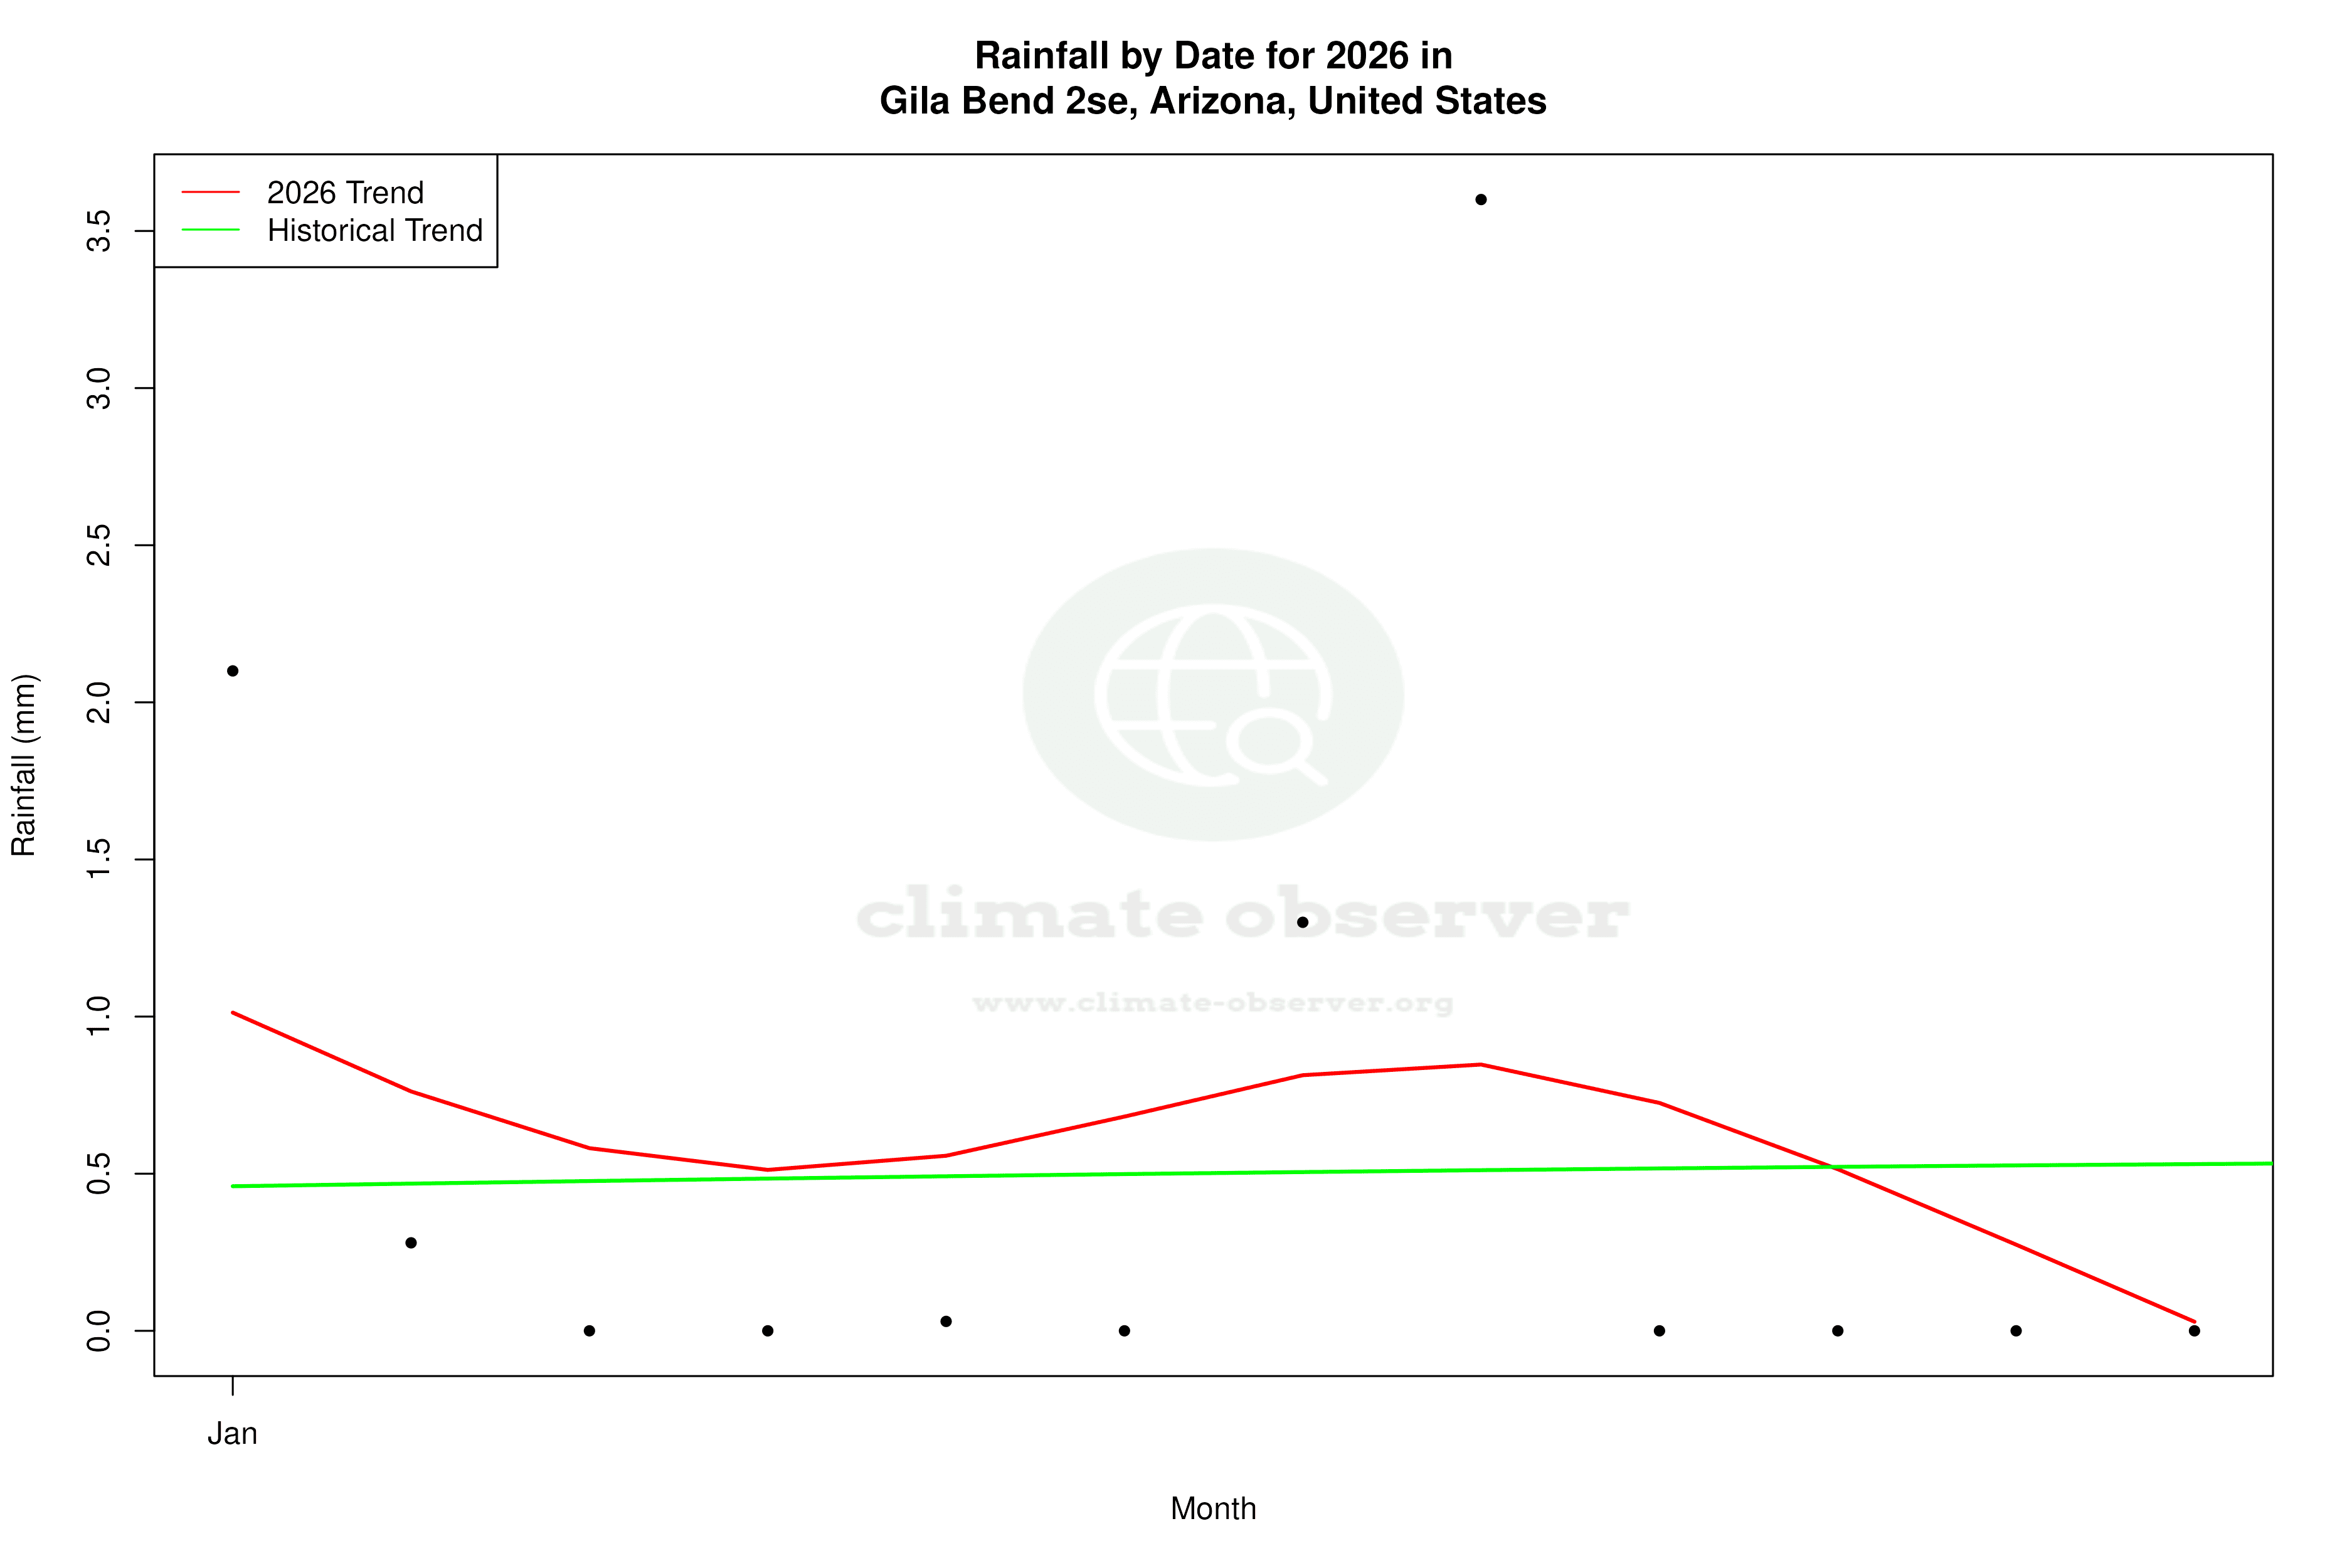
Precipitation Patterns: A Shift Towards Even Distribution
The Precipitation Concentration Index (PCI) for Gila Bend 2se has decreased from a baseline of 18.97 to a current value of 15.21. This significant reduction indicates a shift towards a more evenly distributed precipitation pattern, moving away from the previously more concentrated rainfall events. Such a change could impact local water resources and agricultural practices, aligning with broader regional climate goals aimed at sustainable water management.
Extreme Temperature Records
Gila Bend 2se's climate is marked by its extreme temperature records, with a maximum recorded temperature of 50.0°C (122.0°F) and a minimum of -12.2°C (10.0°F). These extremes underscore the station's position within one of the hottest regions in the United States, where temperature variability is a defining characteristic.
Regional Climate Context
The climate narrative of Gila Bend 2se is set against the backdrop of the United States' efforts to address climate change impacts, particularly in arid regions. Recent weather events, such as heatwaves and droughts, underscore the importance of understanding local climate dynamics. The observed trends at Gila Bend 2se provide valuable insights into the broader climatic shifts occurring in the American Southwest, informing both local adaptation strategies and national climate policies.
Station Statistics
10-Year Trend
High: +2.44 °F/decade
Low: -0.81 °F/decade
Rain: -0.008 in/decade
25-Year Trend
High: -0.55 °F/decade
Low: +0.92 °F/decade
Rain: -0.003 in/decade
50-Year Trend
High: -0.01 °F/decade
Low: +0.52 °F/decade
Rain: -0.002 in/decade
All-Time Trend
High: -0.01 °F/decade
Low: +0.56 °F/decade
Rain: +0.000 in/decade
Percentage Above-Average Days
Last 12 Months: 58.4%
This Year: 69.8%
Precipitation Concentration Index (PCI) ℹ️
Last 12 Months: 27.0
Historical Average: 18.2
Percentile Rank of Last 12 Months ℹ️
High: 79th percentile
Low: 93rd percentile
Rain: 19th percentile
Change in Variance ℹ️
High: -0.2%
Low: -3.0%
Intraday: -36.1%
Data Coverage
80.8%
First Year of Data
1892
Station Location
Historical Weather Records
| Max High | Avg High | Min High | Max Avg | Avg Avg | Min Avg | Max Low | Avg Low | Min Low | Max Precipitation | Avg Precipitation | Max Snow | Avg Snow | |
|---|---|---|---|---|---|---|---|---|---|---|---|---|---|
| Record | 122.00 °F | — | 39.92 °F | 105.08 °F | — | 30.52 °F | 109.04 °F | — | 10.04 °F | 2.61 in | — | 2.52 in | — |
| January | 89.96 °F | 68.83 °F | 39.92 °F | 66.60 °F | 52.17 °F | 31.82 °F | 64.94 °F | 39.07 °F | 10.04 °F | 1.55 in | 0.02 in | 2.01 in | 0.00 in |
| February | 95.00 °F | 73.52 °F | 48.02 °F | 78.69 °F | 56.02 °F | 31.95 °F | 66.02 °F | 42.27 °F | 23.00 °F | 1.08 in | 0.02 in | 0.12 in | 0.00 in |
| March | 105.69 °F | 79.88 °F | 55.04 °F | 88.36 °F | 62.34 °F | 45.14 °F | 73.94 °F | 46.85 °F | 24.98 °F | 1.30 in | 0.02 in | 0.00 in | 0.00 in |
| April | 109.94 °F | 88.11 °F | 51.98 °F | 88.70 °F | 69.89 °F | 47.71 °F | 78.08 °F | 52.47 °F | 28.04 °F | 1.38 in | 0.01 in | 0.00 in | 0.00 in |
| May | 116.06 °F | 96.44 °F | 62.06 °F | 95.92 °F | 79.00 °F | 56.41 °F | 91.04 °F | 60.16 °F | 39.02 °F | 1.25 in | 0.00 in | 0.00 in | 0.00 in |
| June | 122.00 °F | 106.05 °F | 77.00 °F | 102.20 °F | 88.91 °F | 64.69 °F | 91.04 °F | 69.07 °F | 42.08 °F | 0.70 in | 0.00 in | 0.00 in | 0.00 in |
| July | 122.00 °F | 108.75 °F | 86.54 °F | 105.08 °F | 93.12 °F | 77.05 °F | 96.08 °F | 78.59 °F | 51.08 °F | 1.50 in | 0.03 in | 0.00 in | 0.00 in |
| August | 120.02 °F | 107.16 °F | 82.40 °F | 104.36 °F | 91.66 °F | 75.34 °F | 109.04 °F | 77.48 °F | 50.00 °F | 2.61 in | 0.03 in | 0.00 in | 0.00 in |
| September | 120.02 °F | 102.84 °F | 75.92 °F | 101.30 °F | 86.05 °F | 65.34 °F | 98.96 °F | 70.65 °F | 37.04 °F | 2.52 in | 0.02 in | 0.00 in | 0.00 in |
| October | 114.08 °F | 91.95 °F | 57.92 °F | 95.54 °F | 73.94 °F | 49.69 °F | 89.06 °F | 57.75 °F | 30.92 °F | 1.32 in | 0.01 in | 0.00 in | 0.00 in |
| November | 98.96 °F | 78.55 °F | 46.94 °F | 83.30 °F | 60.97 °F | 40.14 °F | 69.98 °F | 45.98 °F | 21.92 °F | 2.00 in | 0.02 in | 0.00 in | 0.00 in |
| December | 91.94 °F | 69.02 °F | 44.06 °F | 69.62 °F | 51.83 °F | 30.52 °F | 61.92 °F | 39.20 °F | 15.08 °F | 2.03 in | 0.02 in | 2.52 in | 0.00 in |
Data Visualisations
Remove WatermarksCurrent Year Climate Trends vs Historical


Max Temperature this Year | 1 of 6
Climate 12-Month Moving Averages
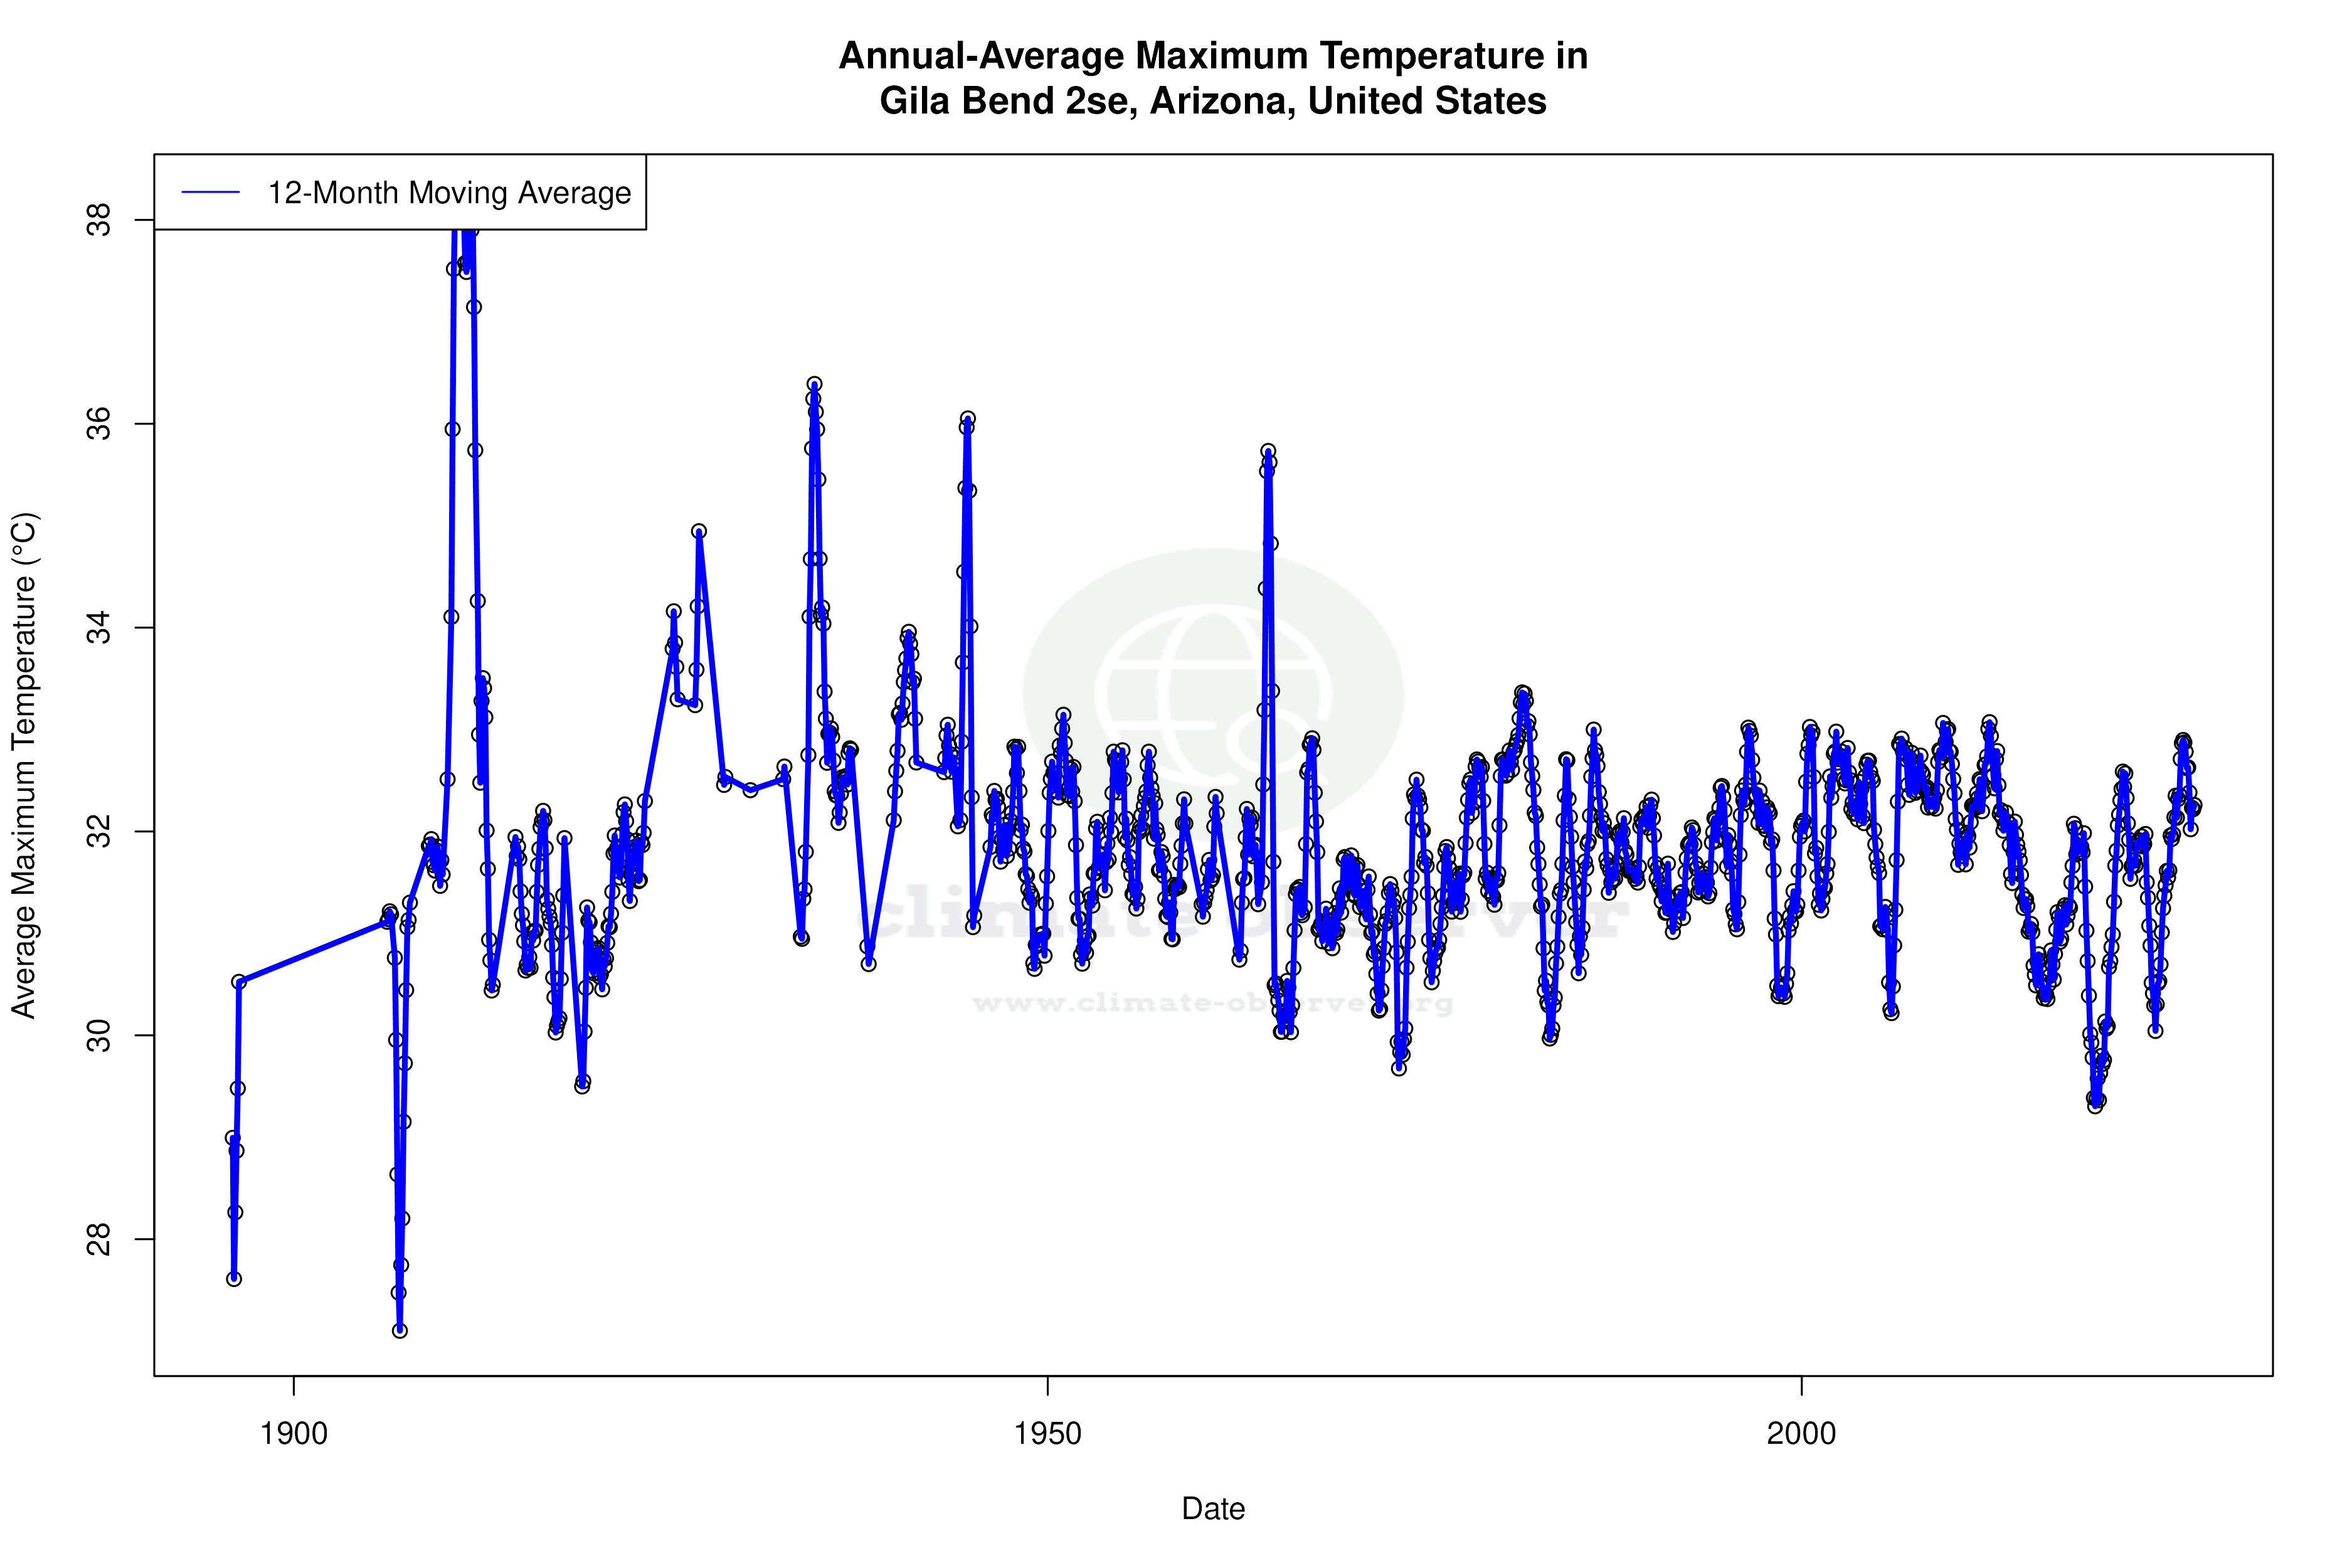


Max Temperature 12-Month MA | 1 of 6
Daily Data Points and Averages Throughout the Year


Average Max Temperature Throughout Year | 1 of 5
