Climate for Station: Lake City 2 e, Florida, United States
Loading live weather...
Climate Analysis & Overview
Lake City 2 e is experiencing a subtle cooling trend over the long term, with a more pronounced drop in low temperatures over the past decade. Precipitation events are becoming slightly more concentrated, potentially impacting local water management strategies.
Subtle Cooling in a Humid Subtropical Climate
Lake City, Florida, classified under the Köppen climate system as humid subtropical, typically experiences hot, humid summers and mild winters. This climate is influenced by its proximity to the Gulf of Mexico, which moderates temperatures and contributes to its precipitation patterns. Over the long term, Lake City 2 e has shown a slight cooling trend, with all-time high temperatures decreasing by 0.03°C (0.05°F) and low temperatures by 0.04°C (0.07°F). The 10-year data, however, reveals a more significant cooling in low temperatures, dropping by 1.56°C (2.81°F), while high temperatures decreased by 0.27°C (0.48°F). These changes may reflect broader regional climate dynamics and warrant attention for future climate adaptation strategies.
Temperature Extremes and Historical Records
Lake City has experienced notable temperature extremes, with a record high of 41.1°C (105.98°F) and a record low of -14.4°C (6.08°F). These extremes highlight the variability inherent in the region's climate. While the long-term cooling trend is subtle, the recent decade's more pronounced decrease in low temperatures could suggest shifts in local weather patterns, potentially affecting agriculture and energy consumption.
Shifting Precipitation Patterns
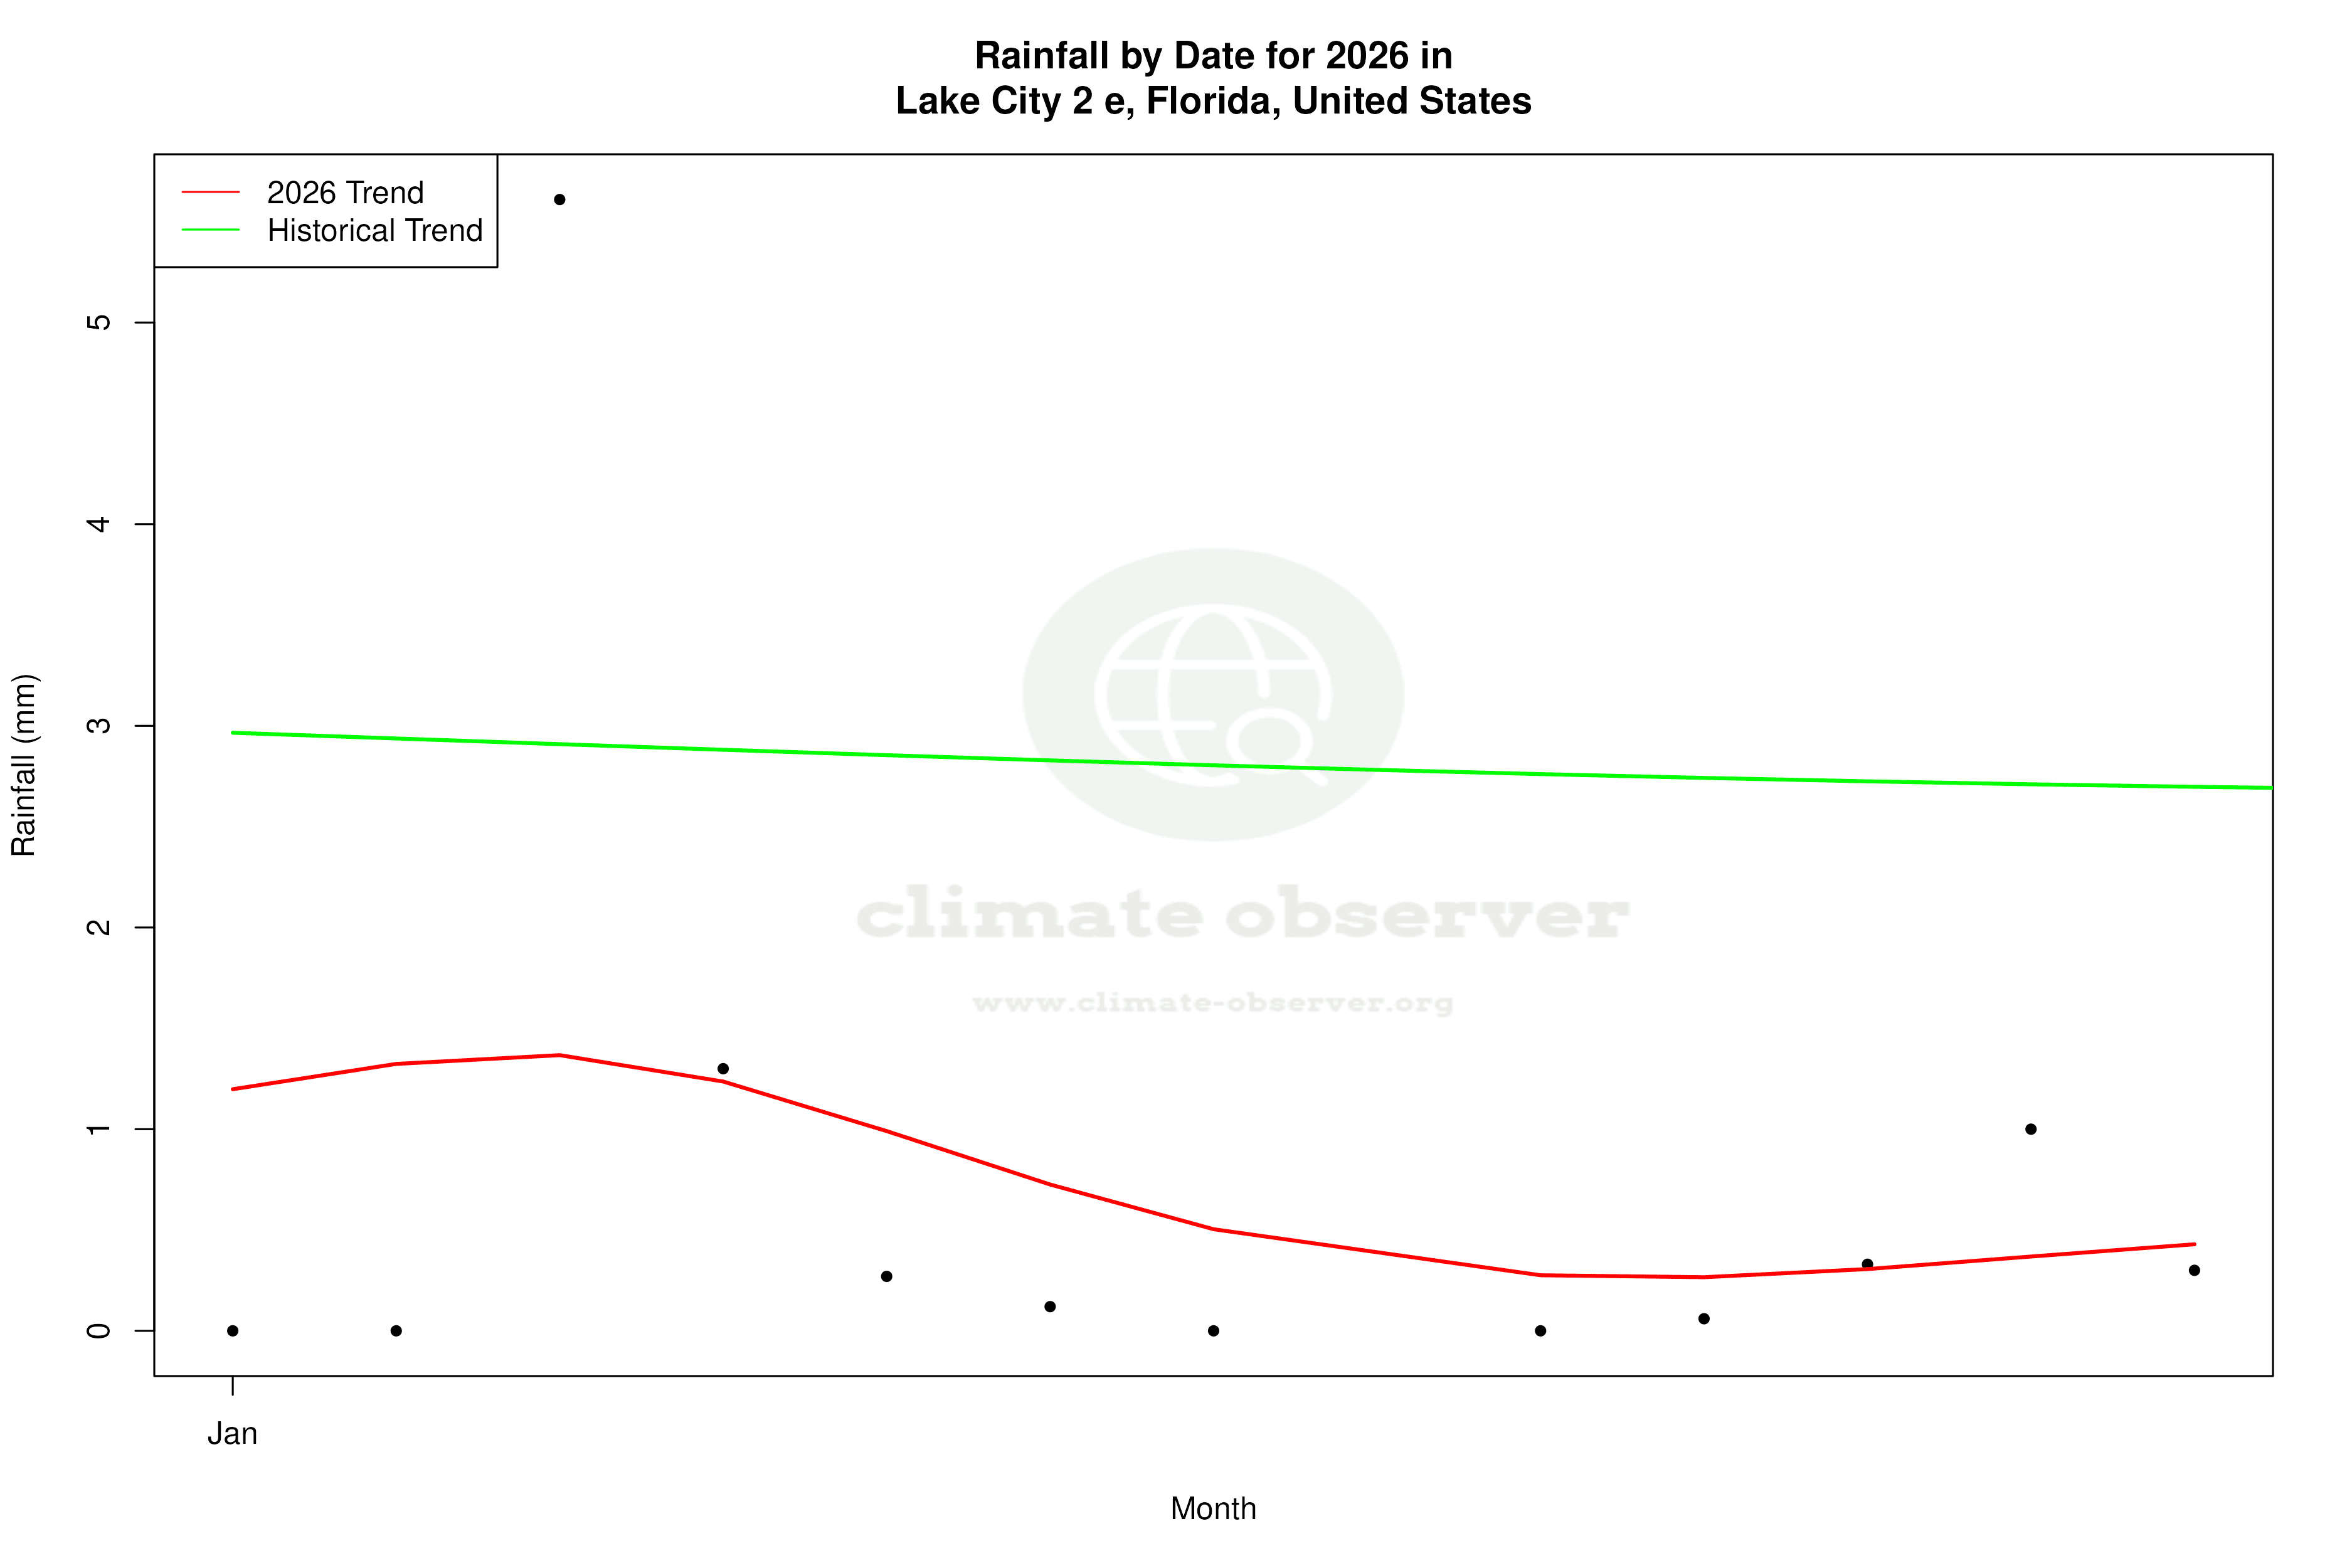
The Precipitation Concentration Index (PCI) for Lake City 2 e has experienced a slight increase from a baseline of 12.38 to 12.84. This indicates that precipitation is becoming marginally more concentrated in fewer events, which could lead to challenges in water management and flood risk mitigation. A PCI above 20 would indicate highly concentrated precipitation, but the current values suggest a moderate concentration level. This change, while slight, should be monitored as it may affect local ecosystems and infrastructure.
Regional Implications and Climate Goals
The observed trends in Lake City align with broader patterns in the southeastern United States, where climate variability poses challenges to regional climate goals. Efforts to reduce greenhouse gas emissions and implement sustainable water management practices are crucial in adapting to these changes. Recent weather events, such as hurricanes and tropical storms, further underscore the importance of understanding and responding to evolving climate dynamics in the region.
Station Statistics
10-Year Trend
High: -0.15 °F/decade
Low: -2.81 °F/decade
Rain: -0.041 in/decade
25-Year Trend
High: +0.36 °F/decade
Low: +0.09 °F/decade
Rain: -0.004 in/decade
50-Year Trend
High: +0.17 °F/decade
Low: +0.47 °F/decade
Rain: -0.004 in/decade
All-Time Trend
High: -0.06 °F/decade
Low: -0.06 °F/decade
Rain: +0.000 in/decade
Percentage Above-Average Days
Last 12 Months: 61.9%
This Year: 71.0%
Precipitation Concentration Index (PCI) ℹ️
Last 12 Months: 14.0
Historical Average: 11.8
Percentile Rank of Last 12 Months ℹ️
High: 72nd percentile
Low: 39th percentile
Rain: 7th percentile
Change in Variance ℹ️
High: -2.1%
Low: -0.4%
Intraday: -5.2%
Data Coverage
83.0%
First Year of Data
1892
Station Location
Historical Weather Records
| Max High | Avg High | Min High | Max Avg | Avg Avg | Min Avg | Max Low | Avg Low | Min Low | Max Precipitation | Avg Precipitation | Max Snow | Avg Snow | |
|---|---|---|---|---|---|---|---|---|---|---|---|---|---|
| Record | 105.98 °F | — | 28.69 °F | 91.87 °F | — | 21.38 °F | 82.04 °F | — | 6.08 °F | 8.00 in | — | 2.01 in | — |
| January | 89.96 °F | 65.94 °F | 30.92 °F | 72.32 °F | 52.27 °F | 21.38 °F | 69.98 °F | 42.93 °F | 6.98 °F | 4.57 in | 0.11 in | 0.00 in | 0.00 in |
| February | 89.06 °F | 68.75 °F | 32.00 °F | 73.94 °F | 56.41 °F | 29.66 °F | 69.98 °F | 45.09 °F | 6.08 °F | 3.87 in | 0.13 in | 0.98 in | 0.00 in |
| March | 93.92 °F | 75.02 °F | 35.06 °F | 76.87 °F | 61.75 °F | 34.52 °F | 73.94 °F | 50.54 °F | 14.00 °F | 5.80 in | 0.14 in | 0.00 in | 0.00 in |
| April | 96.98 °F | 80.70 °F | 51.98 °F | 82.69 °F | 68.03 °F | 43.21 °F | 73.94 °F | 56.00 °F | 26.06 °F | 4.00 in | 0.10 in | 0.00 in | 0.00 in |
| May | 104.43 °F | 86.96 °F | 64.04 °F | 89.33 °F | 75.67 °F | 58.10 °F | 80.96 °F | 62.87 °F | 37.94 °F | 5.00 in | 0.11 in | 0.00 in | 0.00 in |
| June | 105.98 °F | 90.36 °F | 71.06 °F | 91.87 °F | 79.96 °F | 67.82 °F | 82.04 °F | 69.01 °F | 53.06 °F | 5.11 in | 0.22 in | 2.01 in | 0.00 in |
| July | 102.02 °F | 91.06 °F | 73.04 °F | 90.39 °F | 80.87 °F | 73.40 °F | 82.04 °F | 71.22 °F | 60.08 °F | 4.80 in | 0.23 in | 0.59 in | 0.00 in |
| August | 104.00 °F | 90.91 °F | 73.04 °F | 88.29 °F | 80.26 °F | 72.75 °F | 80.96 °F | 71.24 °F | 60.08 °F | 5.00 in | 0.22 in | 0.00 in | 0.00 in |
| September | 100.94 °F | 87.94 °F | 66.92 °F | 85.37 °F | 77.07 °F | 61.57 °F | 78.98 °F | 68.66 °F | 49.98 °F | 8.00 in | 0.17 in | 0.00 in | 0.00 in |
| October | 96.94 °F | 81.14 °F | 55.94 °F | 83.53 °F | 69.73 °F | 45.48 °F | 77.00 °F | 59.50 °F | 32.00 °F | 5.52 in | 0.09 in | 0.00 in | 0.00 in |
| November | 91.04 °F | 73.33 °F | 39.92 °F | 78.33 °F | 61.45 °F | 37.81 °F | 73.94 °F | 50.20 °F | 17.96 °F | 5.67 in | 0.07 in | 0.00 in | 0.00 in |
| December | 98.06 °F | 67.20 °F | 28.69 °F | 74.25 °F | 55.45 °F | 22.42 °F | 71.96 °F | 44.63 °F | 8.96 °F | 5.85 in | 0.10 in | 0.00 in | 0.00 in |
Data Visualisations
Remove WatermarksCurrent Year Climate Trends vs Historical

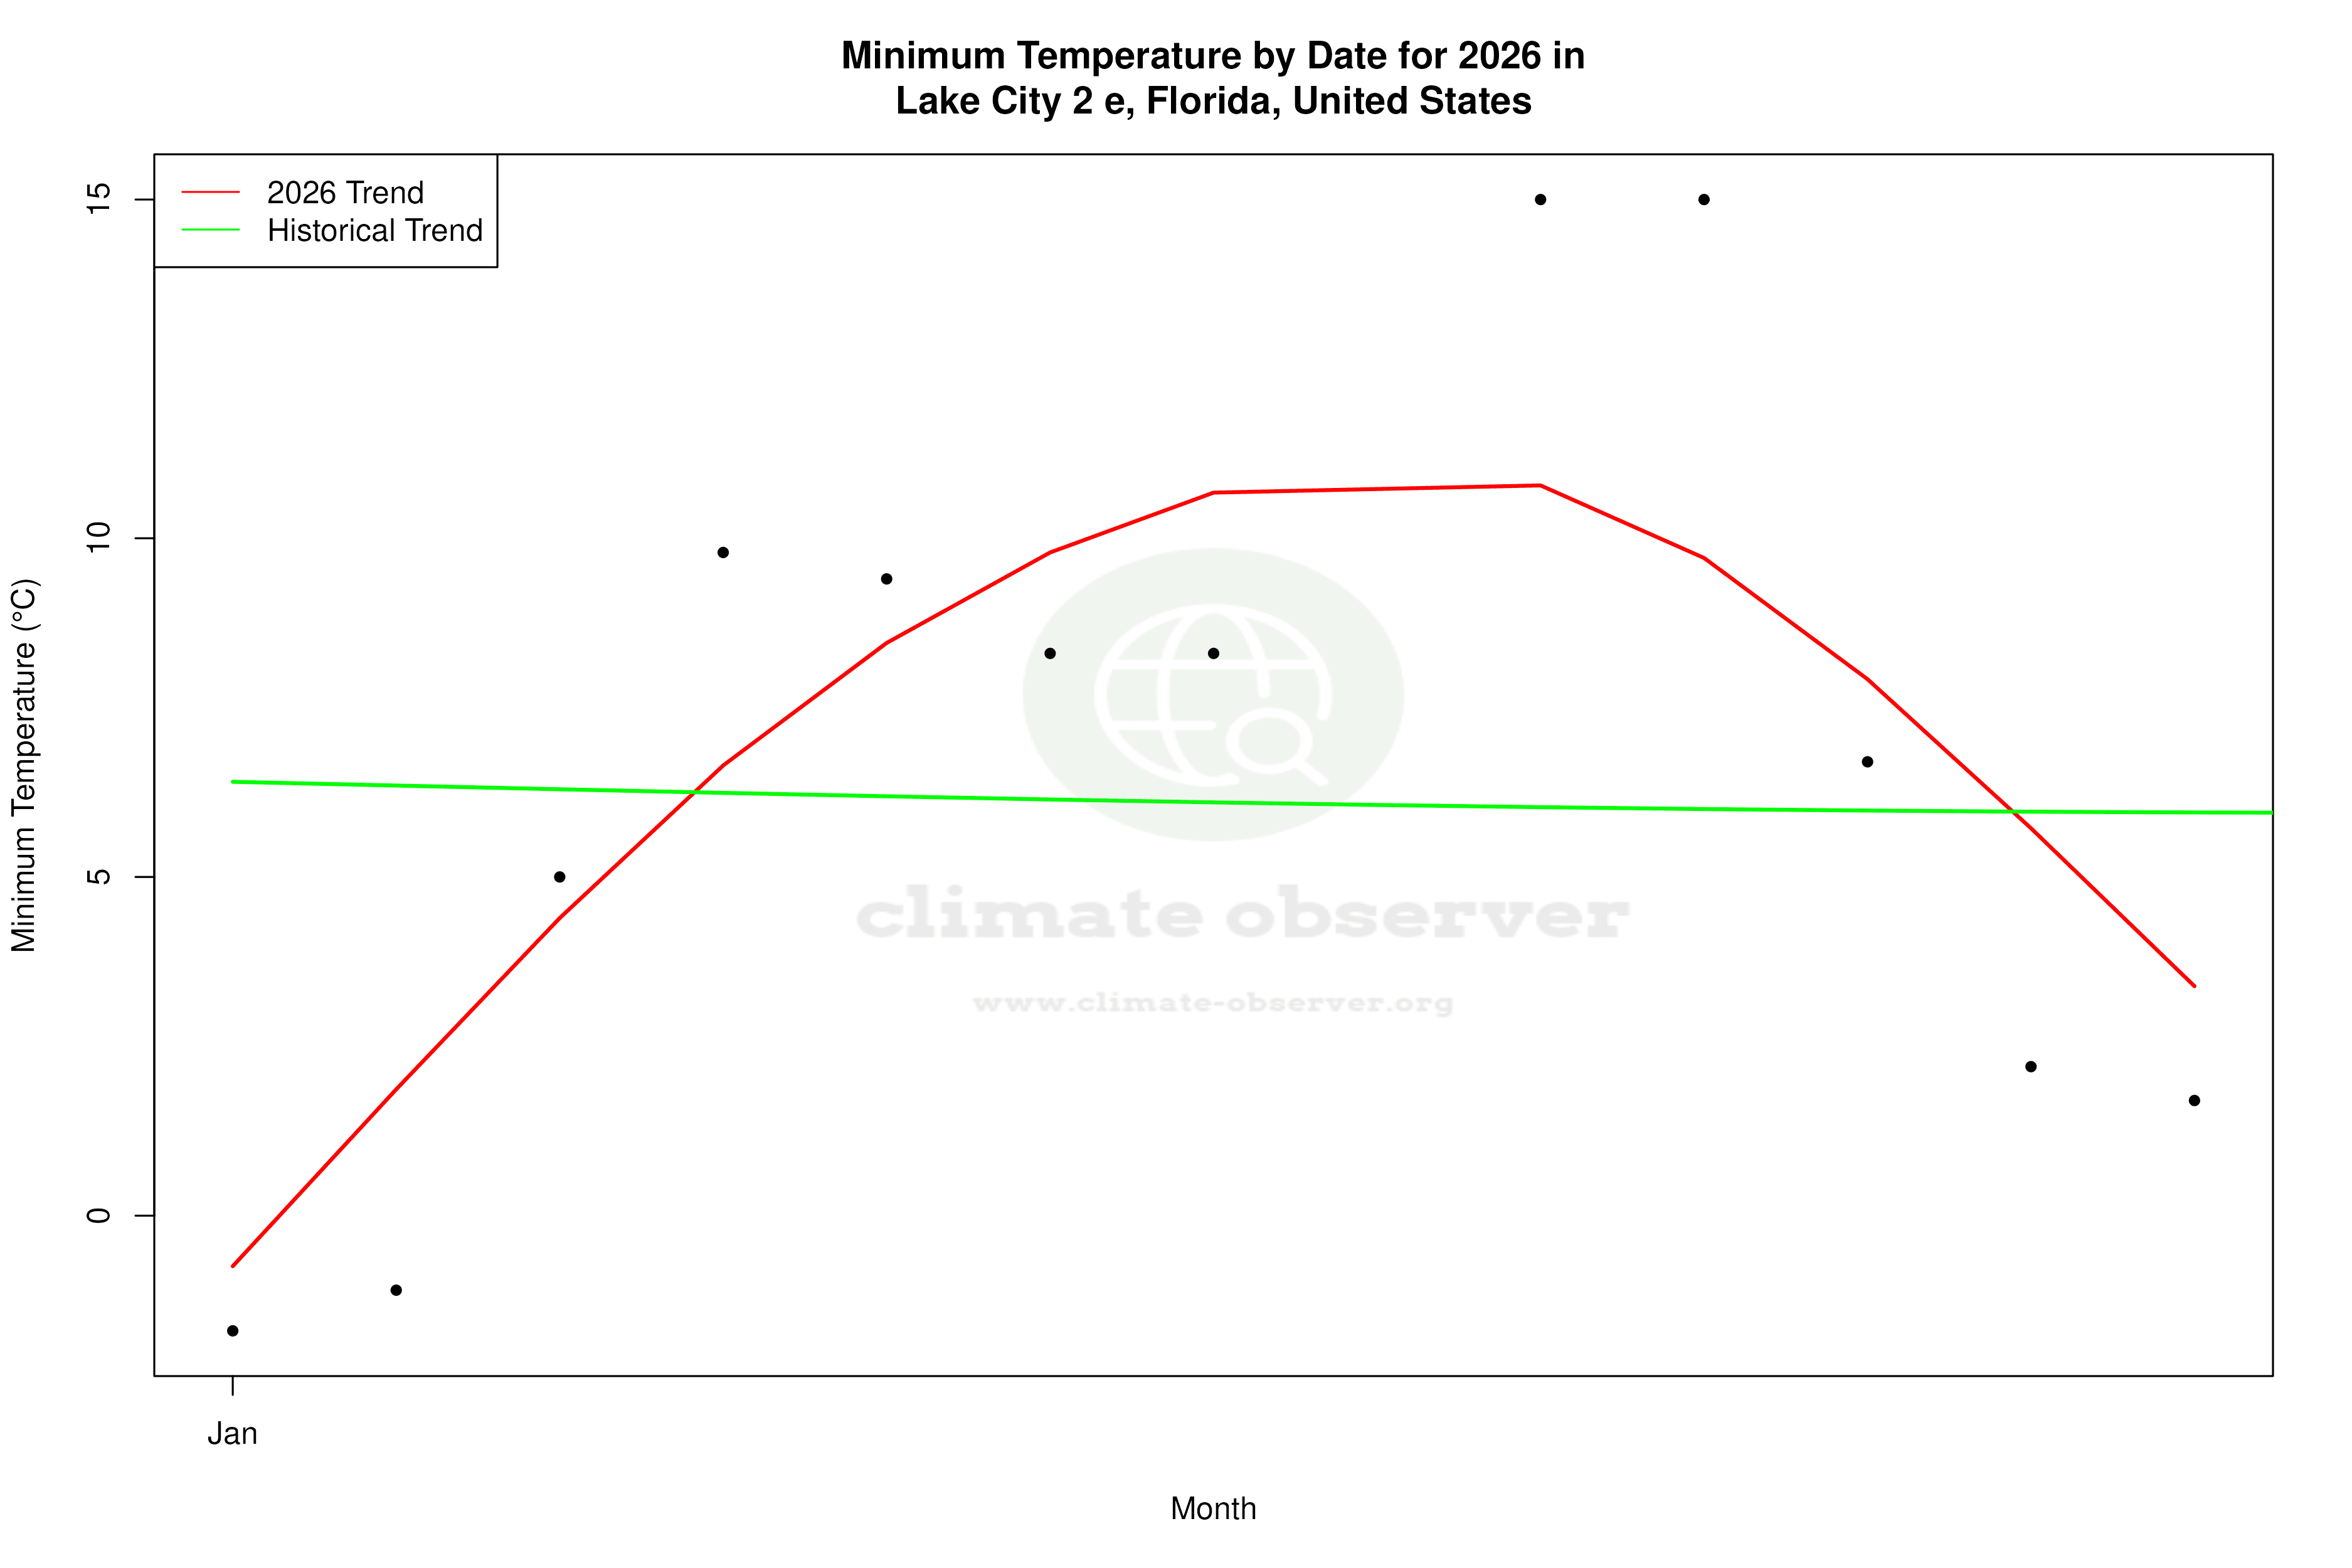


Max Temperature this Year | 1 of 6
Climate 12-Month Moving Averages
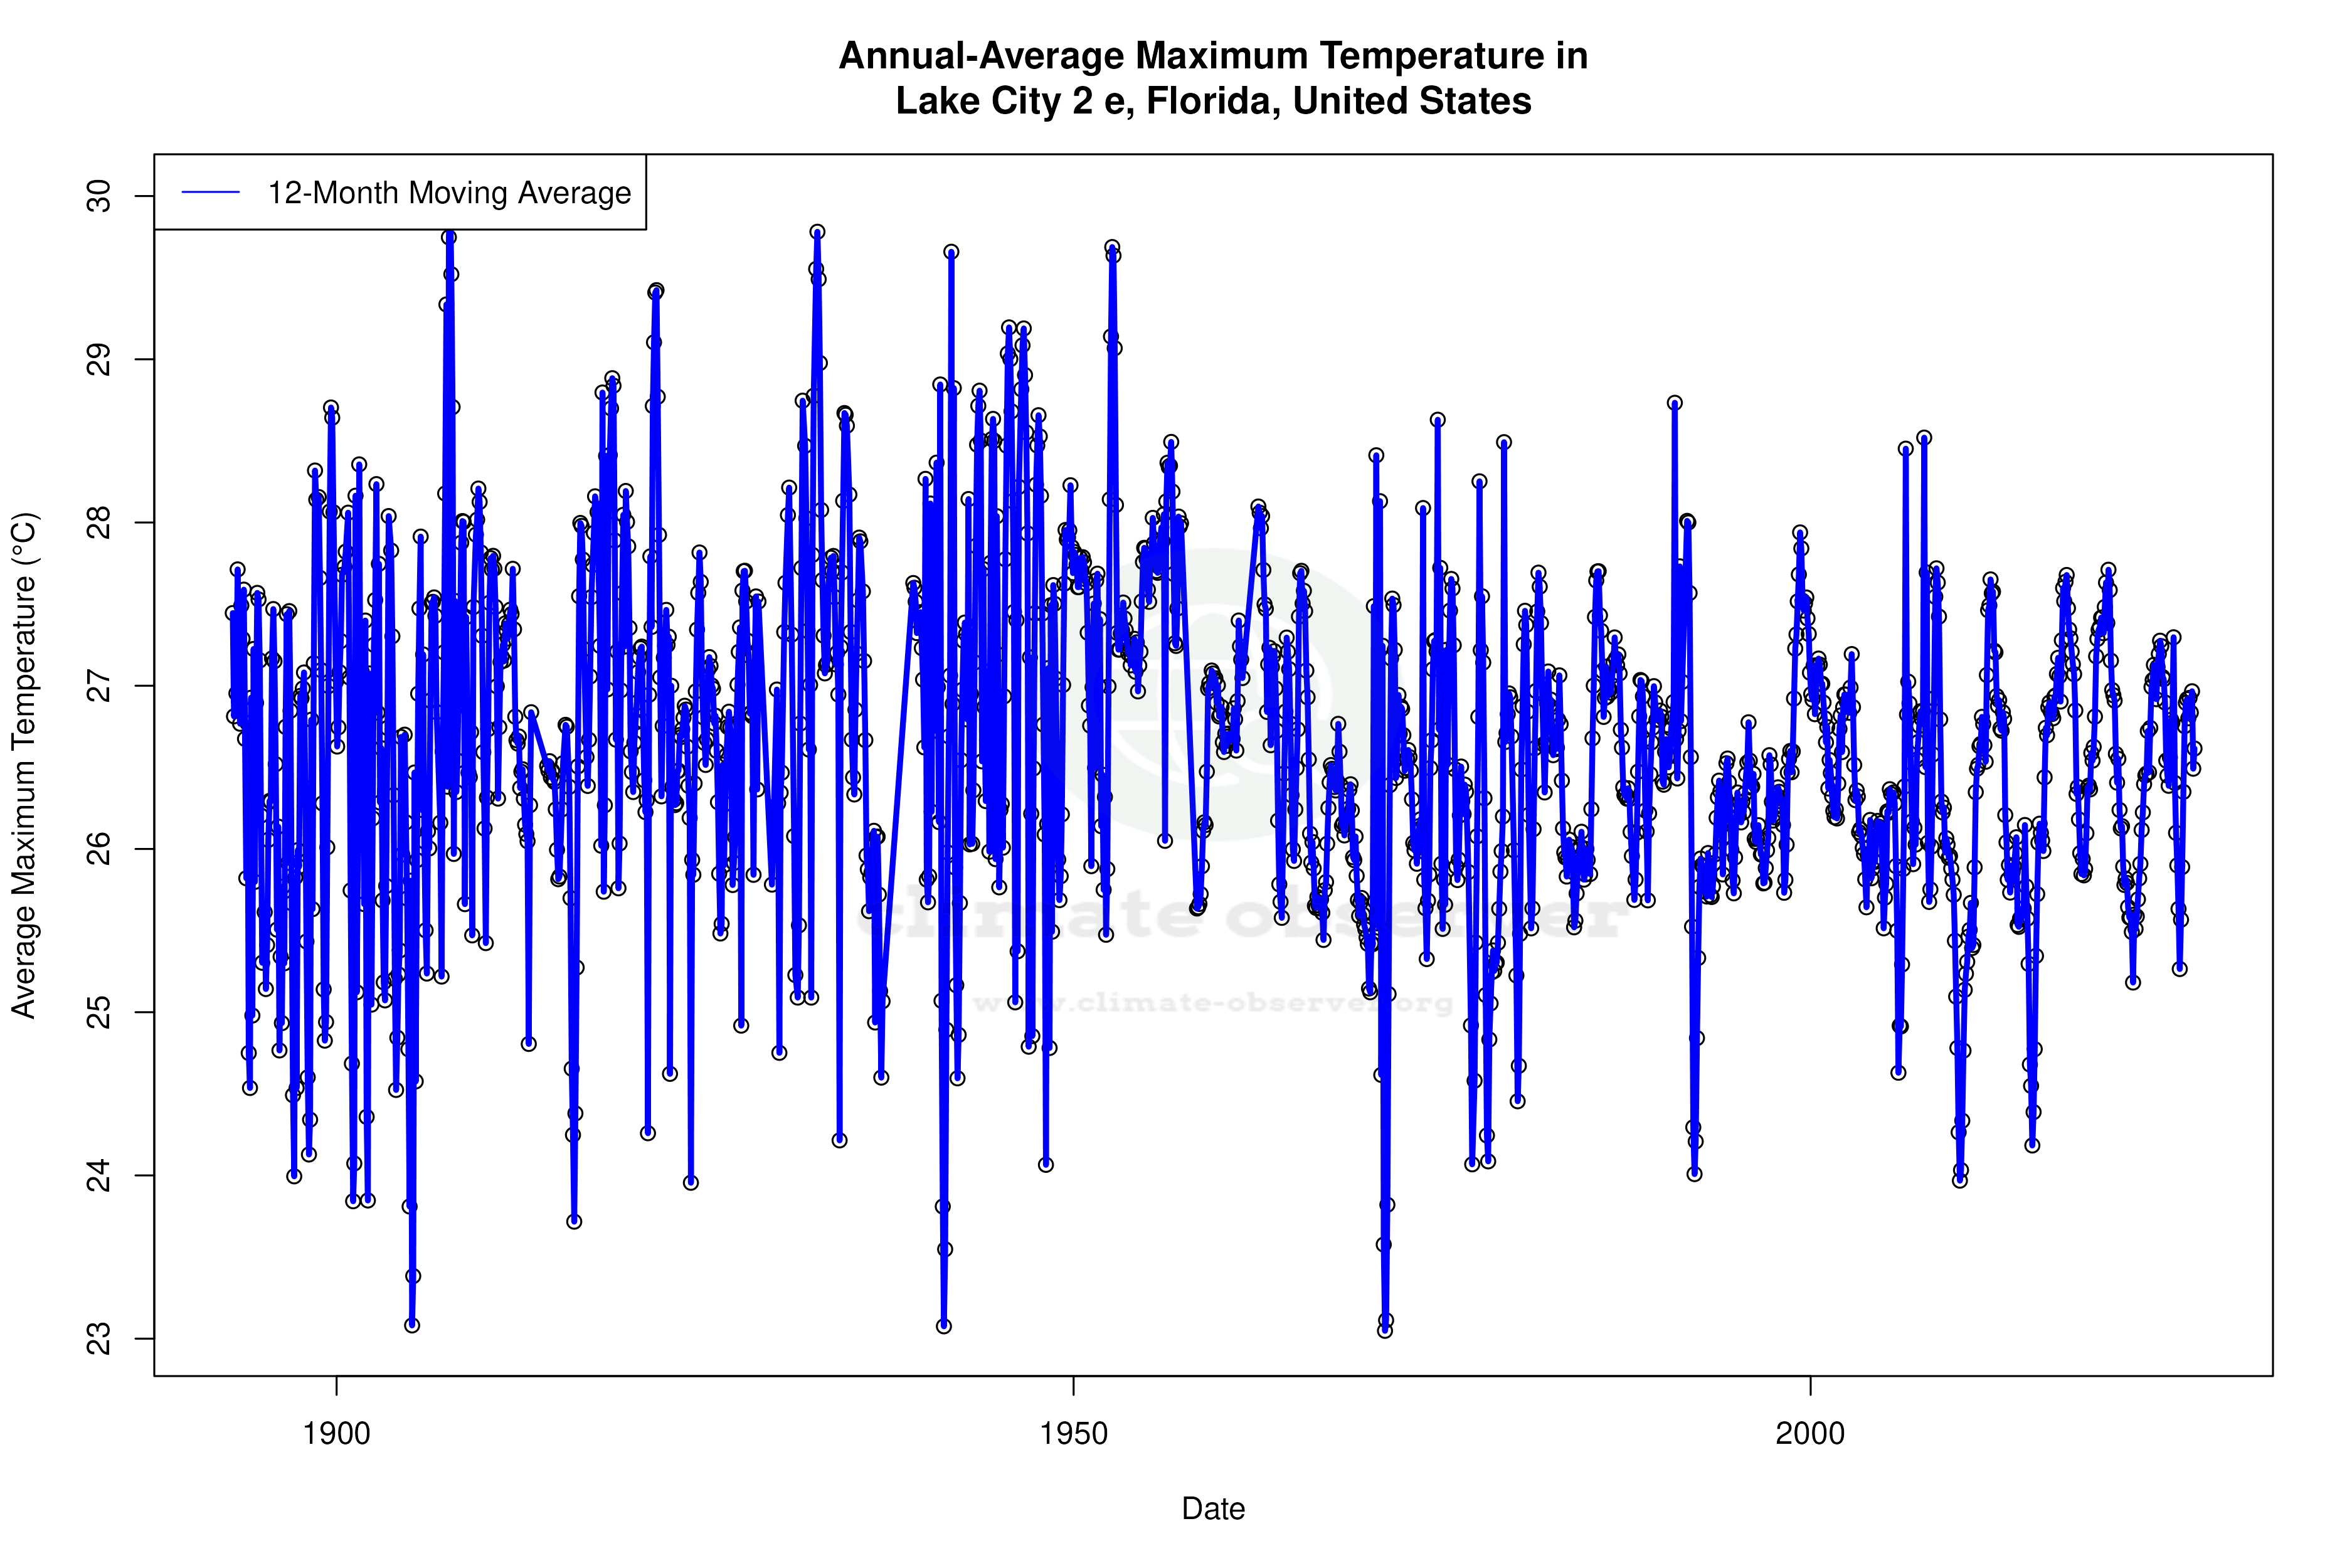


Max Temperature 12-Month MA | 1 of 6
Daily Data Points and Averages Throughout the Year


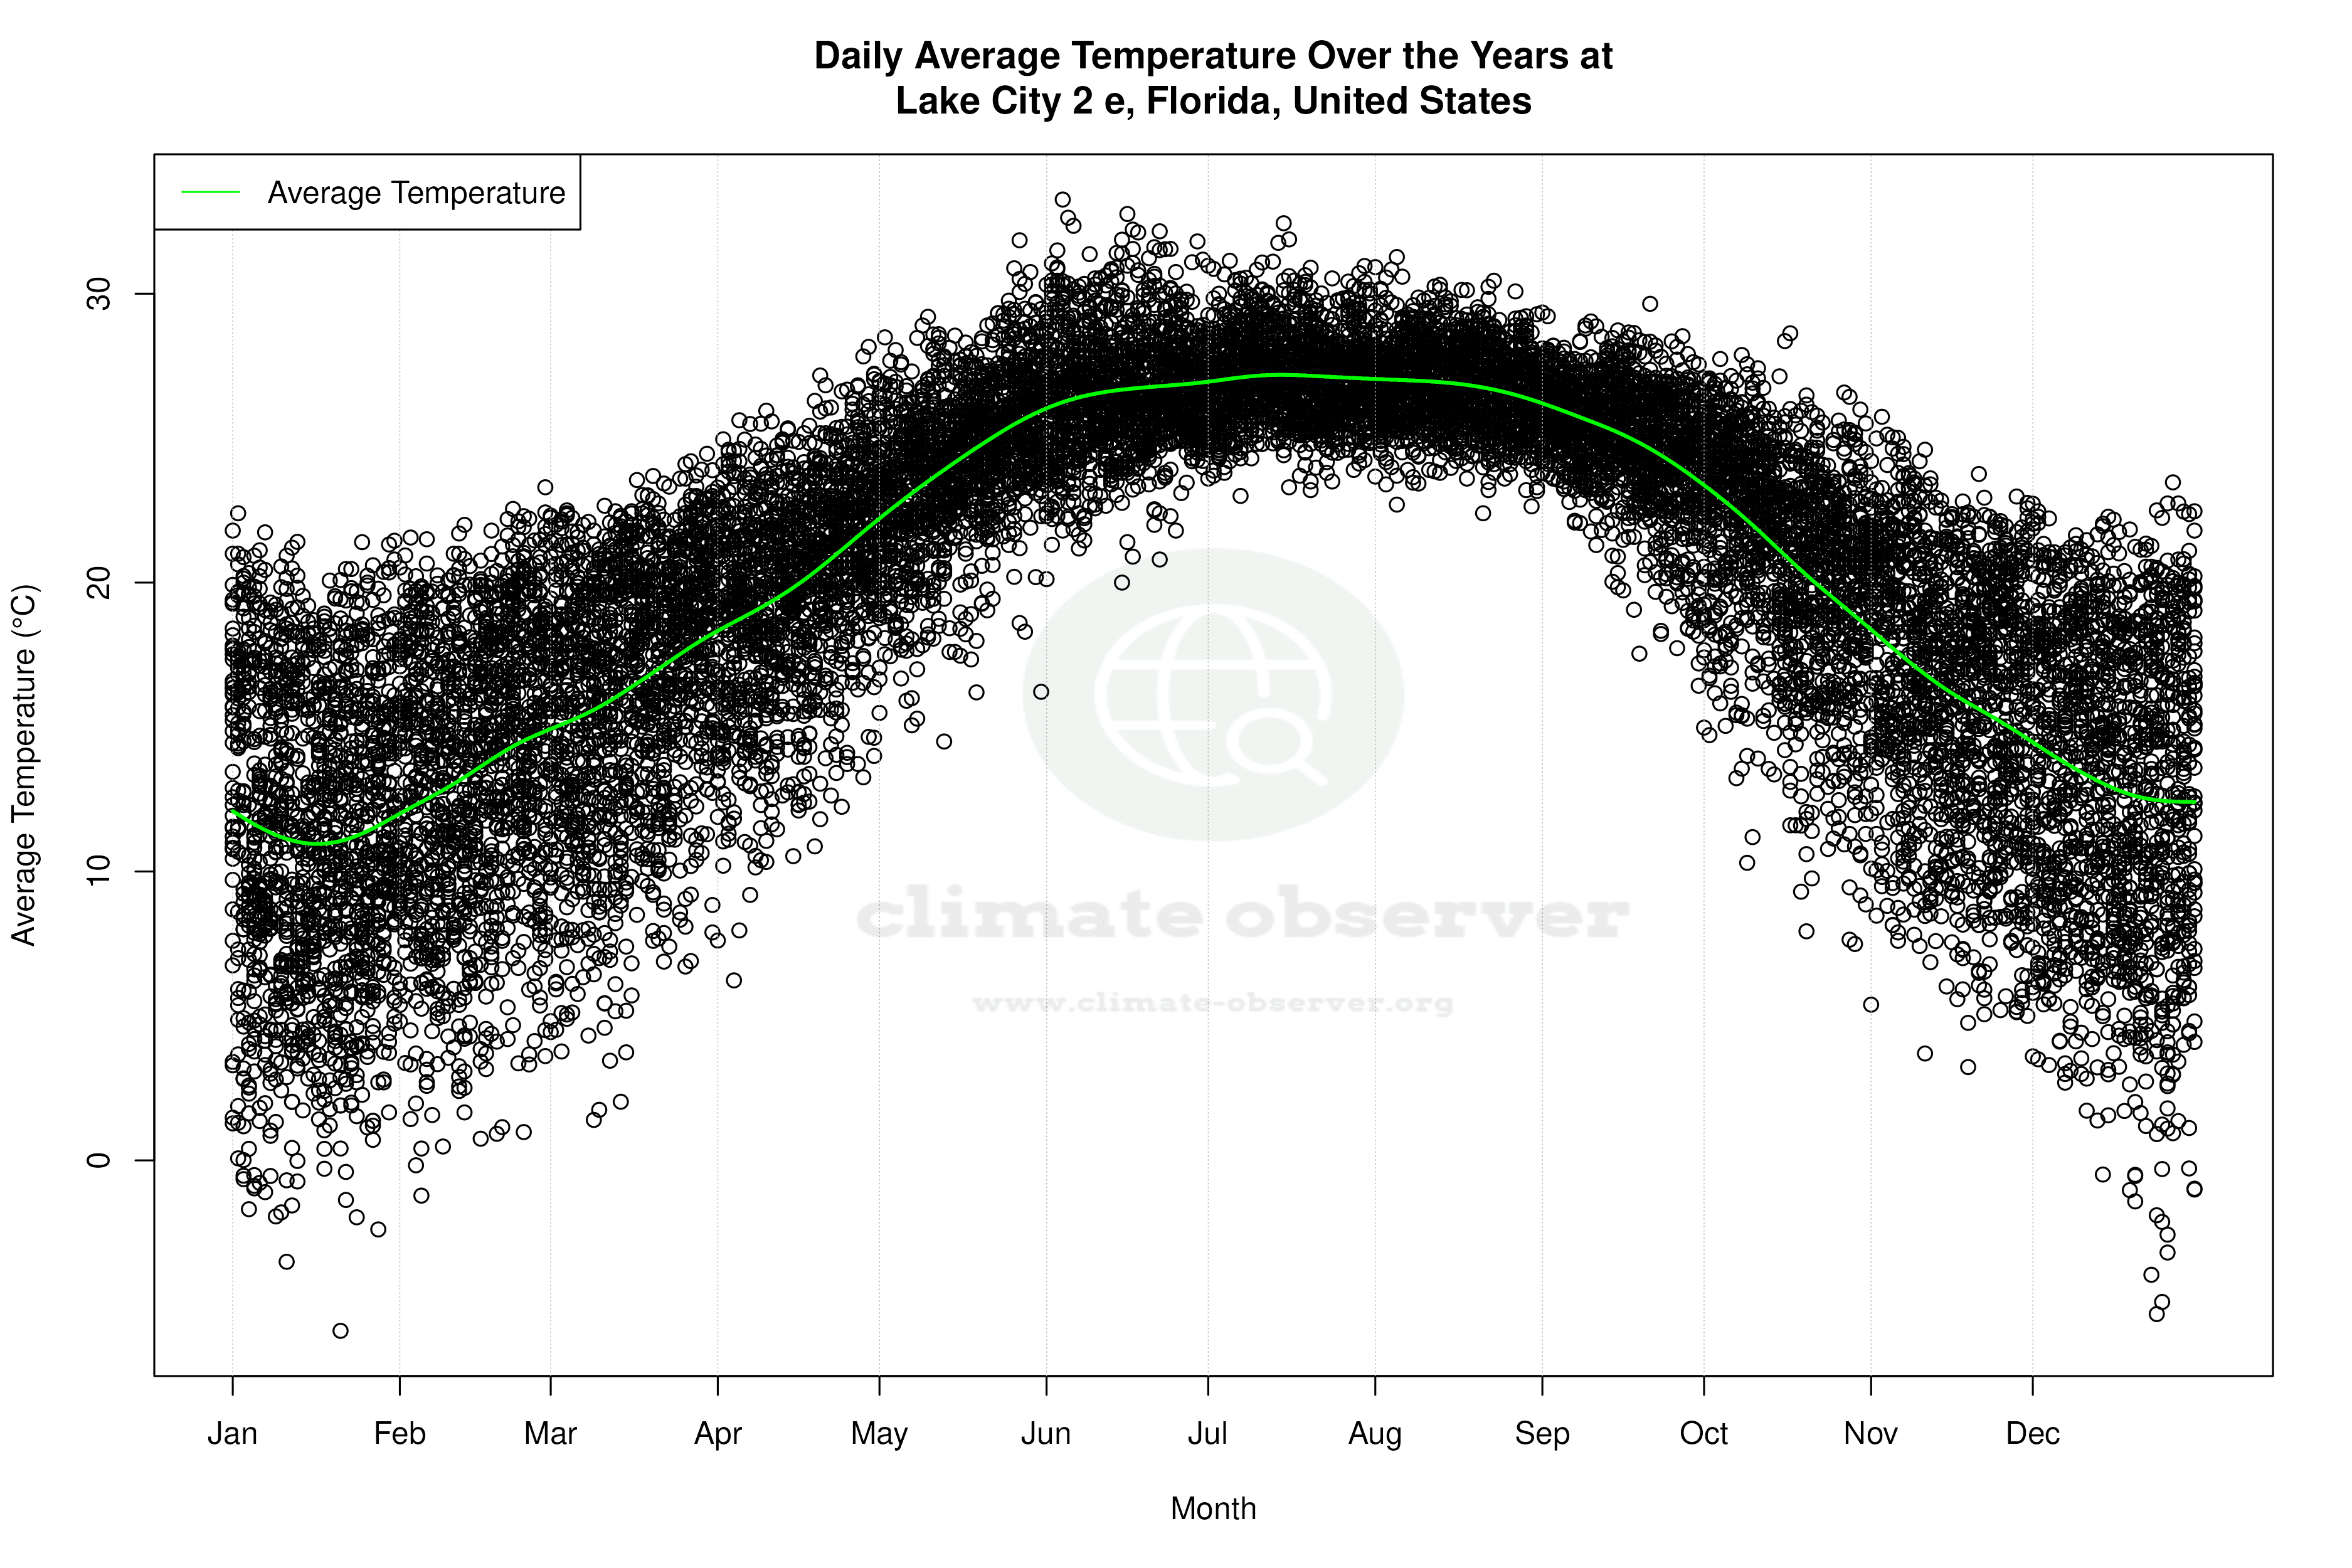


Average Max Temperature Throughout Year | 1 of 5
