Climate for Station: Perry, Florida, United States
Loading live weather...
Climate Analysis & Overview
The climate profile for Perry, Florida, reveals a nuanced picture of thermal shifts and precipitation patterns. While long-term data indicates a slight warming trend, recent years have shown a contrasting cooling in high temperatures, suggesting complex regional dynamics. Precipitation has become slightly more evenly distributed, aligning with broader climate goals for resilience.
Climate Classification and Geography
Perry, located in Taylor County, Florida, is characterised by a humid subtropical climate (Köppen classification Cfa). This classification is marked by hot, humid summers and mild winters, typical of the southeastern United States. The proximity to the Gulf of Mexico influences Perry's climate, moderating temperatures and contributing to its humidity levels. The region's flat topography and coastal proximity also play a role in its precipitation patterns, which are generally abundant throughout the year.
Temperature Trends and Anomalies
Examining the temperature trends, Perry has experienced a long-term warming in low temperatures, with an all-time rise of 0.13°C (0.23°F). This suggests milder winters over the decades. Conversely, the high temperatures show a negligible all-time increase of 0.06°C (0.11°F), indicating relative stability over the long term. However, the past decade reveals a stark contrast, with high temperatures exhibiting a cooling trend of -2.33°C (4.19°F), while low temperatures have risen by 1.74°C (3.13°F). This divergence may reflect regional climatic variability and warrants further investigation into localised atmospheric conditions.
Precipitation Patterns
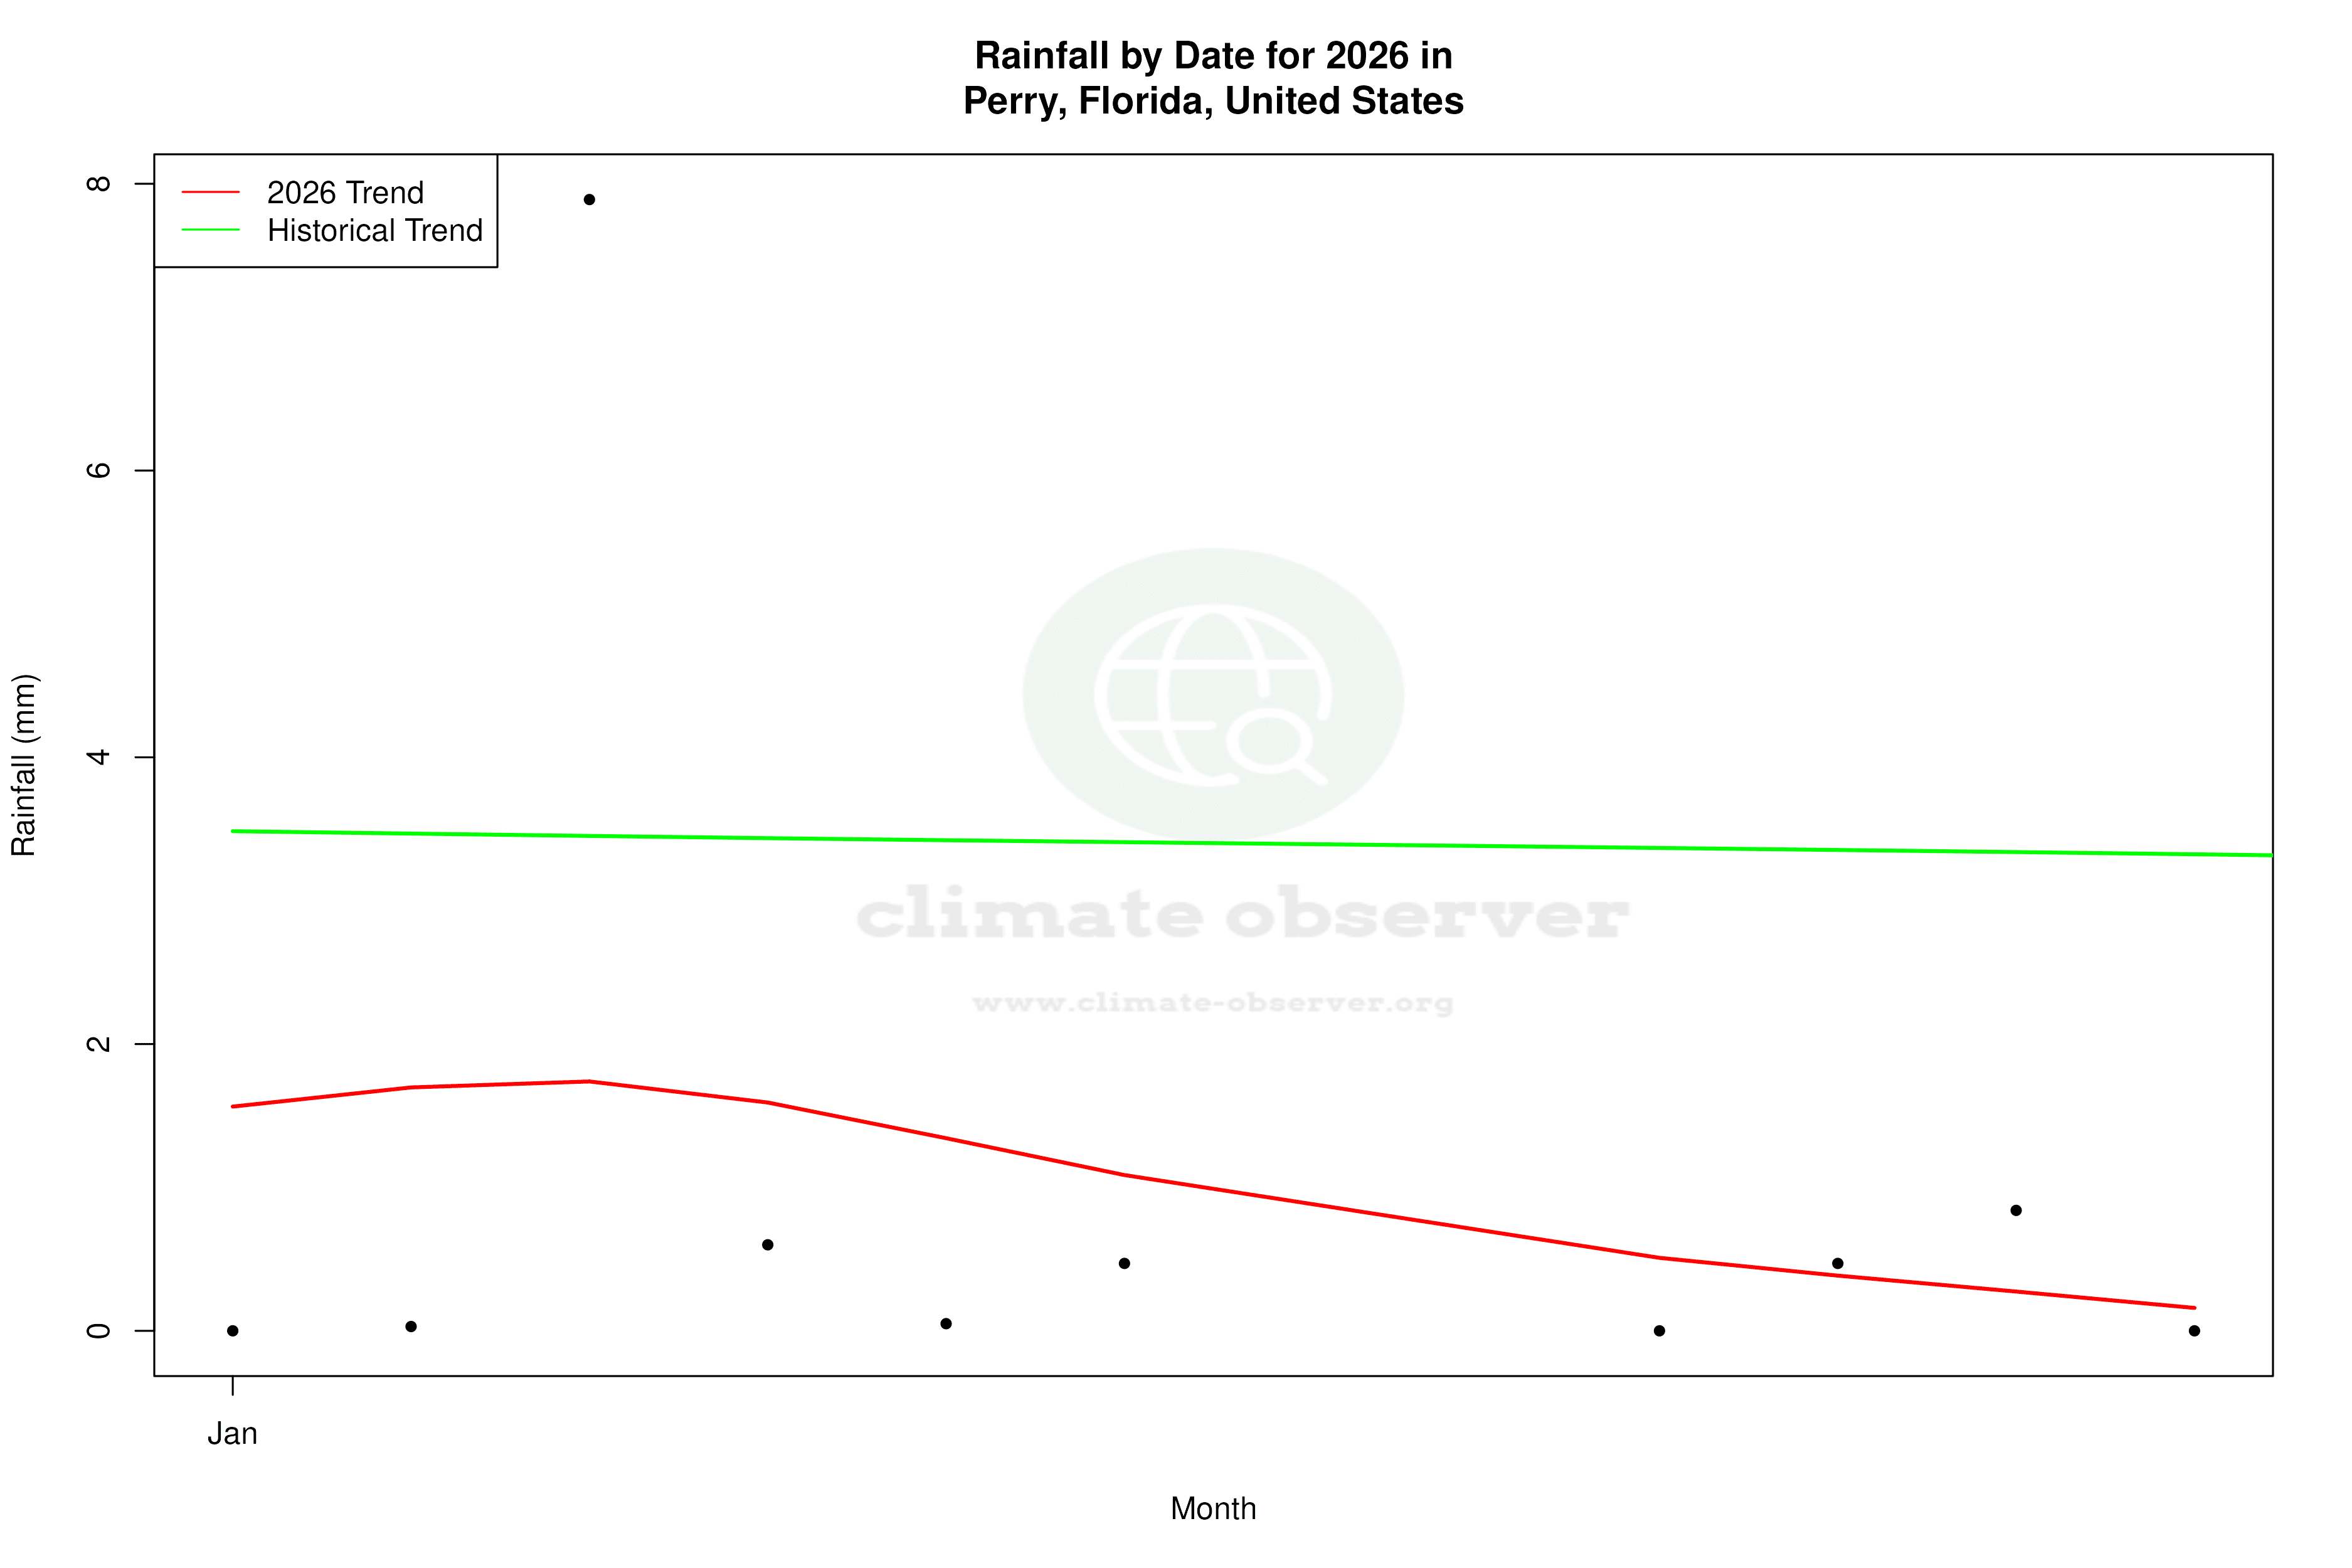
The Precipitation Concentration Index (PCI) for Perry has shown a marginal decrease from a baseline of 12.56 to a current value of 12.28. This slight reduction indicates that rainfall events are becoming more evenly distributed throughout the year, which can be beneficial for water resource management and agricultural planning. The PCI, a measure of how precipitation is distributed over time, suggests that Perry is experiencing less variability in rainfall intensity, aligning with efforts to mitigate the impacts of extreme weather events.
Temperature Extremes
Perry's historical temperature records highlight the extremes experienced in this region. The highest recorded temperature is 40.0°C (104.0°F), while the lowest is -15.6°C (3.9°F). These figures underscore the range of thermal conditions that can occur, influenced by both seasonal changes and occasional cold fronts or heatwaves.
Regional Implications and Goals
The observed climatic changes in Perry are consistent with broader regional trends in the southeastern United States, where efforts are underway to enhance climate resilience. The slight evening out of precipitation patterns aligns with national goals to reduce the impact of severe weather events. As these trends continue to evolve, they will play a critical role in shaping local adaptation strategies and informing policy decisions.
Station Statistics
10-Year Trend
High: -4.36 °F/decade
Low: +3.41 °F/decade
Rain: -0.026 in/decade
25-Year Trend
High: -0.24 °F/decade
Low: +3.01 °F/decade
Rain: +0.008 in/decade
50-Year Trend
High: -0.34 °F/decade
Low: +1.12 °F/decade
Rain: -0.004 in/decade
All-Time Trend
High: +0.10 °F/decade
Low: +0.24 °F/decade
Rain: -0.001 in/decade
Percentage Above-Average Days
Last 12 Months: 46.3%
This Year: 24.7%
Precipitation Concentration Index (PCI) ℹ️
Last 12 Months: 13.6
Historical Average: 12.2
Percentile Rank of Last 12 Months ℹ️
High: 5th percentile
Low: 98th percentile
Rain: 11th percentile
Change in Variance ℹ️
High: -8.8%
Low: -11.9%
Intraday: -18.6%
Data Coverage
87.0%
First Year of Data
1897
Station Location
Historical Weather Records
| Max High | Avg High | Min High | Max Avg | Avg Avg | Min Avg | Max Low | Avg Low | Min Low | Max Precipitation | Avg Precipitation | Max Snow | Avg Snow | |
|---|---|---|---|---|---|---|---|---|---|---|---|---|---|
| Record | 104.00 °F | — | 33.98 °F | 88.84 °F | — | 25.56 °F | 87.08 °F | — | 3.92 °F | 10.50 in | — | 2.99 in | — |
| January | 84.92 °F | 66.47 °F | 35.06 °F | 74.12 °F | 53.46 °F | 25.56 °F | 73.94 °F | 42.03 °F | 3.92 °F | 4.35 in | 0.13 in | 0.00 in | 0.00 in |
| February | 87.98 °F | 69.51 °F | 39.92 °F | 73.58 °F | 56.87 °F | 32.56 °F | 78.98 °F | 44.44 °F | 14.00 °F | 4.10 in | 0.14 in | 2.99 in | 0.00 in |
| March | 89.96 °F | 75.16 °F | 46.04 °F | 77.36 °F | 61.89 °F | 36.93 °F | 75.92 °F | 49.50 °F | 19.04 °F | 6.06 in | 0.15 in | 0.00 in | 0.00 in |
| April | 95.00 °F | 81.02 °F | 59.00 °F | 79.16 °F | 67.84 °F | 46.90 °F | 80.06 °F | 55.29 °F | 28.94 °F | 6.86 in | 0.11 in | 0.00 in | 0.00 in |
| May | 100.04 °F | 86.98 °F | 65.10 °F | 84.74 °F | 75.42 °F | 58.68 °F | 87.08 °F | 62.69 °F | 39.92 °F | 5.45 in | 0.12 in | 0.00 in | 0.00 in |
| June | 102.92 °F | 90.46 °F | 73.94 °F | 88.84 °F | 80.40 °F | 69.08 °F | 86.00 °F | 69.42 °F | 51.08 °F | 10.50 in | 0.23 in | 0.00 in | 0.00 in |
| July | 104.00 °F | 91.43 °F | 73.04 °F | 88.72 °F | 81.91 °F | 73.76 °F | 82.40 °F | 71.71 °F | 60.08 °F | 10.26 in | 0.27 in | 0.00 in | 0.00 in |
| August | 102.02 °F | 91.37 °F | 77.72 °F | 88.25 °F | 81.59 °F | 73.27 °F | 82.80 °F | 71.62 °F | 60.08 °F | 5.85 in | 0.26 in | 0.00 in | 0.00 in |
| September | 98.96 °F | 89.19 °F | 71.06 °F | 86.36 °F | 78.39 °F | 64.81 °F | 84.92 °F | 68.53 °F | 48.92 °F | 6.52 in | 0.19 in | 0.00 in | 0.00 in |
| October | 95.00 °F | 82.82 °F | 57.92 °F | 82.69 °F | 71.02 °F | 48.31 °F | 82.94 °F | 58.28 °F | 28.04 °F | 5.39 in | 0.08 in | 0.00 in | 0.00 in |
| November | 93.02 °F | 75.22 °F | 44.96 °F | 80.24 °F | 62.61 °F | 36.32 °F | 77.00 °F | 49.29 °F | 14.00 °F | 4.78 in | 0.09 in | 0.00 in | 0.00 in |
| December | 89.06 °F | 68.78 °F | 33.98 °F | 75.56 °F | 56.73 °F | 27.14 °F | 73.94 °F | 43.86 °F | 10.04 °F | 3.70 in | 0.11 in | 0.00 in | 0.00 in |
Data Visualisations
Remove WatermarksCurrent Year Climate Trends vs Historical


Max Temperature this Year | 1 of 6
Climate 12-Month Moving Averages


Max Temperature 12-Month MA | 1 of 6
Daily Data Points and Averages Throughout the Year


Average Max Temperature Throughout Year | 1 of 5
