Climate for Station: Oakley, Idaho, United States
Loading live weather...
Climate Analysis & Overview
Oakley, Idaho, is experiencing subtle shifts in its climate profile, with a slight cooling trend in high temperatures over the long term, contrasted by a warming in lows. Recent data reveals a marginal change in precipitation distribution, suggesting a more even spread of rainfall events.
Subtle Cooling Amidst Warming Lows
Oakley, located in Cassia County, Idaho, sits within a semi-arid climate zone, characterised by hot, dry summers and cold, snowy winters. The all-time temperature trends reveal a slight cooling in high temperatures, with a fall of 0.04°C (0.07°F). This cooling contrasts with a warming trend in low temperatures, which have risen by 0.14°C (0.25°F). This divergence suggests a narrowing of the diurnal temperature range, possibly influenced by local geographical features such as the nearby Albion Mountains, which can modulate air flow and temperature variations.
Decadal Dynamics: A Different Picture
While the all-time data indicates cooling in highs, the last decade shows a warming trend, with highs increasing by 0.69°C (1.24°F) and lows by 0.70°C (1.26°F). This recent warming could be attributed to broader regional climate patterns, including increased greenhouse gas concentrations and changes in land use. Such trends align with the United States' climate goals of understanding and mitigating the impacts of climate change, highlighting the importance of continuous monitoring.
Precipitation Patterns: A Marginal Shift
The Precipitation Concentration Index (PCI) for Oakley has seen a slight decrease from a baseline of 13.84 to a current value of 13.80. This marginal change indicates a more even distribution of precipitation events, suggesting that rainfall is becoming less concentrated in fewer, more intense events. This subtle shift could have implications for local agriculture and water resource management, as more evenly distributed rainfall can reduce the risk of flooding and improve soil moisture retention.
Record Extremes: A Tale of Contrasts
Oakley's climate extremes are marked by a record high of 42.2°C (108.0°F) and a record low of -32.2°C (-26.0°F). These extremes underscore the region's susceptibility to significant temperature fluctuations, driven by its semi-arid climate and elevation. Such variability can pose challenges for local communities, particularly in terms of energy demand and agricultural productivity.
Regional Implications and Future Monitoring
As Oakley navigates these climatic changes, the interplay between long-term cooling and recent warming trends will be crucial in shaping its future climate resilience. Understanding these dynamics is essential for local policymakers and stakeholders, especially in light of recent weather events that have tested the region's infrastructure and adaptive capacity. Continued observation and analysis will be vital for aligning local actions with broader regional climate objectives.
Station Statistics
10-Year Trend
High: +0.37 °F/decade
Low: +0.70 °F/decade
Rain: -0.014 in/decade
25-Year Trend
High: +0.63 °F/decade
Low: +0.88 °F/decade
Rain: +0.003 in/decade
50-Year Trend
High: +0.46 °F/decade
Low: +0.58 °F/decade
Rain: +0.001 in/decade
All-Time Trend
High: -0.05 °F/decade
Low: +0.25 °F/decade
Rain: +0.001 in/decade
Percentage Above-Average Days
Last 12 Months: 54.2%
This Year: 71.9%
Precipitation Concentration Index (PCI) ℹ️
Last 12 Months: 12.7
Historical Average: 14.2
Percentile Rank of Last 12 Months ℹ️
High: 90th percentile
Low: 97th percentile
Rain: 18th percentile
Change in Variance ℹ️
High: -3.3%
Low: +3.8%
Intraday: -19.3%
Data Coverage
74.4%
First Year of Data
1914
Station Location
Historical Weather Records
| Max High | Avg High | Min High | Max Avg | Avg Avg | Min Avg | Max Low | Avg Low | Min Low | Max Precipitation | Avg Precipitation | Max Snow | Avg Snow | |
|---|---|---|---|---|---|---|---|---|---|---|---|---|---|
| Record | 107.96 °F | — | -0.94 °F | — | — | — | 89.06 °F | — | -25.96 °F | 1.65 in | — | 15.00 in | — |
| January | 64.04 °F | 38.13 °F | 5.00 °F | — | — | — | 46.04 °F | 19.27 °F | -25.06 °F | 1.00 in | 0.03 in | 14.29 in | 0.23 in |
| February | 69.98 °F | 42.92 °F | -0.04 °F | — | — | — | 46.04 °F | 22.92 °F | -20.92 °F | 1.20 in | 0.03 in | 7.99 in | 0.16 in |
| March | 80.06 °F | 51.12 °F | 21.02 °F | — | — | — | 55.04 °F | 27.88 °F | -2.02 °F | 1.28 in | 0.03 in | 11.50 in | 0.13 in |
| April | 89.96 °F | 59.93 °F | 30.02 °F | — | — | — | 57.02 °F | 33.29 °F | 1.94 °F | 1.25 in | 0.04 in | 15.00 in | 0.07 in |
| May | 98.06 °F | 68.44 °F | 39.92 °F | — | — | — | 68.00 °F | 40.21 °F | 17.06 °F | 1.57 in | 0.05 in | 10.00 in | 0.02 in |
| June | 104.00 °F | 77.52 °F | 42.98 °F | — | — | — | 69.98 °F | 47.22 °F | 24.08 °F | 1.40 in | 0.04 in | 4.61 in | 0.00 in |
| July | 107.96 °F | 86.76 °F | 55.04 °F | — | — | — | 75.92 °F | 54.91 °F | 30.92 °F | 1.25 in | 0.02 in | 0.00 in | 0.00 in |
| August | 107.06 °F | 85.44 °F | 55.04 °F | — | — | — | 89.06 °F | 53.33 °F | 28.04 °F | 1.55 in | 0.02 in | 0.00 in | 0.00 in |
| September | 100.94 °F | 75.95 °F | 41.00 °F | — | — | — | 68.00 °F | 44.73 °F | 17.06 °F | 1.65 in | 0.03 in | 2.01 in | 0.00 in |
| October | 91.04 °F | 64.28 °F | 26.06 °F | — | — | — | 57.92 °F | 36.10 °F | 6.98 °F | 1.51 in | 0.03 in | 7.99 in | 0.02 in |
| November | 77.00 °F | 49.45 °F | 10.04 °F | — | — | — | 55.04 °F | 27.47 °F | -14.08 °F | 1.20 in | 0.03 in | 7.52 in | 0.09 in |
| December | 73.04 °F | 39.69 °F | -0.94 °F | — | — | — | 48.02 °F | 20.71 °F | -25.96 °F | 1.39 in | 0.03 in | 10.98 in | 0.19 in |
Data Visualisations
Remove WatermarksCurrent Year Climate Trends vs Historical


Max Temperature this Year | 1 of 6
Climate 12-Month Moving Averages


Max Temperature 12-Month MA | 1 of 6
Daily Data Points and Averages Throughout the Year

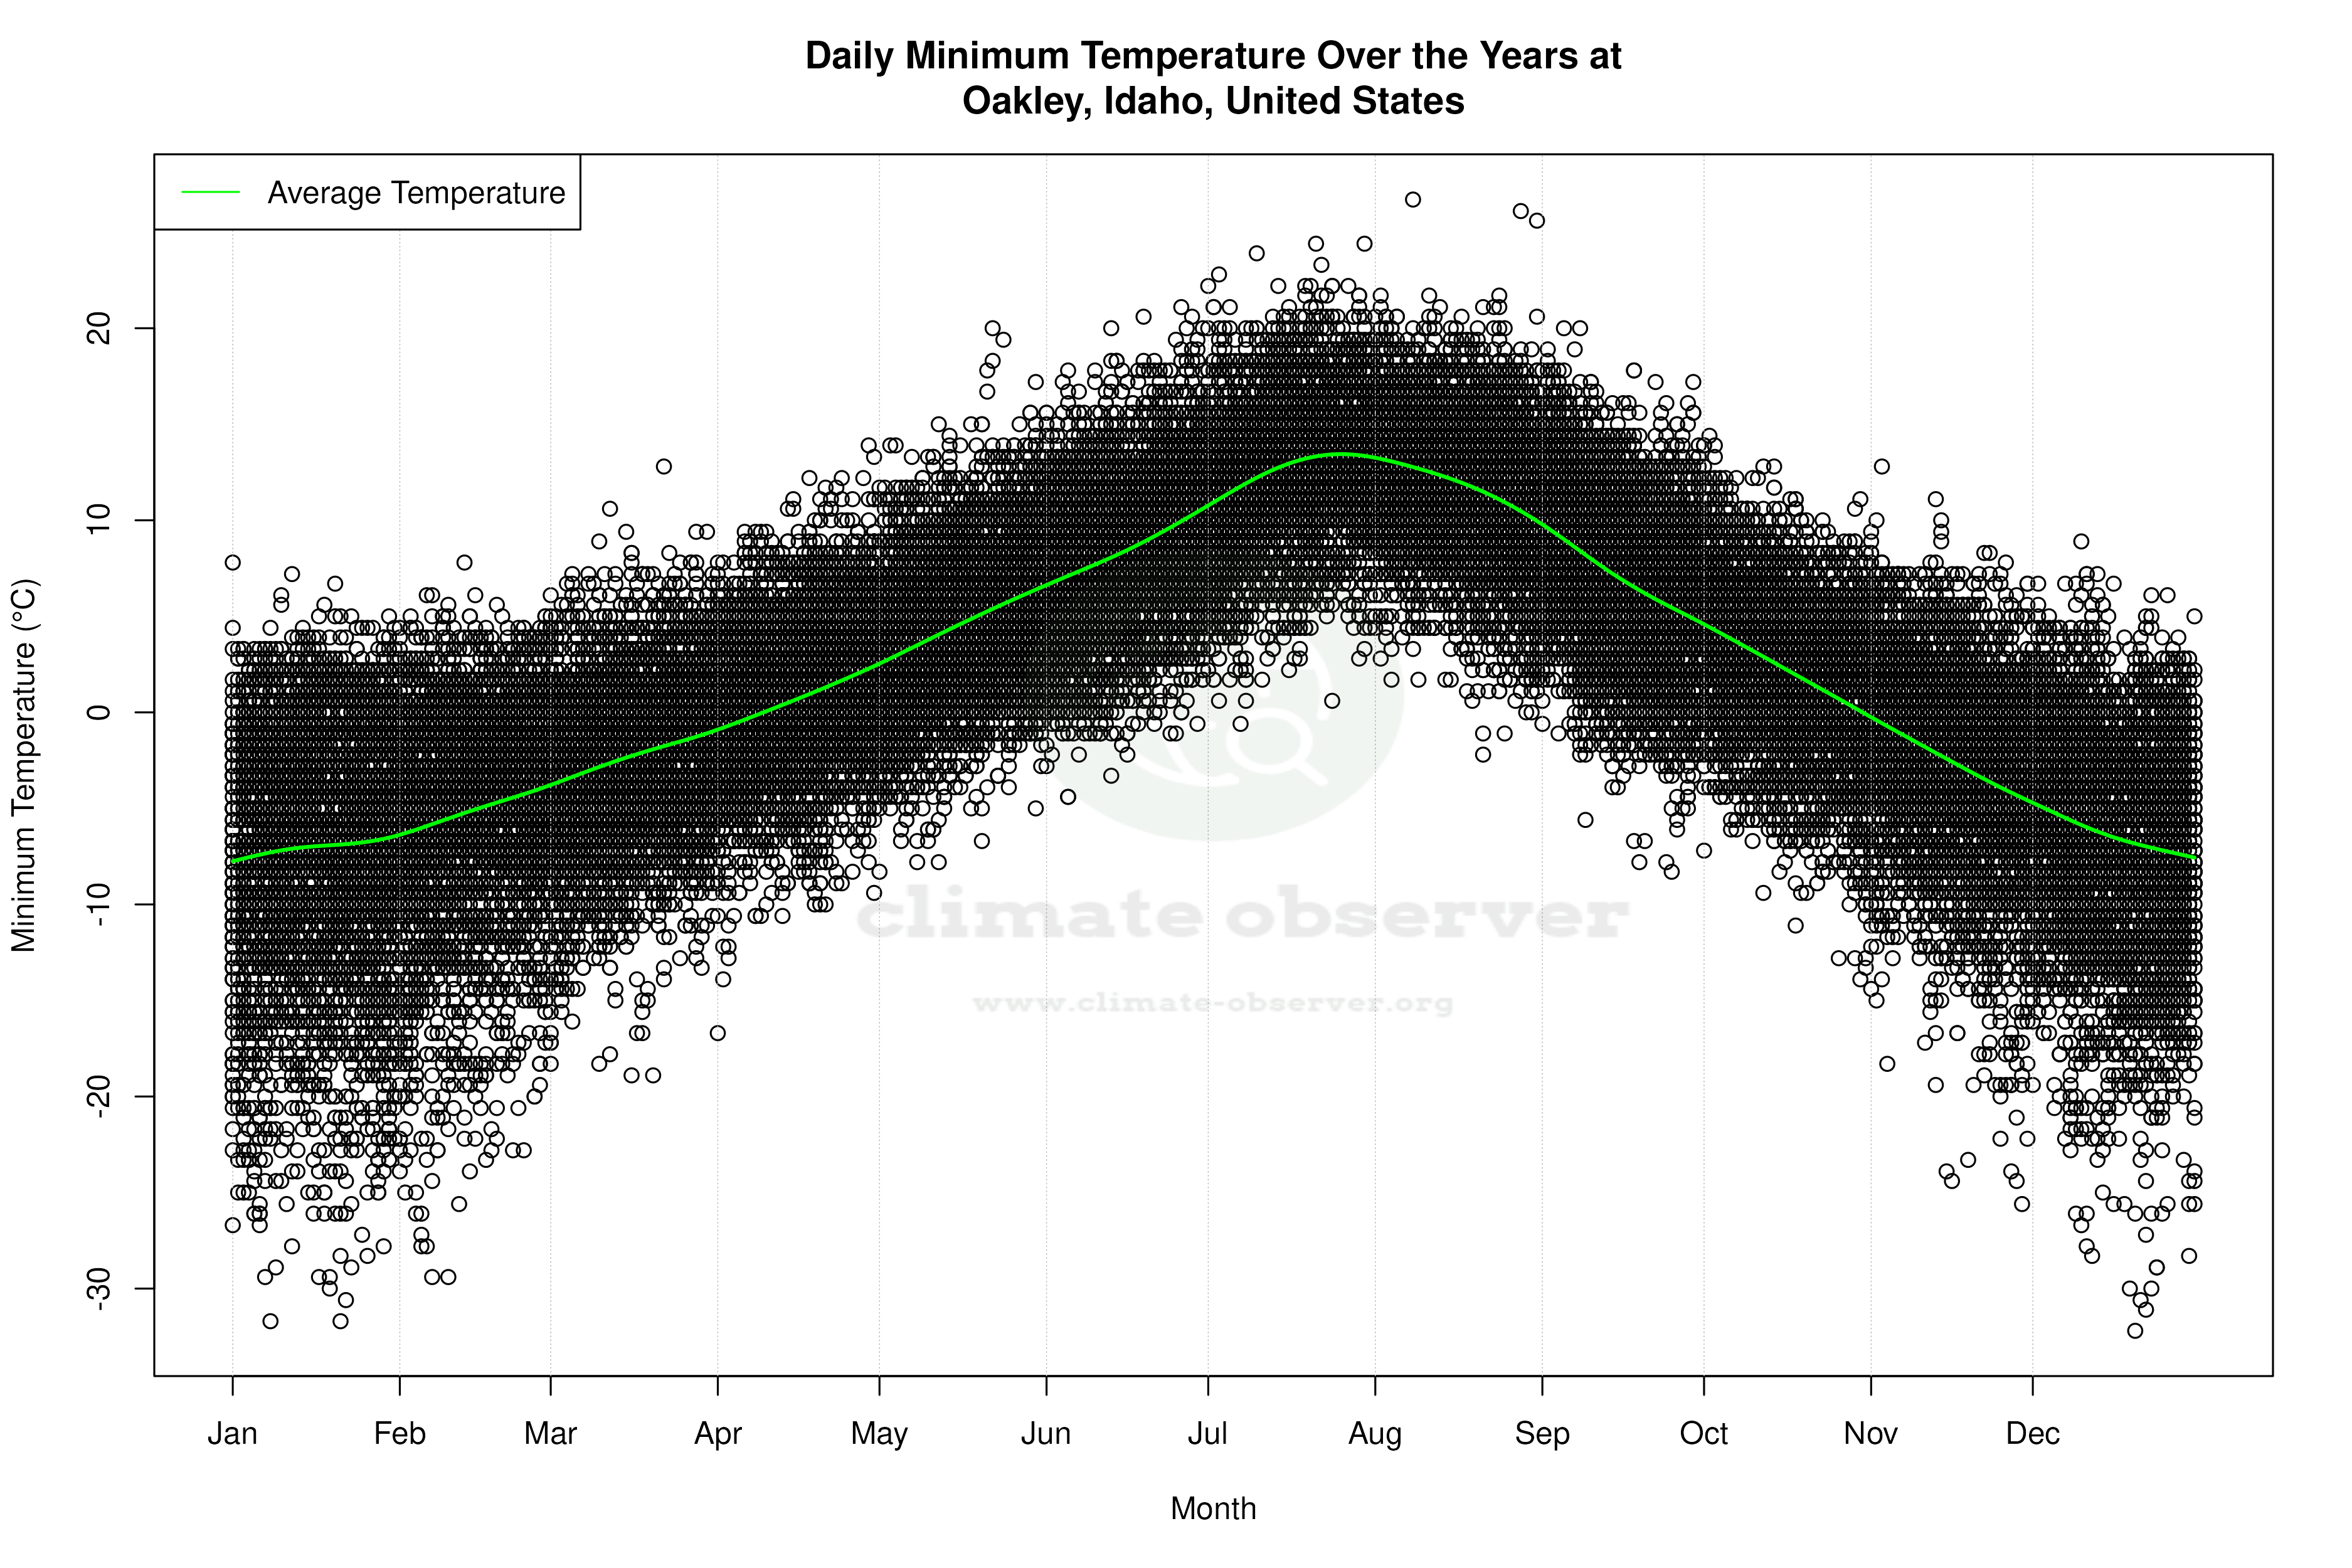


Average Max Temperature Throughout Year | 1 of 5
