Climate for Station: Rock is L&d 15, Illinois, United States
Loading live weather...
Climate Analysis & Overview
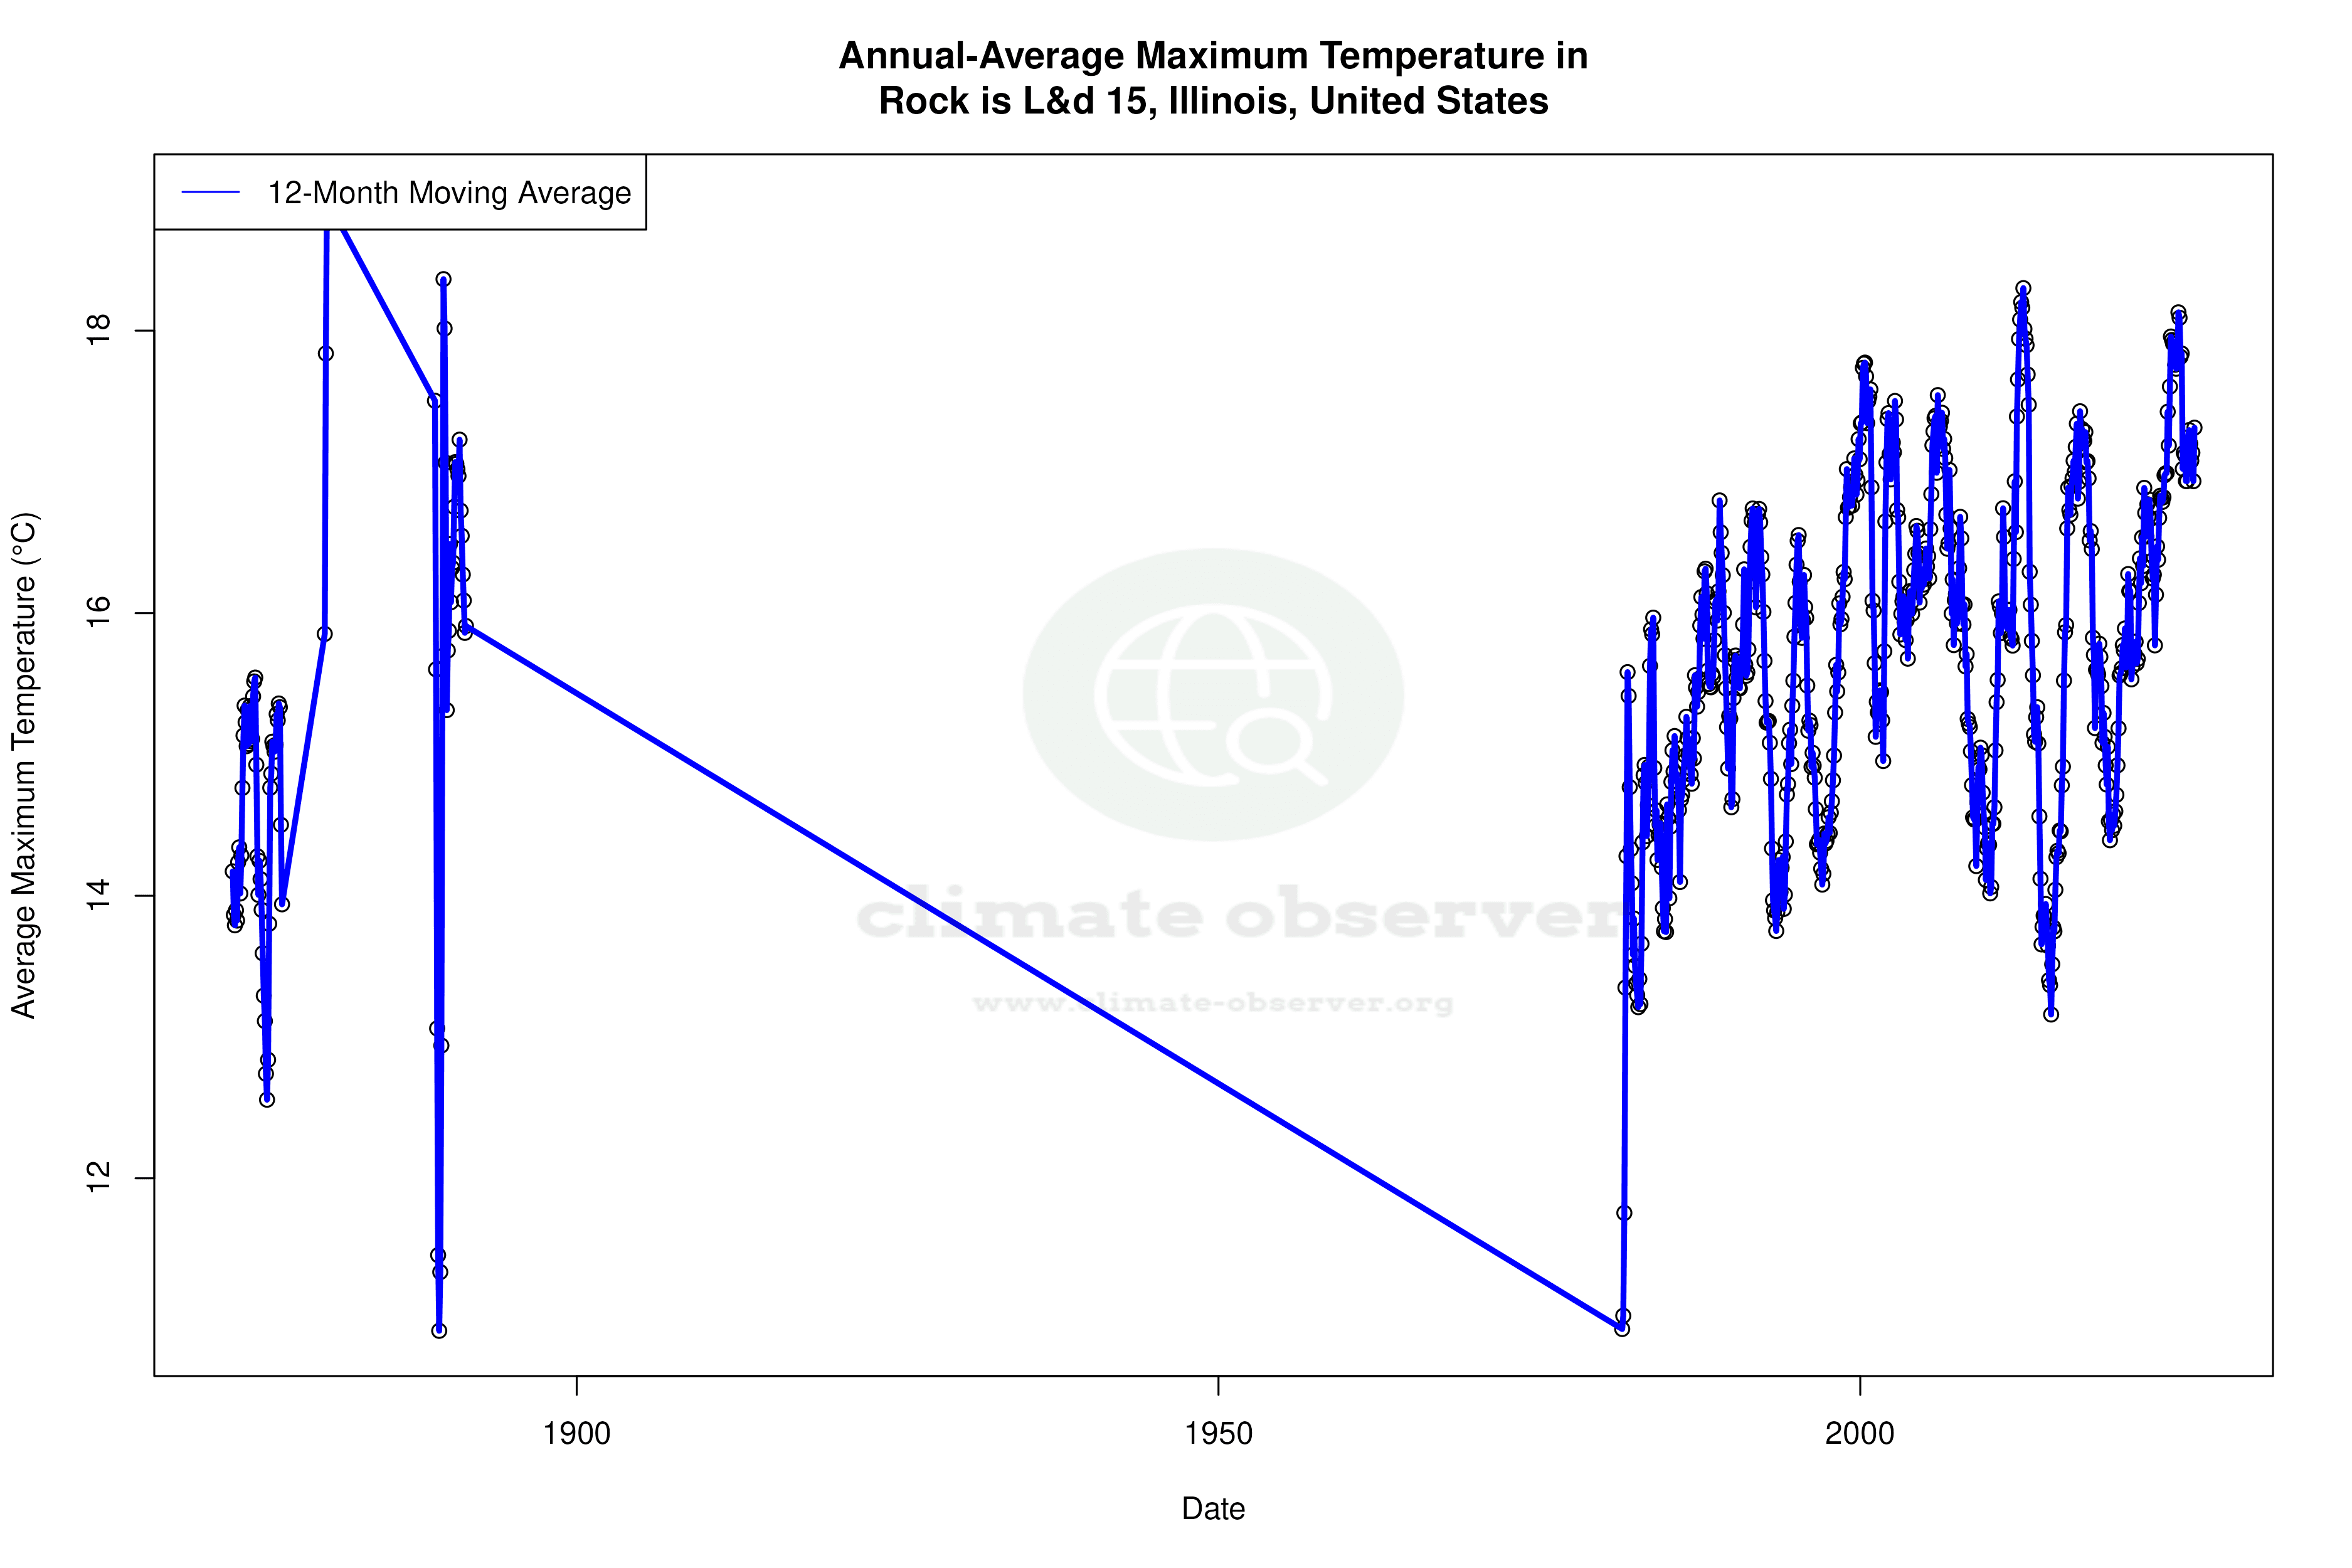
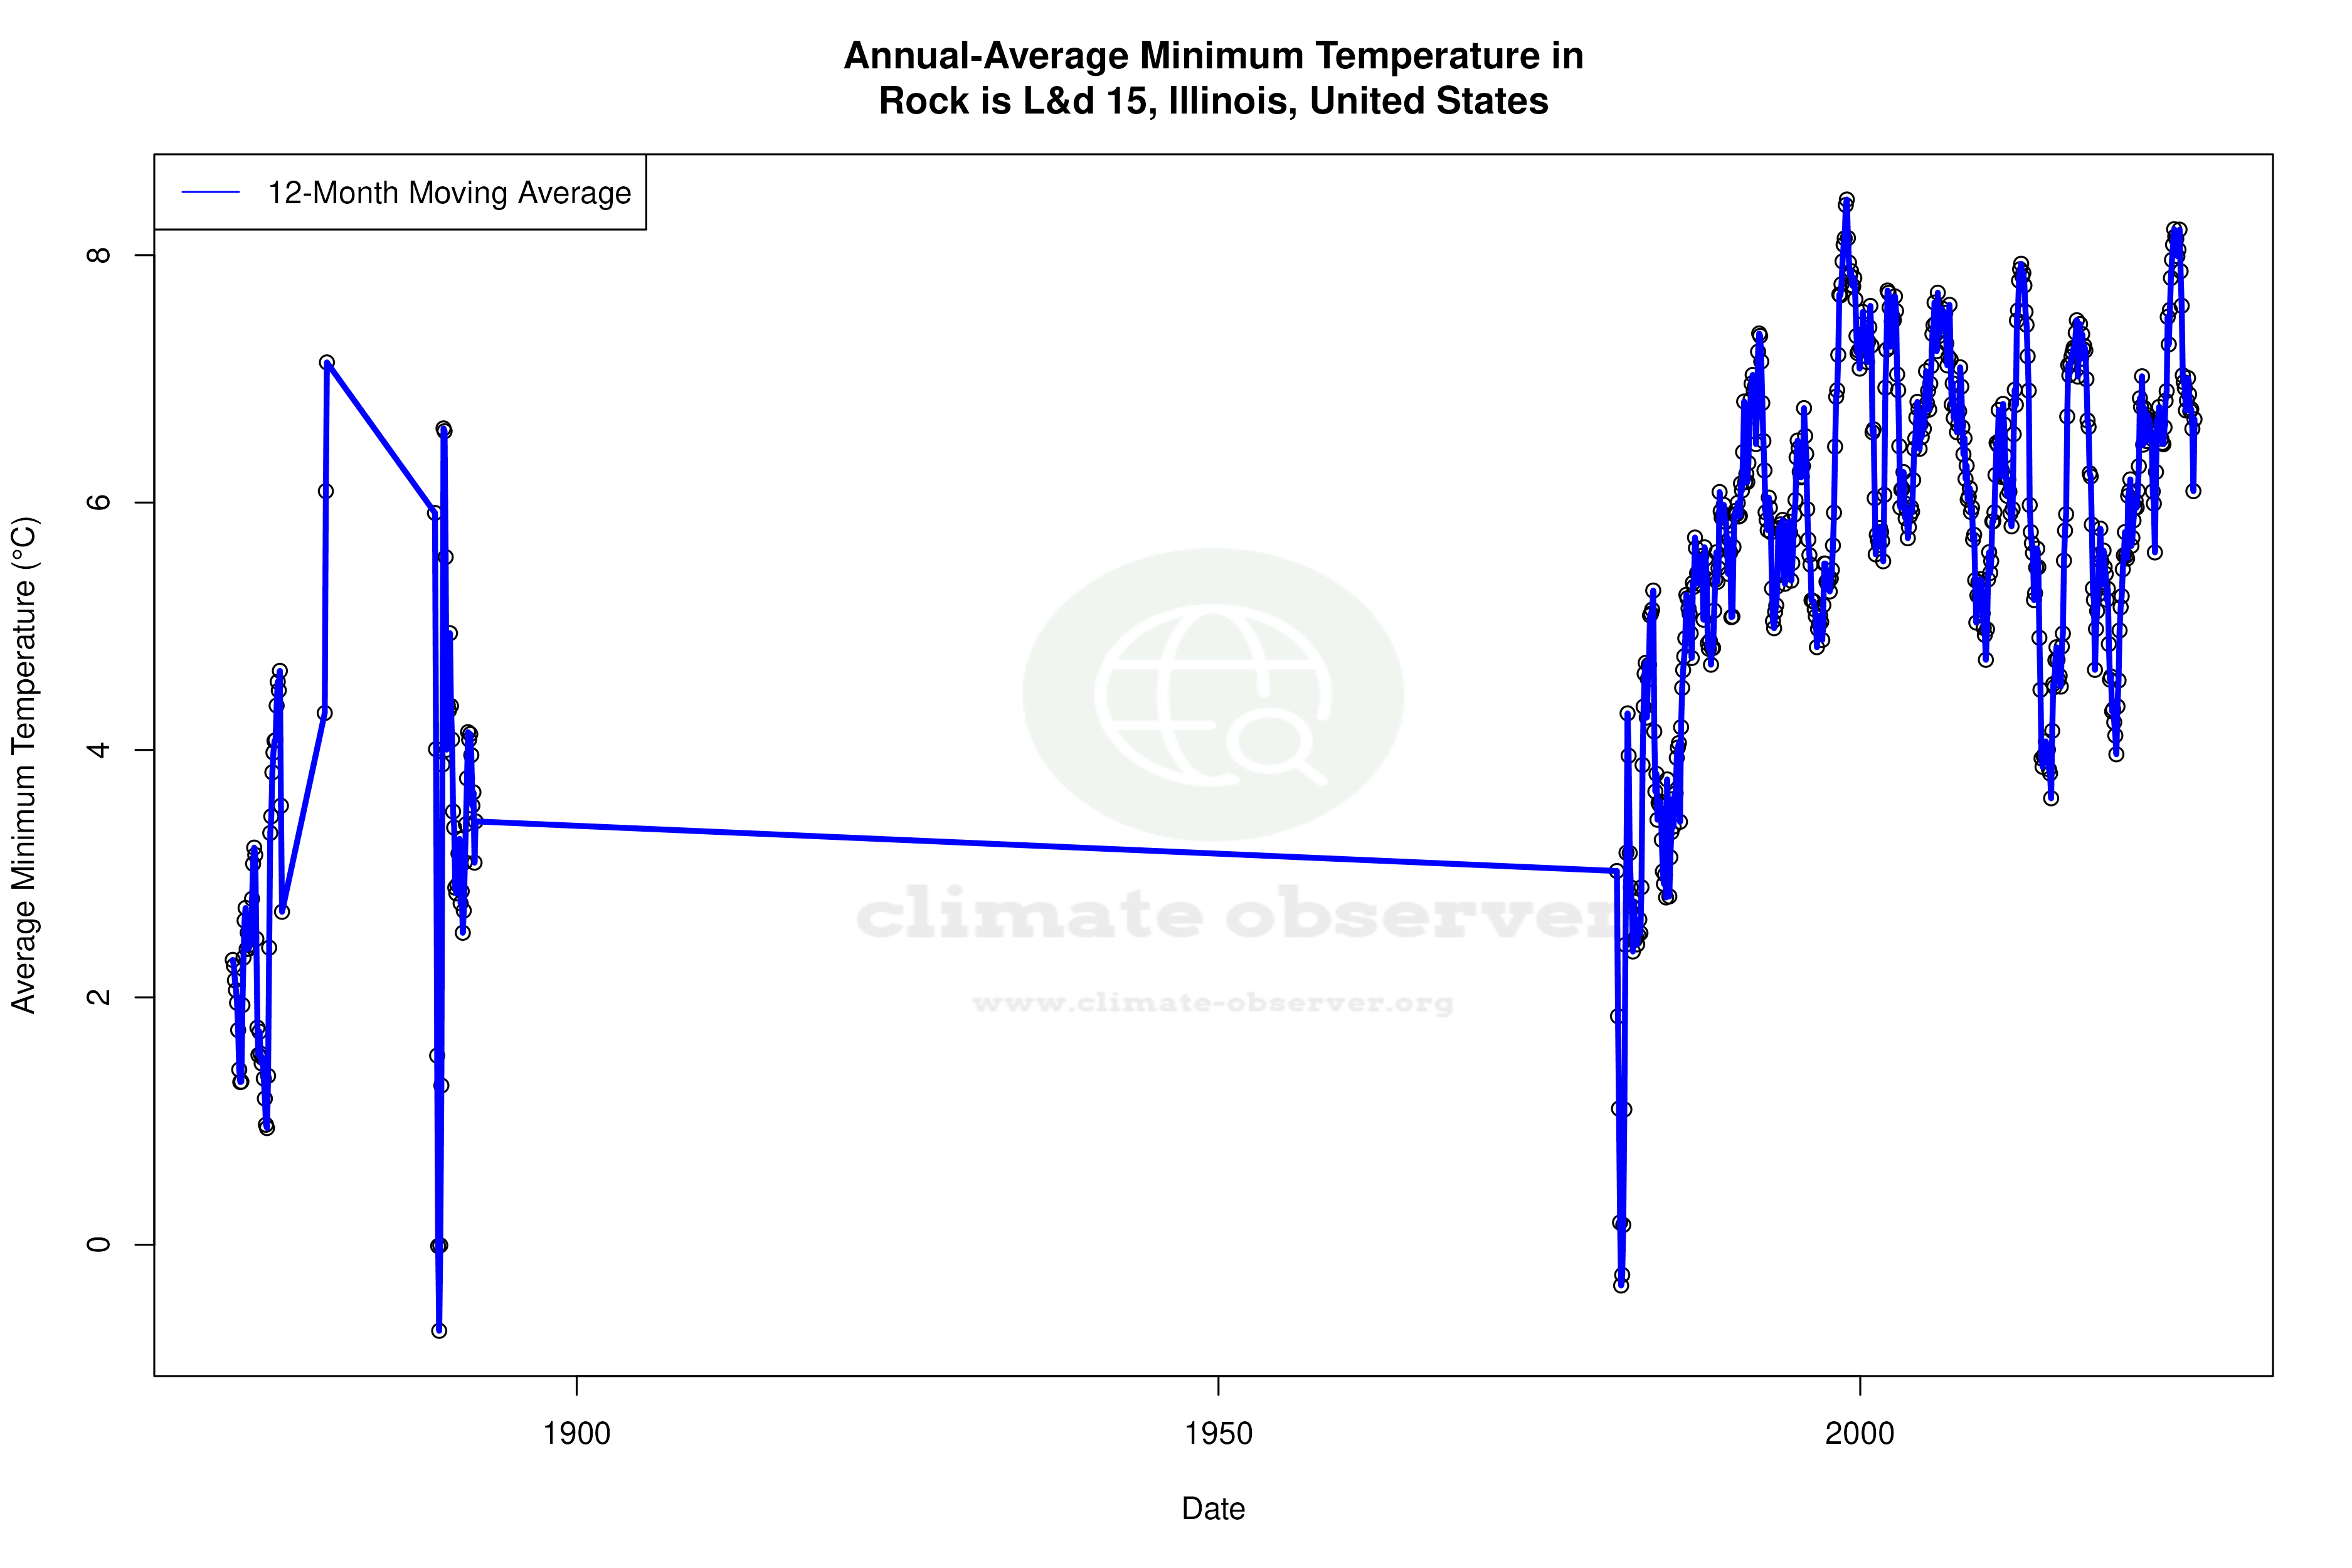
The climate at Lock No. 15 in Rock Island County, Illinois, is experiencing a warming trend, with notable increases in both high and low temperatures over the past decade. Precipitation patterns are becoming more concentrated, suggesting a shift towards fewer, more intense rainfall events.
Warming Trends in the Heartland
Located at 41.5181° N, -90.5647° W, Lock No. 15 sits within the humid continental climate zone, characterised by cold winters and hot summers. Over the past decade, the region has seen a significant warming trend, with high temperatures rising by 1.25°C (2.25°F) and low temperatures increasing by 1.05°C (1.89°F). This recent warming is more pronounced than the all-time trends, which show a more modest rise of 0.08°C (0.14°F) for highs and 0.25°C (0.45°F) for lows. This suggests that the past decade has been particularly warm, possibly influenced by broader regional climate patterns and global warming.
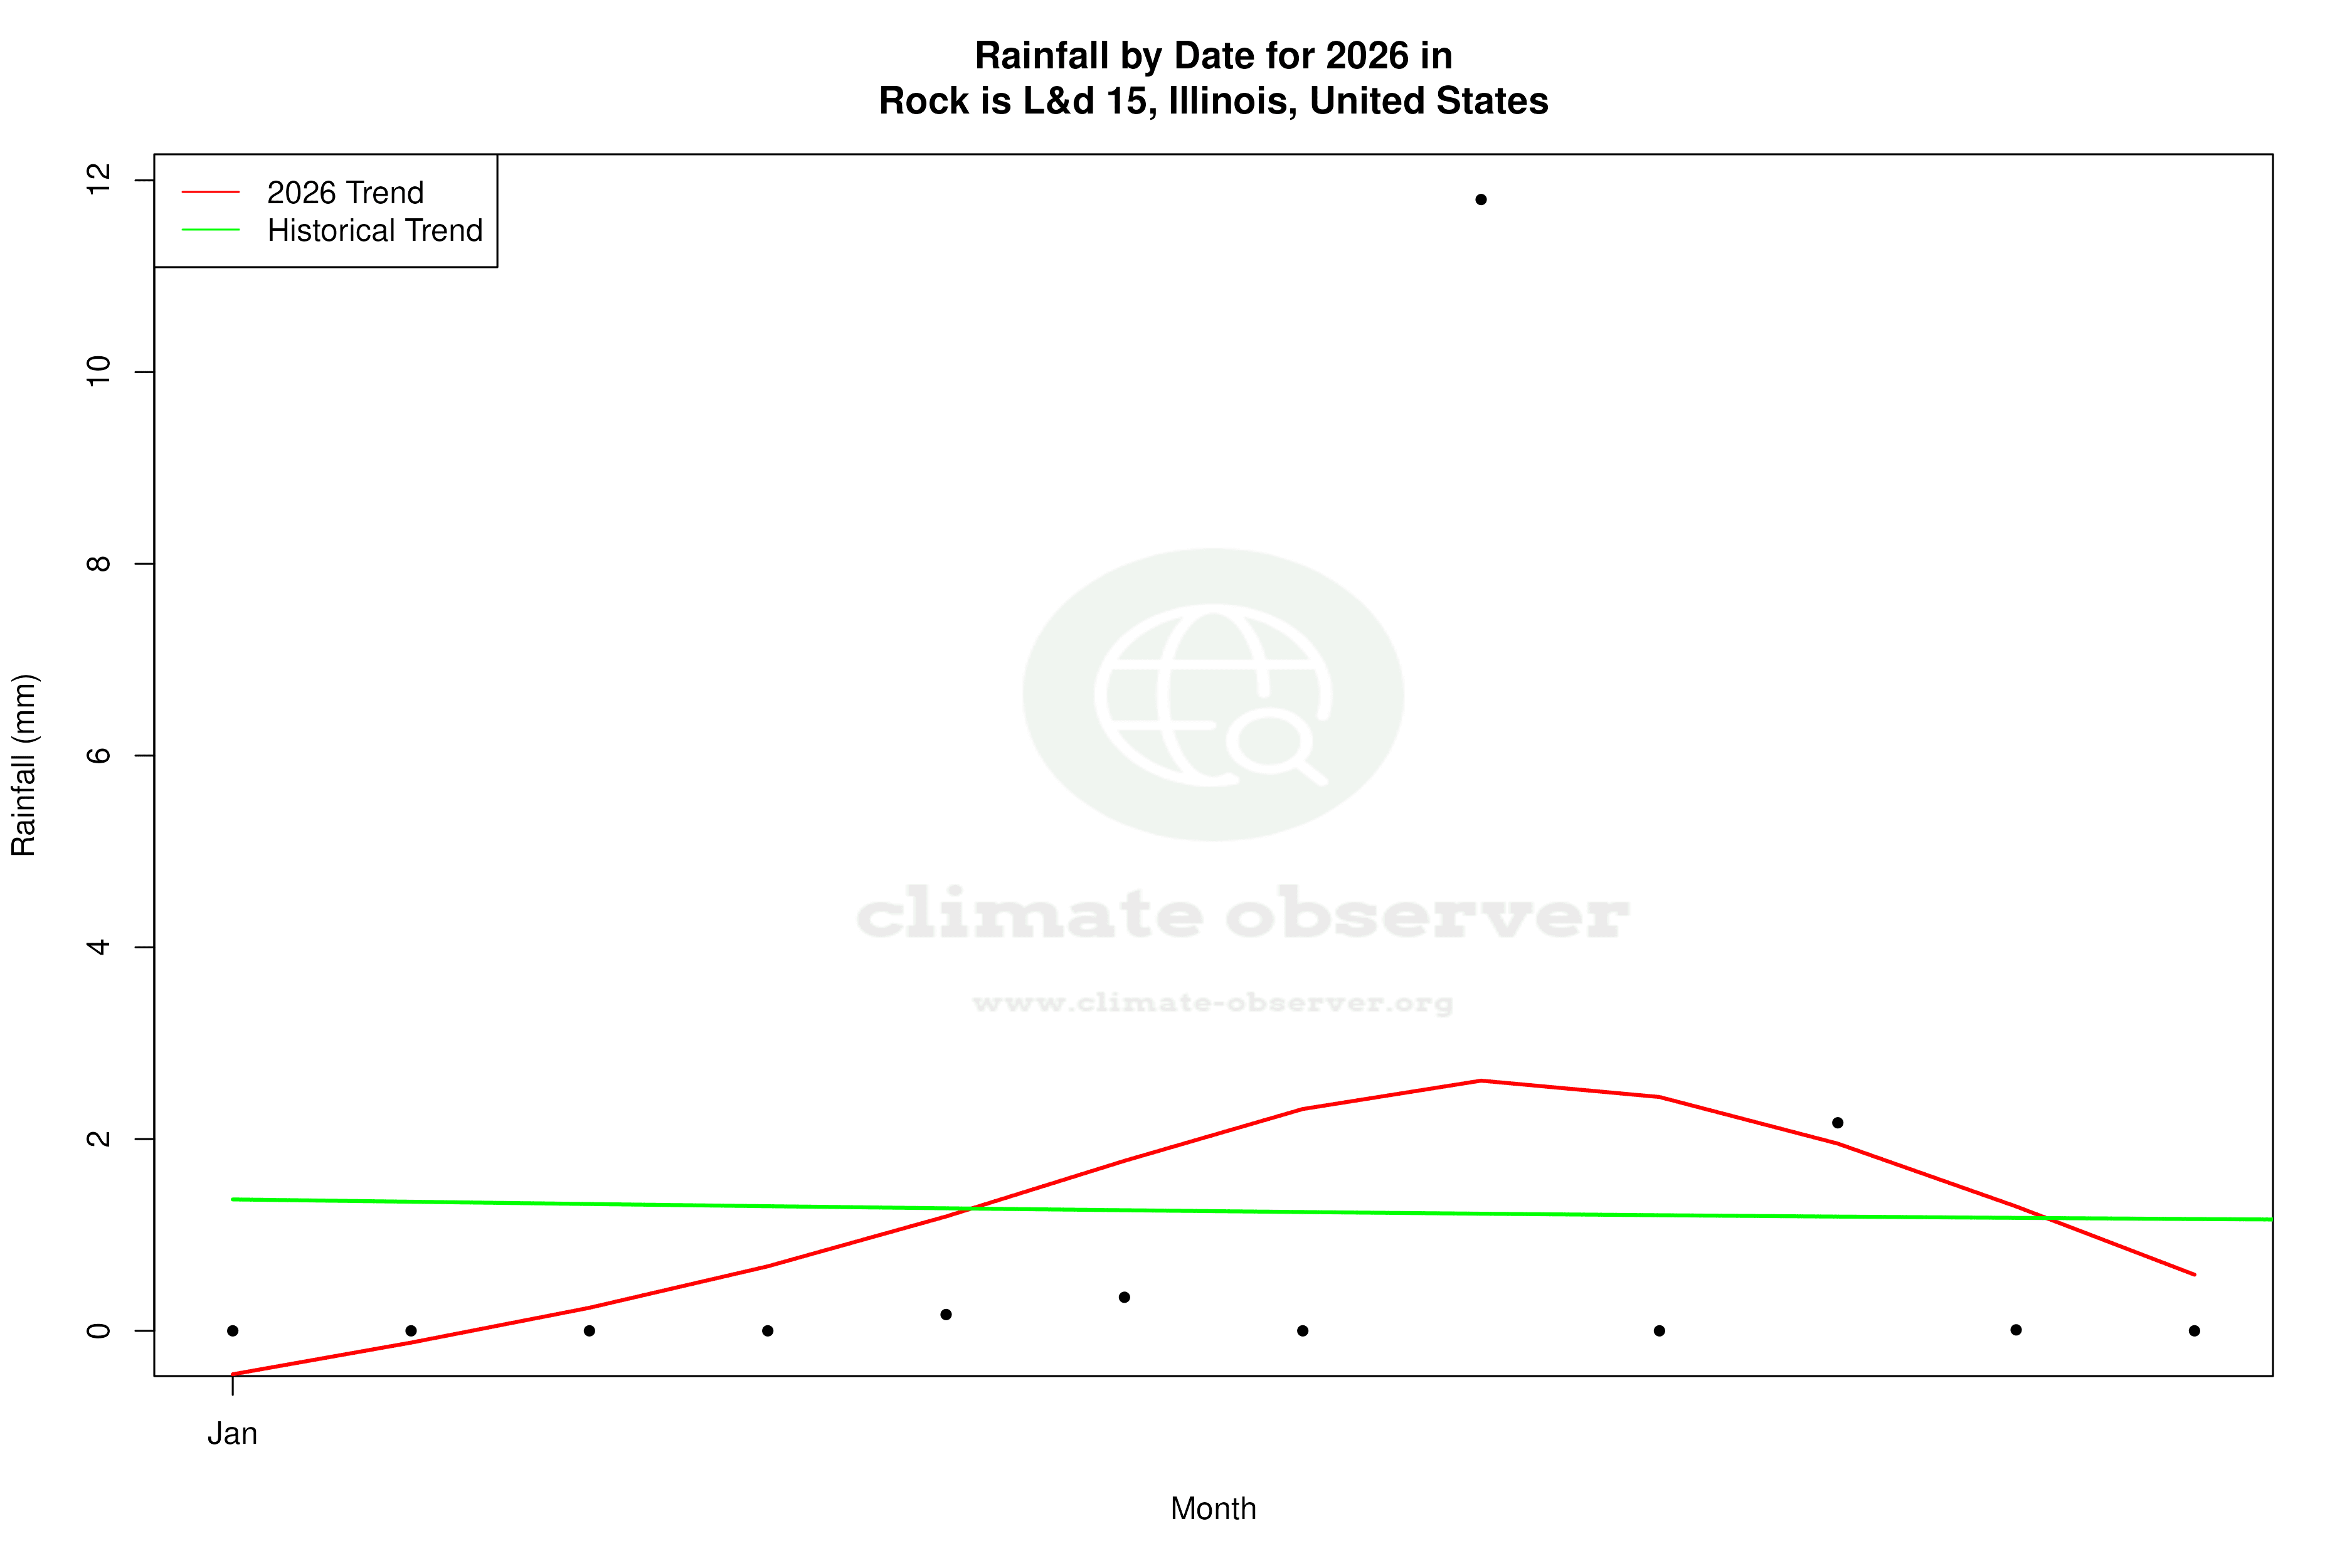
Precipitation Patterns: A Concentrated Shift
The Precipitation Concentration Index (PCI) for Lock No. 15 has increased from a baseline of 13.0 to a current value of 14.2. This indicates a marginal shift towards more concentrated precipitation events, meaning that rain is more likely to fall in fewer, heavier bursts rather than being evenly distributed throughout the year. Such changes can have significant implications for local agriculture and water management, as intense rainfall can lead to increased runoff and potential flooding.
Temperature Extremes: Historical Context
The historical temperature records for Lock No. 15 reveal the region's capacity for extreme weather. The highest recorded temperature is 40.59°C (105.06°F), while the lowest plummets to -38.9°C (-38.0°F). These extremes highlight the variability inherent in the area's climate, influenced by its continental positioning away from the moderating effects of oceans.
Regional Climate Goals and Implications
As part of the United States, Illinois is committed to reducing greenhouse gas emissions and adapting to climate change impacts. The warming trends observed at Lock No. 15 align with national concerns about rising temperatures and their potential to exacerbate issues such as heatwaves and droughts. The shift towards more concentrated precipitation events could also challenge existing infrastructure, necessitating updates to cope with the changing climate dynamics.
Geographical Influences on Climate
The Mississippi River, which flows near Lock No. 15, plays a crucial role in shaping the local climate. It acts as a moisture source, potentially influencing precipitation patterns and contributing to the area's humidity. The river's presence also impacts local weather patterns, often moderating temperatures slightly compared to more inland areas. However, the overall warming trend suggests that these natural buffers may be increasingly challenged by broader climatic shifts.
Station Statistics
10-Year Trend
High: +2.74 °F/decade
Low: +2.04 °F/decade
Rain: -0.022 in/decade
25-Year Trend
High: +0.37 °F/decade
Low: -0.17 °F/decade
Rain: +0.000 in/decade
50-Year Trend
High: +0.69 °F/decade
Low: +0.85 °F/decade
Rain: -0.002 in/decade
All-Time Trend
High: +0.15 °F/decade
Low: +0.45 °F/decade
Rain: -0.001 in/decade
Percentage Above-Average Days
Last 12 Months: 59.2%
This Year: 65.4%
Precipitation Concentration Index (PCI) ℹ️
Last 12 Months: 14.5
Historical Average: 11.8
Percentile Rank of Last 12 Months ℹ️
High: 90th percentile
Low: 71st percentile
Rain: 34th percentile
Change in Variance ℹ️
High: -3.5%
Low: -5.3%
Intraday: -0.0%
Data Coverage
89.5%
First Year of Data
1866
Station Location
Historical Weather Records
| Max High | Avg High | Min High | Max Avg | Avg Avg | Min Avg | Max Low | Avg Low | Min Low | Max Precipitation | Avg Precipitation | Max Snow | Avg Snow | |
|---|---|---|---|---|---|---|---|---|---|---|---|---|---|
| Record | 105.06 °F | — | -11.56 °F | 93.96 °F | — | -23.49 °F | 84.92 °F | — | -38.02 °F | 5.30 in | — | 12.40 in | — |
| January | 69.08 °F | 30.63 °F | -9.94 °F | 50.18 °F | 21.17 °F | -21.62 °F | 46.04 °F | 14.73 °F | -38.02 °F | 1.55 in | 0.05 in | 12.01 in | 0.22 in |
| February | 75.92 °F | 36.00 °F | -9.94 °F | 57.92 °F | 26.22 °F | -23.49 °F | 48.92 °F | 19.01 °F | -24.50 °F | 3.88 in | 0.05 in | 12.40 in | 0.20 in |
| March | 87.98 °F | 48.30 °F | 6.98 °F | 70.52 °F | 38.35 °F | 0.68 °F | 62.06 °F | 29.67 °F | -14.08 °F | 5.30 in | 0.08 in | 5.98 in | 0.08 in |
| April | 93.02 °F | 61.33 °F | 26.06 °F | 74.30 °F | 50.01 °F | 23.94 °F | 69.98 °F | 40.81 °F | 11.97 °F | 2.57 in | 0.11 in | 2.01 in | 0.00 in |
| May | 96.08 °F | 72.59 °F | 39.92 °F | 85.28 °F | 61.60 °F | 36.45 °F | 77.00 °F | 52.09 °F | 24.08 °F | 3.20 in | 0.13 in | 0.00 in | 0.00 in |
| June | 100.04 °F | 81.72 °F | 50.00 °F | 88.20 °F | 71.04 °F | 52.52 °F | 84.02 °F | 62.42 °F | 35.96 °F | 3.74 in | 0.14 in | 0.00 in | 0.00 in |
| July | 104.00 °F | 84.72 °F | 64.04 °F | 93.96 °F | 74.70 °F | 59.00 °F | 84.02 °F | 66.25 °F | 39.02 °F | 5.16 in | 0.12 in | 0.00 in | 0.00 in |
| August | 105.06 °F | 83.42 °F | 61.50 °F | 92.52 °F | 72.63 °F | 53.89 °F | 84.92 °F | 64.60 °F | 42.98 °F | 3.22 in | 0.12 in | 0.00 in | 0.00 in |
| September | 99.82 °F | 76.89 °F | 50.00 °F | 84.74 °F | 64.98 °F | 43.56 °F | 78.98 °F | 56.56 °F | 19.94 °F | 4.00 in | 0.11 in | 0.00 in | 0.00 in |
| October | 95.00 °F | 63.78 °F | 32.00 °F | 78.98 °F | 52.01 °F | 27.82 °F | 71.96 °F | 44.09 °F | 12.02 °F | 2.81 in | 0.08 in | 0.98 in | 0.00 in |
| November | 80.06 °F | 48.18 °F | 6.98 °F | 68.36 °F | 38.57 °F | 8.42 °F | 64.94 °F | 31.54 °F | -11.02 °F | 4.64 in | 0.07 in | 10.00 in | 0.04 in |
| December | 71.96 °F | 35.57 °F | -11.56 °F | 64.04 °F | 26.34 °F | -22.11 °F | 57.02 °F | 20.72 °F | -36.87 °F | 3.76 in | 0.06 in | 5.98 in | 0.10 in |
Data Visualisations
Remove WatermarksCurrent Year Climate Trends vs Historical


Max Temperature this Year | 1 of 6
Climate 12-Month Moving Averages


Max Temperature 12-Month MA | 1 of 6
Daily Data Points and Averages Throughout the Year


Average Max Temperature Throughout Year | 1 of 5
